Crea%ng DEMs From LiDAR Point Cloud Data
|
|
|
- Jeffry Elliott
- 5 years ago
- Views:
Transcription
1 Crea%ng DEMs From LiDAR Point Cloud Data C. Crosby San Diego Supercomputer Center / OpenTopography.org Ramon Arrowsmith SESE, ASU 2011 SCEC LiDAR Short Course

2 Digital ElevaEon Models Digital representaeon of topography / terrain Raster format a grid of squares or pixels ConEnuous surface where Z (elevaeon) is esemated on a regular X,Y grid 2.5D Source: h6p:// Grid resolueon is defined by the size in the horizontal dimension of the pixel 1 meter DEM has pixels 1 m x 1m assigned a single elevaeon value.

3 1 meter grid LiDAR returns from EarthScope data colleceon Example from flat area with livle or no vegetaeon so ground is sampled approx. 5+ Emes per square meter How do we best fit a conenuous surface to these points? UlEmately wish to represent irregularly sampled data on a regularized grid. 1 meter 1 meter
 Figure from Helena Mitasova (NCSU): http://skagit.meas.ncsu.edu/~helena/gmslab/index.")
4 Triangulated Irregular Network (TIN) Inverse Distance Weighted (IDW) Kriging Regularized Spline with Tension and smoothing (RST) Figure from Helena Mitasova (NCSU):
5 Challenges & Approaches: Massive volume of point cloud data that need to be gridded presents unique challenge to many tradieonal GIS interpolaeon approaches. ComputaEon Eme becomes a serious concern Global vs Local fit Global fit uses elevaeons from the whole map area to esemate unknown elevaeon at the grid node. Ex: Kriging, Trend Surface Analysis, splines ComputaEonally intensive and require segmentaeon approaches to break input data into pieces which can be processed independently. Oaen inexact interpolators - Surface does not exactly fit all points. Works well in areas where ground is poorly sampled. Interpolation h6p://webhelp.esri.com/ Local averaging

6 Challenges & Approaches II: Triangular Irregular Networks (TIN) Constructed by triangulaeng a set of points h6p://webhelp.esri.com/ Linear interpolaeon where points are fit exactly ComputaEonally efficient Preserve heterogeneity of detail in sampling Vector- based format so conversion to grid is necessary for many types of analysis.

7 Challenges & Approaches III: Global vs Local fit cont.: Local fit only uses elevaeons immediately surrounding the grid node to esemate elevaeon. Nearest neighbor, local binning, moving window For all points that fall within the defined search area, apply mathemaecal funceon e.g Z mean Z min Z max Z idw ComputaEonally efficient Not interpolaeon! Works well when: Sampling density > grid resolu%on Ex: sampling density = 5 shots/m 2 grid resolueon = 1 m

8 For each search area, calculate: Z mean Z min Z max Z idw Z den OT Points2Grid:


9 Zmax Zmean Zden Zmin Zidw


10 Heterogeneity of surface sampling: B4 shot density maps and profiles
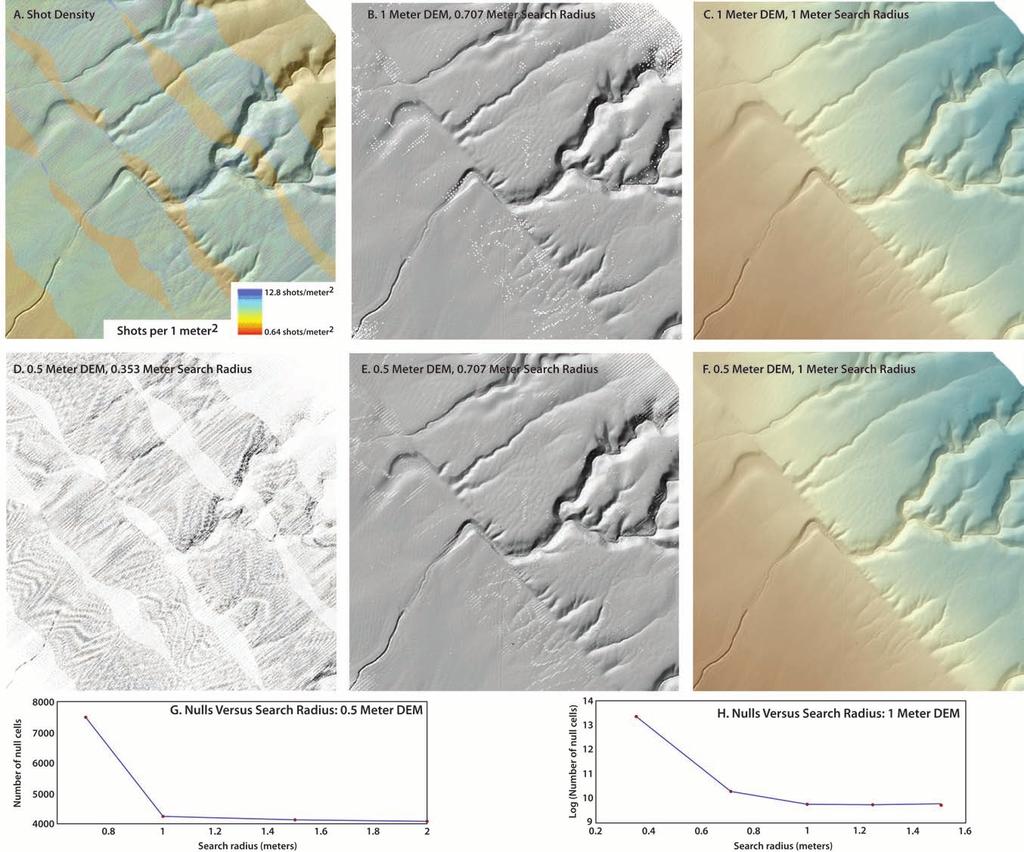
11


.")
12 1m first return surface hillshade Importance of ground return density & DEM resolueon Ground return density may dictate appropriate DEM generaeon approach. TIN or other non- local interpolator necessary in areas of sparse ground returns (right). Returns per 1m 2 full pt cloud Returns per 1m 2 classified ground only

13


 - TIN arefacts in low ground return density - Spline")

14 Role of gridding method in areas of low return density: Extent of areas below Do you prefer visible arefacts or smoothed regions where surface is less well constrained? - Local methods can populate pixels without returns to null (swiss cheese surface very honest representaeon of data) - TIN arefacts in low ground return density - Spline and Kriging = smoother surface low return density less clear TIN arefacts 6 a bare earth DEM TIN 6 a bare earth DEM Spline (RST)
15 Other ConsideraEons: ApplicaEon of data: Different applicaeons may warrant different approaches to grid generaeon e.g. Hydrologic roueng vs. geomorphic mapping Soaware and computaeonal resources available
16 SUMMARY (rules of thumb ): In general for LiDAR data, return density is > than grid resolueon (i.e. muleple returns per meter) In this case, local gridding approaches can produce accurate DEMs and are computaeonally efficient. When the ground is poorly sampled (typically in areas of dense vegetaeon and steep topography), it may be necessary to use an interpolaeon approach such as spline or kriging to fit a surface to fill the gaps and produce a conenuous terrain model. TINs generally work well in all return densiees unless facet arefacts are a problem. LiDAR Return densiees are very heterogeneous & and it is important to understand your data before beginning to work with them.
Crea%ng DEMs From LiDAR Point Cloud Data
 Crea%ng DEMs From LiDAR Point Cloud Data C. Crosby (ccrosby@sdsc.edu) San Diego Supercomputer Center / OpenTopography.org Ramon Arrowsmith SESE, ASU 2009 SCEC LiDAR Short Course Digital ElevaEon Models
GEON Points2Grid Utility Instructions By: Christopher Crosby OpenTopography Facility, San Diego Supercomputer Center
 GEON Points2Grid Utility Instructions By: Christopher Crosby (ccrosby@sdsc.edu) OpenTopography Facility, San Diego Supercomputer Center (Formerly: GEON / Active Tectonics Research Group School of Earth
Point clouds and DEMs
 Point clouds and DEMs J Ramón Arrowsmith School of Earth and Space Exploration Arizona State University Christopher J. Crosby UNAVCO Tutorial notes (April 2016) Point clouds and DEMs 1. Download tahoe.las
Lesson 5 overview. Concepts. Interpolators. Assessing accuracy Exercise 5
 Interpolation Tools Lesson 5 overview Concepts Sampling methods Creating continuous surfaces Interpolation Density surfaces in GIS Interpolators IDW, Spline,Trend, Kriging,Natural neighbors TopoToRaster
A geoinformatics-based approach to the distribution and processing of integrated LiDAR and imagery data to enhance 3D earth systems research
 A geoinformatics-based approach to the distribution and processing of integrated LiDAR and imagery data to enhance 3D earth systems research Christopher J. Crosby, J Ramón Arrowsmith, Jeffrey Connor, Gilead
Documentation for the analysis of the ground-based Alvord Basin LiDAR dataset
 Documentation for the analysis of the ground-based Alvord Basin LiDAR dataset Introduction David E. Haddad david.e.haddad@asu.edu July 2008 This report presents the procedures carried out, the results
GEOGRAPHIC INFORMATION SYSTEMS Lecture 25: 3D Analyst
 GEOGRAPHIC INFORMATION SYSTEMS Lecture 25: 3D Analyst 3D Analyst - 3D Analyst is an ArcGIS extension designed to work with TIN data (triangulated irregular network) - many of the tools in 3D Analyst also
Surface Creation & Analysis with 3D Analyst
 Esri International User Conference July 23 27 San Diego Convention Center Surface Creation & Analysis with 3D Analyst Khalid Duri Surface Basics Defining the surface Representation of any continuous measurement
What can we represent as a Surface?
 Geography 38/42:376 GIS II Topic 7: Surface Representation and Analysis (Chang: Chapters 13 & 15) DeMers: Chapter 10 What can we represent as a Surface? Surfaces can be used to represent: Continuously
Esri International User Conference. July San Diego Convention Center. Lidar Solutions. Clayton Crawford
 Esri International User Conference July 23 27 San Diego Convention Center Lidar Solutions Clayton Crawford Outline Data structures, tools, and workflows Assessing lidar point coverage and sample density
Lab 12: Sampling and Interpolation
 Lab 12: Sampling and Interpolation What You ll Learn: -Systematic and random sampling -Majority filtering -Stratified sampling -A few basic interpolation methods Data for the exercise are in the L12 subdirectory.
Creating raster DEMs and DSMs from large lidar point collections. Summary. Coming up with a plan. Using the Point To Raster geoprocessing tool
 Page 1 of 5 Creating raster DEMs and DSMs from large lidar point collections ArcGIS 10 Summary Raster, or gridded, elevation models are one of the most common GIS data types. They can be used in many ways
Surface Analysis with 3D Analyst
 2013 Esri International User Conference July 8 12, 2013 San Diego, California Technical Workshop Surface Analysis with 3D Analyst Khalid H. Duri Esri UC2013. Technical Workshop. Why use 3D GIS? Because
Lecture 9. Raster Data Analysis. Tomislav Sapic GIS Technologist Faculty of Natural Resources Management Lakehead University
 Lecture 9 Raster Data Analysis Tomislav Sapic GIS Technologist Faculty of Natural Resources Management Lakehead University Raster Data Model The GIS raster data model represents datasets in which square
IMPROVING THE ACCURACY OF DIGITAL TERRAIN MODELS
 STUDIA UNIV. BABEŞ BOLYAI, INFORMATICA, Volume XLV, Number 1, 2000 IMPROVING THE ACCURACY OF DIGITAL TERRAIN MODELS GABRIELA DROJ Abstract. The change from paper maps to GIS, in various kinds of geographical
Geol 588. GIS for Geoscientists II. Zonal functions. Feb 22, Zonal statistics. Interpolation. Zonal statistics Sp. Analyst Tools - Zonal.
 Zonal functions Geol 588 GIS for Geoscientists II Feb 22, 2011 Zonal statistics Interpolation Zonal statistics Sp. Analyst Tools - Zonal Choose correct attribute for zones (usually: must be unique ID for
GEOGRAPHIC INFORMATION SYSTEMS Lecture 24: Spatial Analyst Continued
 GEOGRAPHIC INFORMATION SYSTEMS Lecture 24: Spatial Analyst Continued Spatial Analyst - Spatial Analyst is an ArcGIS extension designed to work with raster data - in lecture I went through a series of demonstrations
Notes on Lidar interpolation
 Notes on Lidar interpolation J Ramón Arrowsmith with contributions from Chris Crosby and Jeff Conner Department of Geological Sciences Arizona State University Tempe, AZ, 85287 ramon.arrowsmith@asu.edu
Watershed Sciences 4930 & 6920 GEOGRAPHIC INFORMATION SYSTEMS
 HOUSEKEEPING Watershed Sciences 4930 & 6920 GEOGRAPHIC INFORMATION SYSTEMS Quizzes Lab 8? WEEK EIGHT Lecture INTERPOLATION & SPATIAL ESTIMATION Joe Wheaton READING FOR TODAY WHAT CAN WE COLLECT AT POINTS?
Lab 12: Sampling and Interpolation
 Lab 12: Sampling and Interpolation What You ll Learn: -Systematic and random sampling -Majority filtering -Stratified sampling -A few basic interpolation methods Videos that show how to copy/paste data
[Youn *, 5(11): November 2018] ISSN DOI /zenodo Impact Factor
![[Youn *, 5(11): November 2018] ISSN DOI /zenodo Impact Factor](/thumbs/91/105079225.jpg "[Youn *, 5(11): November 2018] ISSN DOI /zenodo Impact Factor") GLOBAL JOURNAL OF ENGINEERING SCIENCE AND RESEARCHES AUTOMATIC EXTRACTING DEM FROM DSM WITH CONSECUTIVE MORPHOLOGICAL FILTERING Junhee Youn *1 & Tae-Hoon Kim 2 *1,2 Korea Institute of Civil Engineering
GLOBAL JOURNAL OF ENGINEERING SCIENCE AND RESEARCHES AUTOMATIC EXTRACTING DEM FROM DSM WITH CONSECUTIVE MORPHOLOGICAL FILTERING Junhee Youn *1 & Tae-Hoon Kim 2 *1,2 Korea Institute of Civil Engineering
Tutorial 18: 3D and Spatial Analyst - Creating a TIN and Visual Analysis
 Tutorial 18: 3D and Spatial Analyst - Creating a TIN and Visual Analysis Module content 18.1. Creating a TIN 18.2. Spatial Analyst Viewsheds, Slopes, Hillshades and Density. 18.1 Creating a TIN Sometimes
Lidar and GIS: Applications and Examples. Dan Hedges Clayton Crawford
 Lidar and GIS: Applications and Examples Dan Hedges Clayton Crawford Outline Data structures, tools, and workflows Assessing lidar point coverage and sample density Creating raster DEMs and DSMs Data area
Statistical surfaces and interpolation. This is lecture ten
 Statistical surfaces and interpolation This is lecture ten Data models for representation of surfaces So far have considered field and object data models (represented by raster and vector data structures).
National Science Foundation Engineering Research Center. Bingcai Zhang BAE Systems San Diego, CA
 Bingcai Zhang BAE Systems San Diego, CA 92127 Bingcai.zhang@BAESystems.com Introduction It is a trivial task for a five-year-old child to recognize and name an object such as a car, house or building.
Contents of Lecture. Surface (Terrain) Data Models. Terrain Surface Representation. Sampling in Surface Model DEM
 Data Models. Terrain Surface Representation. Sampling in Surface Model DEM") Lecture 13: Advanced Data Models: Terrain mapping and Analysis Contents of Lecture Surface Data Models DEM GRID Model TIN Model Visibility Analysis Geography 373 Spring, 2006 Changjoo Kim 11/29/2006 1
Lecture 13: Advanced Data Models: Terrain mapping and Analysis Contents of Lecture Surface Data Models DEM GRID Model TIN Model Visibility Analysis Geography 373 Spring, 2006 Changjoo Kim 11/29/2006 1
Introduction to 3D Analysis. Jinwu Ma Jie Chang Khalid Duri
 Introduction to 3D Analysis Jinwu Ma Jie Chang Khalid Duri Area & Volume 3D Analyst Features Detect Change Determine Cut/Fill Calculate Surface Area & Volume Data Management Data Creation Data Conversion
Creating Digital Elevation Model Using a Mobile Device
 Name : Ali Ihsan Durmaz UnitID : aidurmaz Creating Digital Elevation Model Using a Mobile Device ABSTRACT DEM (Digital Elevation Models) is the best way to interpret topography on the ground. In recent
Lecture 4: Digital Elevation Models
 Lecture 4: Digital Elevation Models GEOG413/613 Dr. Anthony Jjumba 1 Digital Terrain Modeling Terms: DEM, DTM, DTEM, DSM, DHM not synonyms. The concepts they illustrate are different Digital Terrain Modeling
Geostatistics Predictions with Deterministic Procedures
 Instituto Superior de Estatística e Gestão de Informação Universidade Nova de Lisboa Master of Science in Geospatial Technologies Geostatistics Predictions with Deterministic Procedures Carlos Alberto
GIS Tools - Geometry. A GIS stores data as different layers of information Different feature types are stored in individual files.
 A Definition of GIS GIS is a system of hardware, software, and procedures designed to support the capture, management, manipulation, analysis, modeling and display of spatially referenced data for solving
DIGITAL TERRAIN MODELLING. Endre Katona University of Szeged Department of Informatics
 DIGITAL TERRAIN MODELLING Endre Katona University of Szeged Department of Informatics katona@inf.u-szeged.hu The problem: data sources data structures algorithms DTM = Digital Terrain Model Terrain function:
Tools, Tips, and Workflows Exporting Final Product LP360
 LP360 Support Revision 1.0 l Final products can be exported from LIDAR data using either LP360 command line executables or the LP360 Export Wizard. Some export functions and resulting products include,
Enhanced Access to High-Resolution LiDAR Topography through Cyberinfrastructure-Based Data Distribution and Processing
 Enhanced Access to High-Resolution LiDAR Topography through Cyberinfrastructure-Based Data Distribution and Processing Christopher J. Crosby, J Ramón Arrowsmith Jeffrey Connor, Gilead Wurman Efrat Jaeger-Frank,
University of West Hungary, Faculty of Geoinformatics. Béla Márkus. Spatial Analysis 5. module SAN5. 3D analysis
 University of West Hungary, Faculty of Geoinformatics Béla Márkus Spatial Analysis 5. module SAN5 3D analysis SZÉKESFEHÉRVÁR 2010 The right to this intellectual property is protected by the 1999/LXXVI
Lecture 22 - Chapter 8 (Raster Analysis, part 3)
") GEOL 452/552 - GIS for Geoscientists I Lecture 22 - Chapter 8 (Raster Analysis, part 3) Today: Zonal Analysis (statistics) for polygons, lines, points, interpolation (IDW), Effects Toolbar, analysis masks
GEOL 452/552 - GIS for Geoscientists I Lecture 22 - Chapter 8 (Raster Analysis, part 3) Today: Zonal Analysis (statistics) for polygons, lines, points, interpolation (IDW), Effects Toolbar, analysis masks
Point Cloud Classification
 Point Cloud Classification Introduction VRMesh provides a powerful point cloud classification and feature extraction solution. It automatically classifies vegetation, building roofs, and ground points.
Maps as Numbers: Data Models
 Maps as Numbers: Data Models vertices E Reality S E S arcs S E Conceptual Models nodes E Logical Models S Start node E End node S Physical Models 1 The Task An accurate, registered, digital map that can
On the Selection of an Interpolation Method for Creating a Terrain Model (TM) from LIDAR Data
 from LIDAR Data") On the Selection of an Interpolation Method for Creating a Terrain Model (TM) from LIDAR Data Tarig A. Ali Department of Technology and Geomatics East Tennessee State University P. O. Box 70552, Johnson
On the Selection of an Interpolation Method for Creating a Terrain Model (TM) from LIDAR Data Tarig A. Ali Department of Technology and Geomatics East Tennessee State University P. O. Box 70552, Johnson
Creating Surfaces. Steve Kopp Steve Lynch
 Steve Kopp Steve Lynch Overview Learn the types of surfaces and the data structures used to store them Emphasis on surface interpolation Learn the interpolation workflow Understand how interpolators work
Lecture 23 - LiDAR. GEOL 452/552 - GIS for Geoscientists I. Scanning Lidar. 30 m DEM. Lidar representations:
 GEOL 452/552 - GIS for Geoscientists I Lecture 23 - LiDAR LiDAR - some background (thanks to Chris Kahle, DNR) Converting Lidar point data to a raster Look at online lidar data for Iowa (1m hillshaded)
Restricted Bathymetric Tracklines Interpolation
 Restricted Bathymetric Tracklines Interpolation Wenli Li, W. Randolph Franklin, Salles V. G. Magalhães, Marcus V. A. Andrade Rensselaer Polytechnic Institute liw9@rpi.edu, mail@wrfranklin.org, vianas2@rpi.edu,
Algorithms for GIS csci3225
 Algorithms for GIS csci3225 Laura Toma Bowdoin College Spatial data types and models Spatial data in GIS satellite imagery planar maps surfaces networks point cloud (LiDAR) Spatial data in GIS satellite
Light Detection and Ranging (LiDAR)
") Light Detection and Ranging (LiDAR) http://code.google.com/creative/radiohead/ Types of aerial sensors passive active 1 Active sensors for mapping terrain Radar transmits microwaves in pulses determines
Light Detection and Ranging (LiDAR) http://code.google.com/creative/radiohead/ Types of aerial sensors passive active 1 Active sensors for mapping terrain Radar transmits microwaves in pulses determines
Dijkstra's Algorithm
 Shortest Path Algorithm Dijkstra's Algorithm To find the shortest path from the origin node to the destination node No matrix calculation Floyd s Algorithm To find all the shortest paths from the nodes
Lecture 21 - Chapter 8 (Raster Analysis, part2)
") GEOL 452/552 - GIS for Geoscientists I Lecture 21 - Chapter 8 (Raster Analysis, part2) Today: Digital Elevation Models (DEMs), Topographic functions (surface analysis): slope, aspect hillshade, viewshed,
GEOL 452/552 - GIS for Geoscientists I Lecture 21 - Chapter 8 (Raster Analysis, part2) Today: Digital Elevation Models (DEMs), Topographic functions (surface analysis): slope, aspect hillshade, viewshed,
Geographic Surfaces. David Tenenbaum EEOS 383 UMass Boston
 Geographic Surfaces Up to this point, we have talked about spatial data models that operate in two dimensions How about the rd dimension? Surface the continuous variation in space of a third dimension
Algorithms for GIS. Spatial data: Models and representation (part I) Laura Toma. Bowdoin College
 Laura Toma. Bowdoin College") Algorithms for GIS Spatial data: Models and representation (part I) Laura Toma Bowdoin College Outline Spatial data in GIS applications Point data Networks Terrains Planar maps and meshes Data structures
Algorithms for GIS Spatial data: Models and representation (part I) Laura Toma Bowdoin College Outline Spatial data in GIS applications Point data Networks Terrains Planar maps and meshes Data structures
IDL Lab: Interpolation and Displaying of Lidar Data
 IDL Lab: Interpolation and Displaying of Lidar Data The purpose of this lab is to introduce you to some IDL functions for interpolation and visualization. Lidar is becoming an important tool for getting
Introduction to Lidar Technology and Data Collection
 Introduction to Lidar Technology and Data Collection Christopher Crosby San Diego Supercomputer Center / OpenTopography (with content adapted from NCALM, David Phillips (UNVACO), Ian Madin (DOGAMI), Ralph
DEM Artifacts: Layering or pancake effects
 Outcomes DEM Artifacts: Stream networks & watersheds derived using ArcGIS s HYDROLOGY routines are only as good as the DEMs used. - Both DEM examples below have problems - Lidar and SRTM DEM products are
Spatial Interpolation & Geostatistics
 (Z i Z j ) 2 / 2 Spatial Interpolation & Geostatistics Lag Lag Mean Distance between pairs of points 1 Tobler s Law All places are related, but nearby places are related more than distant places Corollary:
Esri International User Conference. San Diego, California. Technical Workshops. July Creating Surfaces. Steve Kopp and Steve Lynch
 Esri International User Conference San Diego, California Technical Workshops July 2011 Creating Surfaces Steve Kopp and Steve Lynch Overview Learn the types of surfaces and the data structures used to
COMPONENTS. The web interface includes user administration tools, which allow companies to efficiently distribute data to internal or external users.
 COMPONENTS LASERDATA LIS is a software suite for LiDAR data (TLS / MLS / ALS) management and analysis. The software is built on top of a GIS and supports both point and raster data. The following software
The 3D Analyst extension extends ArcGIS to support surface modeling and 3- dimensional visualization. 3D Shape Files
 NRM 435 Spring 2016 ArcGIS 3D Analyst Page#1 of 9 0B3D Analyst Extension The 3D Analyst extension extends ArcGIS to support surface modeling and 3- dimensional visualization. 3D Shape Files Analogous to
Lecture 6: GIS Spatial Analysis. GE 118: INTRODUCTION TO GIS Engr. Meriam M. Santillan Caraga State University
 Lecture 6: GIS Spatial Analysis GE 118: INTRODUCTION TO GIS Engr. Meriam M. Santillan Caraga State University 1 Spatial Data It can be most simply defined as information that describes the distribution
Final project: Lecture 21 - Chapter 8 (Raster Analysis, part2) GEOL 452/552 - GIS for Geoscientists I
 GEOL 452/552 - GIS for Geoscientists I") GEOL 452/552 - GIS for Geoscientists I Lecture 21 - Chapter 8 (Raster Analysis, part2) Talk about class project (copy follow_along_data\ch8a_class_ex into U:\ArcGIS\ if needed) Catch up with lecture 20
GEOL 452/552 - GIS for Geoscientists I Lecture 21 - Chapter 8 (Raster Analysis, part2) Talk about class project (copy follow_along_data\ch8a_class_ex into U:\ArcGIS\ if needed) Catch up with lecture 20
Algorithms for GIS csci3225
 Algorithms for GIS csci3225 Laura Toma Bowdoin College LiDAR data in GIS LiDAR (Light Detection and Ranging) Each point records: its geographic location x,y its height z the number of returns in its pulse
Spatial Interpolation - Geostatistics 4/3/2018
 Spatial Interpolation - Geostatistics 4/3/201 (Z i Z j ) 2 / 2 Spatial Interpolation & Geostatistics Lag Distance between pairs of points Lag Mean Tobler s Law All places are related, but nearby places
CPSC 695. Methods for interpolation and analysis of continuing surfaces in GIS Dr. M. Gavrilova
 CPSC 695 Methods for interpolation and analysis of continuing surfaces in GIS Dr. M. Gavrilova Overview Data sampling for continuous surfaces Interpolation methods Global interpolation Local interpolation
Learn how to delineate a watershed using the hydrologic modeling wizard
 v. 10.1 WMS 10.1 Tutorial Learn how to delineate a watershed using the hydrologic modeling wizard Objectives Import a digital elevation model, compute flow directions, and delineate a watershed and sub-basins
2010 LiDAR Project. GIS User Group Meeting June 30, 2010
 2010 LiDAR Project GIS User Group Meeting June 30, 2010 LiDAR = Light Detection and Ranging Technology that utilizes lasers to determine the distance to an object or surface Measures the time delay between
Learn how to delineate a watershed using the hydrologic modeling wizard
 v. 11.0 WMS 11.0 Tutorial Learn how to delineate a watershed using the hydrologic modeling wizard Objectives Import a digital elevation model, compute flow directions, and delineate a watershed and sub-basins
Terrain Analysis. Using QGIS and SAGA
 Terrain Analysis Using QGIS and SAGA Tutorial ID: IGET_RS_010 This tutorial has been developed by BVIEER as part of the IGET web portal intended to provide easy access to geospatial education. This tutorial
Objectives Learn how GMS uses rasters to support all kinds of digital elevation models and how rasters can be used for interpolation in GMS.
 v. 9.1 GMS 9.1 Tutorial Using rasters for interpolation and visualization in GMS Objectives Learn how GMS uses rasters to support all kinds of digital elevation models and how rasters can be used for interpolation
A Method to Create a Single Photon LiDAR based Hydro-flattened DEM
 A Method to Create a Single Photon LiDAR based Hydro-flattened DEM Sagar Deshpande 1 and Alper Yilmaz 2 1 Surveying Engineering, Ferris State University 2 Department of Civil, Environmental, and Geodetic
Spatial Analysis and Modeling (GIST 4302/5302) Guofeng Cao Department of Geosciences Texas Tech University
 Guofeng Cao Department of Geosciences Texas Tech University") Spatial Analysis and Modeling (GIST 4302/5302) Guofeng Cao Department of Geosciences Texas Tech University 1 Outline of This Week Last topic, we learned: Spatial autocorrelation of areal data Spatial regression
Spatial Analysis and Modeling (GIST 4302/5302) Guofeng Cao Department of Geosciences Texas Tech University 1 Outline of This Week Last topic, we learned: Spatial autocorrelation of areal data Spatial regression
Generate Digital Elevation Models Using Laser Altimetry (LIDAR) Data. Christopher Weed
 Data. Christopher Weed") Generate Digital Elevation Models Using Laser Altimetry (LIDAR) Data Christopher Weed Final Report EE 381K Multidimensional Digital Signal Processing December 11, 2000 Abstract A Laser Altimetry (LIDAR)
Generate Digital Elevation Models Using Laser Altimetry (LIDAR) Data Christopher Weed Final Report EE 381K Multidimensional Digital Signal Processing December 11, 2000 Abstract A Laser Altimetry (LIDAR)
Digital Elevation Model & Surface Analysis
 Topics: Digital Elevation Model & Surface Analysis 1. Introduction 2. Create raster DEM 3. Examine Lidar DEM 4. Deriving secondary surface products 5. Mapping contours 6. Viewshed Analysis 7. Extract elevation
Stream network delineation and scaling issues with high resolution data
 Stream network delineation and scaling issues with high resolution data Roman DiBiase, Arizona State University, May 1, 2008 Abstract: In this tutorial, we will go through the process of extracting a stream
Generate Digital Elevation Models Using Laser Altimetry (LIDAR) Data
 Data") Generate Digital Elevation Models Using Laser Altimetry (LIDAR) Data Literature Survey Christopher Weed October 2000 Abstract Laser altimetry (LIDAR) data must be processed to generate a digital elevation
Generate Digital Elevation Models Using Laser Altimetry (LIDAR) Data Literature Survey Christopher Weed October 2000 Abstract Laser altimetry (LIDAR) data must be processed to generate a digital elevation
Raster model. Raster model. Resolution. Value and data types. Structure and storage. Cell. Values. Data
 Raster model. Resolution. Values and data types 3. Storage. Fitting rasters 5. Map algebra 6. Interpolation 7. Conversion vectorraster 8. Vector vs. raster Raster model Divides the space into a regular
Spatial Analysis (Vector) II
 II") Spatial Analysis (Vector) II GEOG 300, Lecture 9 Dr. Anthony Jjumba 1 A Spatial Network is a set of geographic locations interconnected in a system by a number of routes is a system of linear features
Spatial Analysis (Vector) II GEOG 300, Lecture 9 Dr. Anthony Jjumba 1 A Spatial Network is a set of geographic locations interconnected in a system by a number of routes is a system of linear features
Should Contours Be Generated from Lidar Data, and Are Breaklines Required? Lidar data provides the most
 Should Contours Be Generated from Lidar Data, and Are Breaklines Required? Lidar data provides the most accurate and reliable representation of the topography of the earth. As lidar technology advances
Raster GIS. Raster GIS 11/1/2015. The early years of GIS involved much debate on raster versus vector - advantages and disadvantages
 Raster GIS Google Earth image (raster) with roads overlain (vector) Raster GIS The early years of GIS involved much debate on raster versus vector - advantages and disadvantages 1 Feb 21, 2010 MODIS satellite
Surface Analysis. Data for Surface Analysis. What are Surfaces 4/22/2010
 Surface Analysis Cornell University Data for Surface Analysis Vector Triangulated Irregular Networks (TIN) a surface layer where space is partitioned into a set of non-overlapping triangles Attribute and
Lidar Working with LAS Datasets
 2013 Esri International User Conference July 8 12, 2013 San Diego, California Technical Workshop Lidar Working with LAS Datasets Raghav Vemula (3D Team) Esri UC2013. Technical Workshop. Agenda Las Dataset
Files Used in this Tutorial
 Generate Point Clouds and DSM Tutorial This tutorial shows how to generate point clouds and a digital surface model (DSM) from IKONOS satellite stereo imagery. You will view the resulting point clouds
Topographic Lidar Data Employed to Map, Preserve U.S. History
 OCTOBER 11, 2016 Topographic Lidar Data Employed to Map, Preserve U.S. History In August 2015, the National Park Service (NPS) contracted Woolpert for the Little Bighorn National Monument Mapping Project
Copyright The McGraw-Hill Companies, Inc. Permission required for reproduction or display.
 Chapter 13. TERRAIN MAPPING AND ANALYSIS 13.1 Data for Terrain Mapping and Analysis 13.1.1 DEM 13.1.2 TIN Box 13.1 Terrain Data Format 13.2 Terrain Mapping 13.2.1 Contouring 13.2.2 Vertical Profiling 13.2.3
Reality Check: Processing LiDAR Data. A story of data, more data and some more data
 Reality Check: Processing LiDAR Data A story of data, more data and some more data Red River of the North Red River of the North Red River of the North Red River of the North Introduction and Background
Raster model. Alexandre Gonçalves, DECivil, IST
 Raster model 1. Resolution 2. Values and data types 3. Storage 4. Fitting rasters 5. Map algebra 6. Interpolation 7. Conversion vector raster 8. Vector vs. raster 1 Raster model Divides the space into
Investigation of Sampling and Interpolation Techniques for DEMs Derived from Different Data Sources
 Investigation of Sampling and Interpolation Techniques for DEMs Derived from Different Data Sources FARRAG ALI FARRAG 1 and RAGAB KHALIL 2 1: Assistant professor at Civil Engineering Department, Faculty
Report: Comparison of Methods to Produce Digital Terrain Models
 Report: Comparison of Methods to Produce Digital Terrain Models Evan J Fedorko West Virginia GIS Technical Center 27 April 2005 Introduction This report compares Digital Terrain Models (DTM) created through
Literature review for 3D Design Terrain Models for Construction Plans and GPS Control of Highway Construction Equipment
 Literature review for 3D Design Terrain Models for Construction Plans and GPS Control of Highway Construction Equipment Cassie Hintz Construction and Materials Support Center Department of Civil and Environmental
Channel Conditions in the Onion Creek Watershed. Integrating High Resolution Elevation Data in Flood Forecasting
 Channel Conditions in the Onion Creek Watershed Integrating High Resolution Elevation Data in Flood Forecasting Lukas Godbout GIS in Water Resources CE394K Fall 2016 Introduction Motivation Flooding is
Import, view, edit, convert, and digitize triangulated irregular networks
 v. 10.1 WMS 10.1 Tutorial Import, view, edit, convert, and digitize triangulated irregular networks Objectives Import survey data in an XYZ format. Digitize elevation points using contour imagery. Edit
Applied Cartography and Introduction to GIS GEOG 2017 EL. Lecture-7 Chapters 13 and 14
 Applied Cartography and Introduction to GIS GEOG 2017 EL Lecture-7 Chapters 13 and 14 Data for Terrain Mapping and Analysis DEM (digital elevation model) and TIN (triangulated irregular network) are two
GeoEarthScope NoCAL San Andreas System LiDAR pre computed DEM tutorial
 GeoEarthScope NoCAL San Andreas System LiDAR pre computed DEM tutorial J Ramón Arrowsmith Chris Crosby School of Earth and Space Exploration Arizona State University ramon.arrowsmith@asu.edu http://lidar.asu.edu
EarthCube and Cyberinfrastructure for the Earth Sciences: Lessons and Perspective from OpenTopography
 EarthCube and Cyberinfrastructure for the Earth Sciences: Lessons and Perspective from OpenTopography Christopher Crosby, San Diego Supercomputer Center J Ramon Arrowsmith, Arizona State University Chaitan
Basic landscape analysis
 Chapter 4 Basic landscape analysis Tangible Landscape allows us to explore the spatial patterns of topographic parameters and their relation to basic surface geometry. To analyze the topography of a landscape
RECOMMENDATION ITU-R P DIGITAL TOPOGRAPHIC DATABASES FOR PROPAGATION STUDIES. (Question ITU-R 202/3)
") Rec. ITU-R P.1058-1 1 RECOMMENDATION ITU-R P.1058-1 DIGITAL TOPOGRAPHIC DATABASES FOR PROPAGATION STUDIES (Question ITU-R 202/3) Rec. ITU-R P.1058-1 (1994-1997) The ITU Radiocommunication Assembly, considering
Rec. ITU-R P.1058-1 1 RECOMMENDATION ITU-R P.1058-1 DIGITAL TOPOGRAPHIC DATABASES FOR PROPAGATION STUDIES (Question ITU-R 202/3) Rec. ITU-R P.1058-1 (1994-1997) The ITU Radiocommunication Assembly, considering
Airborne Laser Scanning: Remote Sensing with LiDAR
 Airborne Laser Scanning: Remote Sensing with LiDAR ALS / LIDAR OUTLINE Laser remote sensing background Basic components of an ALS/LIDAR system Two distinct families of ALS systems Waveform Discrete Return
Maps as Numbers: Data Models
 Maps as Numbers: Data Models vertices nodes tart node nd node arcs Reality Conceptual Models The Task An accurate, registered, digital map that can be queried and analyzed Translate: Real World Locations,
WMS 9.1 Tutorial Hydraulics and Floodplain Modeling Floodplain Delineation Learn how to us the WMS floodplain delineation tools
 v. 9.1 WMS 9.1 Tutorial Hydraulics and Floodplain Modeling Floodplain Delineation Learn how to us the WMS floodplain delineation tools Objectives Experiment with the various floodplain delineation options
Spatial Interpolation of Airborne Laser Scanning Data with Variable Data Density
 Spatial Interpolation of Airborne Laser Scanning Data with Variable Data Density Jaroslav Hofierka *, Michal Gallay*, Ján Kaňuk * * Institute of Geography, Faculty of Science, Pavol Jozef Safarik University,
Lab 11: Terrain Analyses
 Lab 11: Terrain Analyses What You ll Learn: Basic terrain analysis functions, including watershed, viewshed, and profile processing. There is a mix of old and new functions used in this lab. We ll explain
An Introduction to Using Lidar with ArcGIS and 3D Analyst
 FedGIS Conference February 24 25, 2016 Washington, DC An Introduction to Using Lidar with ArcGIS and 3D Analyst Jim Michel Outline Lidar Intro Lidar Management Las files Laz, zlas, conversion tools Las
Geostatistics 2D GMS 7.0 TUTORIALS. 1 Introduction. 1.1 Contents
 GMS 7.0 TUTORIALS 1 Introduction Two-dimensional geostatistics (interpolation) can be performed in GMS using the 2D Scatter Point module. The module is used to interpolate from sets of 2D scatter points
Supplementary material to LaDiCaoz and LiDARimager MATLAB GUIs for LiDAR data handling and lateral displacement measurement
 Supplementary material to LaDiCaoz and LiDARimager MATLAB GUIs for LiDAR data handling and lateral displacement measurement Olaf Zielke 1 *, J Ramon Arrowsmith 1 1 School of Earth and Space Exploration,