Point clouds and DEMs
|
|
|
- Charlotte Hamilton
- 5 years ago
- Views:
Transcription
1 Point clouds and DEMs J Ramón Arrowsmith School of Earth and Space Exploration Arizona State University Christopher J. Crosby UNAVCO Tutorial notes (April 2016)
2 Point clouds and DEMs 1. Download tahoe.las 2. Open in CloudCompare Increase point size, color by different scalar fields, select ground returns Tools-Projection-Rasterize 3. Lasview (right click to change functions) 4. Lasinfo (lasinfo -i "C:\Users\ramon\Desktop\Tahoepoints.las" -odir "C:\Users\ramon\Desktop" -o "tahoe.txt ) 5. Lasboundary (output file format kml) 6. Las2txt

3 Cloud Compare
4

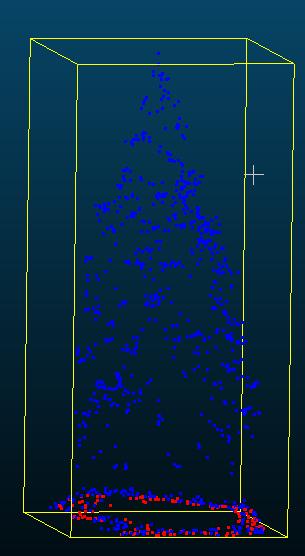
5 Use the scissor tool for segmentation
6

7
8

9

10
11 Point clouds and DEMs 7. las2las Datum and projection cise/topomaps/ref_datum.htm cise/topomaps/utm.htm cise/topomaps/state_plane.htm

12 Lake Tahoe

13 las2las -i "C:\Users\ramon\Desktop\T ahoepoints.las" -odir "C:\Users\ramon\Desktop" - o "tahoecaii.las" -sp83 CA_II GeoKeyDirectoryTag version number of keys 4 key 1024 tiff_tag_location 0 count 1 value_offset 1 - GTModelTypeGeoKey: ModelTypeProjected key 3072 tiff_tag_location 0 count 1 value_offset ProjectedCSTypeGeoKey: NAD83 / California zone 2 key 3076 tiff_tag_location 0 count 1 value_offset ProjLinearUnitsGeoKey: Linear_Meter key 4099 tiff_tag_location 0 count 1 value_offset VerticalUnitsGeoKey: Linear_Meter
14 Point clouds and DEMs 8. Lecture burst on generating DEMs from points 9. Lasgrid point density (view.tif in ArcMap) 10. Lasgrid DEM 11. blast2dem Discuss tiling workaround

15 Digital Elevation Models Digital representation of topography / terrain Raster format a grid of squares or pixels Continuous surface where Z (elevation) is estimated on a regular X,Y grid 2.5D Source: Grid resolution is defined by the size in the horizontal dimension of the pixel 1 meter DEM has pixels 1 m x 1m assigned a single elevation value.

16 1 meter grid LiDAR returns from EarthScope data collection Example from flat area with little or no vegetation so ground is sampled approx. 5+ times per square meter How do we best fit a continuous surface to these points? 1 meter 1 meter Ultimately wish to represent irregularly sampled data on a regularized grid.


17 Generating DEMs from LIDAR resampling LIDAR points j raster DEM triangulating i temporary TIN interpolating Isenburg, et al., 2006
18 Interpolation Methods Inverse Distance Weighting (IDW) Natural Neighbors Kriging Splines TIN linear quintic Isenburg, et al., 2006
 Isenburg, et al.")
19 DEM Generation via TIN Streaming read points from disk Streaming Computation of Delaunay Triangulation Immediate Rasterization Streaming of Streaming TIN output TIN output final DEM to disk small buffer in main memory store elevation rasters to temporary files (grouped by rows) Isenburg, et al., 2006

20 Example Result 500,141,313 Points 11 GB (binary, xyz, doubles) LIDAR points 50,394 30,500 DEM 3 GB (binary, BIL, 16 bit, 20 ft) raster DEM on a household laptop with two harddisks in 67 minutes 64 MB of main memory 270 MB temporary disk space Isenburg, et al., 2006
21 lasgrid -i "C:\Users\ramon\Desktop\Tahoepoints.las" - point_density -otif

22


23 Measure fault slip at the appropriate scale B4 LiDAR topography 0.25 m DEM Langridge, et al Sqrt(1m2/4)= 0.5 m/pix Mean ~4 shots/sq. m
24 LASGRID is neighborhood approach lasgrid -i "C:\Users\ramon\Desktop\Tahoepoints.las" -elevation -average -odir "C:\Users\ramon\Desktop" -o "tahoegrid1m.tif"
25

26
27 lasgrid -i "C:\Users\ramon\Desktop\Tahoepoints.las" -keep_classification 2 -elevation -average - odir "C:\Users\ramon\Desktop" -o "tahoegrid1mclass2v2.tif"

28

29
30 BLAST2DEM is TIN approach blast2dem -i "C:\Users\ramon\Desktop\Tahoepoints.las" -elevation -odir "C:\Users\ramon\Desktop" - o "tahoe1mblast.tif"

31

32
33 blast2dem -i "C:\Users\ramon\Desktop\Tahoepoints.las" -keep_classification 2 -elevation -odir "C:\Users\ramon\Desktop" -o "tahoe1mblastclass2.tif"

34

35
36 DEMs in ArcMap Basic visualization and colorization Point and profile measurements Raster Math (difference and conditional) Canopy 3D viewing in ArcScene


37 Note that is the beginning of other sorts of topographic differencing e.g., Morphological sediment budgeting

38 Con: Performs a conditional if/else evaluation on each of the input cells of an input raster. Really powerful!!!


39 ArcScene Properties tabs: Symbology change colormap Rendering Shade areal features High quality enhancement


40 ArcScene Properties tabs: Symbology change colormap Rendering Shade areal features High quality enhancement
GeoEarthScope NoCAL San Andreas System LiDAR pre computed DEM tutorial
 GeoEarthScope NoCAL San Andreas System LiDAR pre computed DEM tutorial J Ramón Arrowsmith Chris Crosby School of Earth and Space Exploration Arizona State University ramon.arrowsmith@asu.edu http://lidar.asu.edu
Crea%ng DEMs From LiDAR Point Cloud Data
 Crea%ng DEMs From LiDAR Point Cloud Data C. Crosby (ccrosby@sdsc.edu) San Diego Supercomputer Center / OpenTopography.org Ramon Arrowsmith SESE, ASU 2011 SCEC LiDAR Short Course Digital ElevaEon Models
Crea%ng DEMs From LiDAR Point Cloud Data
 Crea%ng DEMs From LiDAR Point Cloud Data C. Crosby (ccrosby@sdsc.edu) San Diego Supercomputer Center / OpenTopography.org Ramon Arrowsmith SESE, ASU 2009 SCEC LiDAR Short Course Digital ElevaEon Models
Median Ground Models for Drone LiDAR from Velodyne Puck Systems
 Median Ground Models for Drone LiDAR from Velodyne Puck Systems ABSTRACT Martin Isenburg chief scientist, rapidlasso GmbH Caspariagasse 16, 97286 Sommerhausen, Germany martin@rapidlasso.com Points clouds
GEOGRAPHIC INFORMATION SYSTEMS Lecture 25: 3D Analyst
 GEOGRAPHIC INFORMATION SYSTEMS Lecture 25: 3D Analyst 3D Analyst - 3D Analyst is an ArcGIS extension designed to work with TIN data (triangulated irregular network) - many of the tools in 3D Analyst also
GEON Points2Grid Utility Instructions By: Christopher Crosby OpenTopography Facility, San Diego Supercomputer Center
 GEON Points2Grid Utility Instructions By: Christopher Crosby (ccrosby@sdsc.edu) OpenTopography Facility, San Diego Supercomputer Center (Formerly: GEON / Active Tectonics Research Group School of Earth
GY461 GIS 1: Environmental Campus Topography Project with ArcGIS 9.x
 I. Introduction GY461 GIS 1: Environmental In this project you will use data from a topographic survey of the USA campus to generate 2 separate maps: 1. A color-coded 2-dimensional topographic contour
Introduction to 3D Analysis. Jinwu Ma Jie Chang Khalid Duri
 Introduction to 3D Analysis Jinwu Ma Jie Chang Khalid Duri Area & Volume 3D Analyst Features Detect Change Determine Cut/Fill Calculate Surface Area & Volume Data Management Data Creation Data Conversion
GEOGRAPHIC INFORMATION SYSTEMS Lecture 24: Spatial Analyst Continued
 GEOGRAPHIC INFORMATION SYSTEMS Lecture 24: Spatial Analyst Continued Spatial Analyst - Spatial Analyst is an ArcGIS extension designed to work with raster data - in lecture I went through a series of demonstrations
Lecture 22 - Chapter 8 (Raster Analysis, part 3)
") GEOL 452/552 - GIS for Geoscientists I Lecture 22 - Chapter 8 (Raster Analysis, part 3) Today: Zonal Analysis (statistics) for polygons, lines, points, interpolation (IDW), Effects Toolbar, analysis masks
GEOL 452/552 - GIS for Geoscientists I Lecture 22 - Chapter 8 (Raster Analysis, part 3) Today: Zonal Analysis (statistics) for polygons, lines, points, interpolation (IDW), Effects Toolbar, analysis masks
Surface Creation & Analysis with 3D Analyst
 Esri International User Conference July 23 27 San Diego Convention Center Surface Creation & Analysis with 3D Analyst Khalid Duri Surface Basics Defining the surface Representation of any continuous measurement
Tutorial 18: 3D and Spatial Analyst - Creating a TIN and Visual Analysis
 Tutorial 18: 3D and Spatial Analyst - Creating a TIN and Visual Analysis Module content 18.1. Creating a TIN 18.2. Spatial Analyst Viewsheds, Slopes, Hillshades and Density. 18.1 Creating a TIN Sometimes
Lecture 23 - LiDAR. GEOL 452/552 - GIS for Geoscientists I. Scanning Lidar. 30 m DEM. Lidar representations:
 GEOL 452/552 - GIS for Geoscientists I Lecture 23 - LiDAR LiDAR - some background (thanks to Chris Kahle, DNR) Converting Lidar point data to a raster Look at online lidar data for Iowa (1m hillshaded)
Using rasters for interpolation and visualization in GMS
 v. 10.3 GMS 10.3 Tutorial Using rasters for interpolation and visualization in GMS Objectives This tutorial teaches how GMS uses rasters to support all kinds of digital elevation models and how rasters
Surface Analysis with 3D Analyst
 2013 Esri International User Conference July 8 12, 2013 San Diego, California Technical Workshop Surface Analysis with 3D Analyst Khalid H. Duri Esri UC2013. Technical Workshop. Why use 3D GIS? Because
Enhanced Access to High-Resolution LiDAR Topography through Cyberinfrastructure-Based Data Distribution and Processing
 Enhanced Access to High-Resolution LiDAR Topography through Cyberinfrastructure-Based Data Distribution and Processing Christopher J. Crosby, J Ramón Arrowsmith Jeffrey Connor, Gilead Wurman Efrat Jaeger-Frank,
Lecture 4: Digital Elevation Models
 Lecture 4: Digital Elevation Models GEOG413/613 Dr. Anthony Jjumba 1 Digital Terrain Modeling Terms: DEM, DTM, DTEM, DSM, DHM not synonyms. The concepts they illustrate are different Digital Terrain Modeling
Digital Elevation Models
 Digital Elevation Models National Elevation Dataset 1 Data Sets US DEM series 7.5, 30, 1 o for conterminous US 7.5, 15 for Alaska US National Elevation Data (NED) GTOPO30 Global Land One-kilometer Base
Reality Check: Processing LiDAR Data. A story of data, more data and some more data
 Reality Check: Processing LiDAR Data A story of data, more data and some more data Red River of the North Red River of the North Red River of the North Red River of the North Introduction and Background
MODULE 1 BASIC LIDAR TECHNIQUES
 MODULE SCENARIO One of the first tasks a geographic information systems (GIS) department using lidar data should perform is to check the quality of the data delivered by the data provider. The department
Objectives Learn how GMS uses rasters to support all kinds of digital elevation models and how rasters can be used for interpolation in GMS.
 v. 9.1 GMS 9.1 Tutorial Using rasters for interpolation and visualization in GMS Objectives Learn how GMS uses rasters to support all kinds of digital elevation models and how rasters can be used for interpolation
Copyright The McGraw-Hill Companies, Inc. Permission required for reproduction or display.
 Chapter 13. TERRAIN MAPPING AND ANALYSIS 13.1 Data for Terrain Mapping and Analysis 13.1.1 DEM 13.1.2 TIN Box 13.1 Terrain Data Format 13.2 Terrain Mapping 13.2.1 Contouring 13.2.2 Vertical Profiling 13.2.3
Exercise 4: Extracting Information from DEMs in ArcMap
 Exercise 4: Extracting Information from DEMs in ArcMap Introduction This exercise covers sample activities for extracting information from DEMs in ArcMap. Topics include point and profile queries and surface
Applied Cartography and Introduction to GIS GEOG 2017 EL. Lecture-7 Chapters 13 and 14
 Applied Cartography and Introduction to GIS GEOG 2017 EL Lecture-7 Chapters 13 and 14 Data for Terrain Mapping and Analysis DEM (digital elevation model) and TIN (triangulated irregular network) are two
Creating Surfaces. Steve Kopp Steve Lynch
 Steve Kopp Steve Lynch Overview Learn the types of surfaces and the data structures used to store them Emphasis on surface interpolation Learn the interpolation workflow Understand how interpolators work
Notes on Lidar interpolation
 Notes on Lidar interpolation J Ramón Arrowsmith with contributions from Chris Crosby and Jeff Conner Department of Geological Sciences Arizona State University Tempe, AZ, 85287 ramon.arrowsmith@asu.edu
Tools, Tips, and Workflows Exporting Final Product LP360
 LP360 Support Revision 1.0 l Final products can be exported from LIDAR data using either LP360 command line executables or the LP360 Export Wizard. Some export functions and resulting products include,
[Youn *, 5(11): November 2018] ISSN DOI /zenodo Impact Factor
![[Youn *, 5(11): November 2018] ISSN DOI /zenodo Impact Factor](/thumbs/91/105079225.jpg "[Youn *, 5(11): November 2018] ISSN DOI /zenodo Impact Factor") GLOBAL JOURNAL OF ENGINEERING SCIENCE AND RESEARCHES AUTOMATIC EXTRACTING DEM FROM DSM WITH CONSECUTIVE MORPHOLOGICAL FILTERING Junhee Youn *1 & Tae-Hoon Kim 2 *1,2 Korea Institute of Civil Engineering
GLOBAL JOURNAL OF ENGINEERING SCIENCE AND RESEARCHES AUTOMATIC EXTRACTING DEM FROM DSM WITH CONSECUTIVE MORPHOLOGICAL FILTERING Junhee Youn *1 & Tae-Hoon Kim 2 *1,2 Korea Institute of Civil Engineering
Geol 588. GIS for Geoscientists II. Zonal functions. Feb 22, Zonal statistics. Interpolation. Zonal statistics Sp. Analyst Tools - Zonal.
 Zonal functions Geol 588 GIS for Geoscientists II Feb 22, 2011 Zonal statistics Interpolation Zonal statistics Sp. Analyst Tools - Zonal Choose correct attribute for zones (usually: must be unique ID for
A geoinformatics-based approach to the distribution and processing of integrated LiDAR and imagery data to enhance 3D earth systems research
 A geoinformatics-based approach to the distribution and processing of integrated LiDAR and imagery data to enhance 3D earth systems research Christopher J. Crosby, J Ramón Arrowsmith, Jeffrey Connor, Gilead
Creating raster DEMs and DSMs from large lidar point collections. Summary. Coming up with a plan. Using the Point To Raster geoprocessing tool
 Page 1 of 5 Creating raster DEMs and DSMs from large lidar point collections ArcGIS 10 Summary Raster, or gridded, elevation models are one of the most common GIS data types. They can be used in many ways
Import, view, edit, convert, and digitize triangulated irregular networks
 v. 10.1 WMS 10.1 Tutorial Import, view, edit, convert, and digitize triangulated irregular networks Objectives Import survey data in an XYZ format. Digitize elevation points using contour imagery. Edit
Lecture 9. Raster Data Analysis. Tomislav Sapic GIS Technologist Faculty of Natural Resources Management Lakehead University
 Lecture 9 Raster Data Analysis Tomislav Sapic GIS Technologist Faculty of Natural Resources Management Lakehead University Raster Data Model The GIS raster data model represents datasets in which square
Lab 12: Sampling and Interpolation
 Lab 12: Sampling and Interpolation What You ll Learn: -Systematic and random sampling -Majority filtering -Stratified sampling -A few basic interpolation methods Data for the exercise are in the L12 subdirectory.
COPYRIGHTED MATERIAL. Introduction to 3D Data: Modeling with ArcGIS 3D Analyst and Google Earth CHAPTER 1
 CHAPTER 1 Introduction to 3D Data: Modeling with ArcGIS 3D Analyst and Google Earth Introduction to 3D Data is a self - study tutorial workbook that teaches you how to create data and maps with ESRI s
Statistical surfaces and interpolation. This is lecture ten
 Statistical surfaces and interpolation This is lecture ten Data models for representation of surfaces So far have considered field and object data models (represented by raster and vector data structures).
Lab 12: Sampling and Interpolation
 Lab 12: Sampling and Interpolation What You ll Learn: -Systematic and random sampling -Majority filtering -Stratified sampling -A few basic interpolation methods Videos that show how to copy/paste data
Lecture 20 - Chapter 8 (Raster Analysis, part1)
") GEOL 452/552 - GIS for Geoscientists I Lecture 20 - Chapter 8 (Raster Analysis, part) 4 lectures on rasters - but won t cover everything (Raster GIS course: Geol 588: GIS II (Spring 20) Today: Raster data,
GEOL 452/552 - GIS for Geoscientists I Lecture 20 - Chapter 8 (Raster Analysis, part) 4 lectures on rasters - but won t cover everything (Raster GIS course: Geol 588: GIS II (Spring 20) Today: Raster data,
Windstorm Simulation & Modeling Project
 Windstorm Simulation & Modeling Project Airborne LIDAR Data and Digital Elevation Models in Broward County, Florida Data Quality Report and Description of Deliverable Datasets Prepared for: The Broward
v SMS Tutorials Working with Rasters Prerequisites Requirements Time Objectives
 v. 12.2 SMS 12.2 Tutorial Objectives Learn how to import a Raster, view elevations at individual points, change display options for multiple views of the data, show the 2D profile plots, and interpolate
v Working with Rasters SMS 12.1 Tutorial Requirements Raster Module Map Module Mesh Module Time minutes Prerequisites Overview Tutorial
 v. 12.1 SMS 12.1 Tutorial Objectives This tutorial teaches how to import a Raster, view elevations at individual points, change display options for multiple views of the data, show the 2D profile plots,
Edwin Nissen (Colorado School of Mines)
") Aligning point clouds and topographic change detection Edwin Nissen (Colorado School of Mines) Oskin et al. (2012), Science Thanks to: Ramon Arrowsmith, Srikanth Saripalli, Aravindhan Krishnan (ASU), Adrian
Aligning point clouds and topographic change detection Edwin Nissen (Colorado School of Mines) Oskin et al. (2012), Science Thanks to: Ramon Arrowsmith, Srikanth Saripalli, Aravindhan Krishnan (ASU), Adrian
LAB #7 Creating TIN and 3D scenes (ArcScene) GISC, UNIVERSITY OF CALIFORNIA BERKELEY
 GISC, UNIVERSITY OF CALIFORNIA BERKELEY") LAB #7 Creating TIN and 3D scenes (ArcScene) GISC, UNIVERSITY OF CALIFORNIA BERKELEY The purpose of this laboratory is to introduce and explore surface data analysis using a vector data model: TIN. We
LAB #7 Creating TIN and 3D scenes (ArcScene) GISC, UNIVERSITY OF CALIFORNIA BERKELEY The purpose of this laboratory is to introduce and explore surface data analysis using a vector data model: TIN. We
Lidar and GIS: Applications and Examples. Dan Hedges Clayton Crawford
 Lidar and GIS: Applications and Examples Dan Hedges Clayton Crawford Outline Data structures, tools, and workflows Assessing lidar point coverage and sample density Creating raster DEMs and DSMs Data area
Learn how to delineate a watershed using the hydrologic modeling wizard
 v. 10.1 WMS 10.1 Tutorial Learn how to delineate a watershed using the hydrologic modeling wizard Objectives Import a digital elevation model, compute flow directions, and delineate a watershed and sub-basins
Unit 3.5: Geodetic Data for Hillslope Diffusion in MATLAB Student Exercise
 Unit 3.5: Geodetic Data for Hillslope Diffusion in MATLAB Student Exercise Assignment design by Ramon Arrowsmith (Arizona State University) Modified by Katherine Shervais (UNAVCO), Nathan Niemi (University
Contents of Lecture. Surface (Terrain) Data Models. Terrain Surface Representation. Sampling in Surface Model DEM
 Data Models. Terrain Surface Representation. Sampling in Surface Model DEM") Lecture 13: Advanced Data Models: Terrain mapping and Analysis Contents of Lecture Surface Data Models DEM GRID Model TIN Model Visibility Analysis Geography 373 Spring, 2006 Changjoo Kim 11/29/2006 1
Lecture 13: Advanced Data Models: Terrain mapping and Analysis Contents of Lecture Surface Data Models DEM GRID Model TIN Model Visibility Analysis Geography 373 Spring, 2006 Changjoo Kim 11/29/2006 1
Documentation for the analysis of the ground-based Alvord Basin LiDAR dataset
 Documentation for the analysis of the ground-based Alvord Basin LiDAR dataset Introduction David E. Haddad david.e.haddad@asu.edu July 2008 This report presents the procedures carried out, the results
L7 Raster Algorithms
 L7 Raster Algorithms NGEN6(TEK23) Algorithms in Geographical Information Systems by: Abdulghani Hasan, updated Nov 216 by Per-Ola Olsson Background Store and analyze the geographic information: Raster
Esri International User Conference. San Diego, California. Technical Workshops. July Creating Surfaces. Steve Kopp and Steve Lynch
 Esri International User Conference San Diego, California Technical Workshops July 2011 Creating Surfaces Steve Kopp and Steve Lynch Overview Learn the types of surfaces and the data structures used to
RASTER ANALYSIS GIS Analysis Fall 2013
 RASTER ANALYSIS GIS Analysis Fall 2013 Raster Data The Basics Raster Data Format Matrix of cells (pixels) organized into rows and columns (grid); each cell contains a value representing information. What
What can we represent as a Surface?
 Geography 38/42:376 GIS II Topic 7: Surface Representation and Analysis (Chang: Chapters 13 & 15) DeMers: Chapter 10 What can we represent as a Surface? Surfaces can be used to represent: Continuously
Steps for Modeling a Proposed New Reservoir in GIS
 Steps for Modeling a Proposed New Reservoir in GIS Requirements: ArcGIS ArcMap, ArcScene, Spatial Analyst, and 3D Analyst There s a new reservoir proposed for Right Hand Fork in Logan Canyon. I wanted
DEM Artifacts: Layering or pancake effects
 Outcomes DEM Artifacts: Stream networks & watersheds derived using ArcGIS s HYDROLOGY routines are only as good as the DEMs used. - Both DEM examples below have problems - Lidar and SRTM DEM products are
Algorithms for GIS csci3225
 Algorithms for GIS csci3225 Laura Toma Bowdoin College LiDAR data in GIS LiDAR (Light Detection and Ranging) Each point records: its geographic location x,y its height z the number of returns in its pulse
The 3D Analyst extension extends ArcGIS to support surface modeling and 3- dimensional visualization. 3D Shape Files
 NRM 435 Spring 2016 ArcGIS 3D Analyst Page#1 of 9 0B3D Analyst Extension The 3D Analyst extension extends ArcGIS to support surface modeling and 3- dimensional visualization. 3D Shape Files Analogous to
Esri International User Conference. July San Diego Convention Center. Lidar Solutions. Clayton Crawford
 Esri International User Conference July 23 27 San Diego Convention Center Lidar Solutions Clayton Crawford Outline Data structures, tools, and workflows Assessing lidar point coverage and sample density
IDL Lab: Interpolation and Displaying of Lidar Data
 IDL Lab: Interpolation and Displaying of Lidar Data The purpose of this lab is to introduce you to some IDL functions for interpolation and visualization. Lidar is becoming an important tool for getting
Lecture 21 - Chapter 8 (Raster Analysis, part2)
") GEOL 452/552 - GIS for Geoscientists I Lecture 21 - Chapter 8 (Raster Analysis, part2) Today: Digital Elevation Models (DEMs), Topographic functions (surface analysis): slope, aspect hillshade, viewshed,
GEOL 452/552 - GIS for Geoscientists I Lecture 21 - Chapter 8 (Raster Analysis, part2) Today: Digital Elevation Models (DEMs), Topographic functions (surface analysis): slope, aspect hillshade, viewshed,
Alaska Department of Transportation Roads to Resources Project LiDAR & Imagery Quality Assurance Report Juneau Access South Corridor
 Alaska Department of Transportation Roads to Resources Project LiDAR & Imagery Quality Assurance Report Juneau Access South Corridor Written by Rick Guritz Alaska Satellite Facility Nov. 24, 2015 Contents
Digital Elevation Model & Surface Analysis
 Topics: Digital Elevation Model & Surface Analysis 1. Introduction 2. Create raster DEM 3. Examine Lidar DEM 4. Deriving secondary surface products 5. Mapping contours 6. Viewshed Analysis 7. Extract elevation
EMIGMA V9.x Premium Series April 8, 2015
 EMIGMA V9.x Premium Series April 8, 2015 EMIGMA for Gravity EMIGMA for Gravity license is a comprehensive package that offers a wide array of processing, visualization and interpretation tools. The package
University of West Hungary, Faculty of Geoinformatics. Béla Márkus. Spatial Analysis 5. module SAN5. 3D analysis
 University of West Hungary, Faculty of Geoinformatics Béla Márkus Spatial Analysis 5. module SAN5 3D analysis SZÉKESFEHÉRVÁR 2010 The right to this intellectual property is protected by the 1999/LXXVI
Lab 7: Bedrock rivers and the relief structure of mountain ranges
 Lab 7: Bedrock rivers and the relief structure of mountain ranges Objectives In this lab, you will analyze the relief structure of the San Gabriel Mountains in southern California and how it relates to
Exercise 6a: Using free and/or open source tools to build workflows to manipulate. LAStools
 Exercise 6a: Using free and/or open source tools to build workflows to manipulate and process LiDAR data: LAStools Christopher Crosby Last Revised: December 1st, 2009 Exercises in this series: 1. LAStools
LiDAR Data Processing:
 LiDAR Data Processing: Concepts and Methods for LEFI Production Gordon W. Frazer GWF LiDAR Analytics Outline of Presentation Data pre-processing Data quality checking and options for repair Data post-processing
Lab 10: Raster Analyses
 Lab 10: Raster Analyses What You ll Learn: Spatial analysis and modeling with raster data. You will estimate the access costs for all points on a landscape, based on slope and distance to roads. You ll
Lidar Technical Report
 Lidar Technical Report Oregon Department of Forestry Sites Presented to: Oregon Department of Forestry 2600 State Street, Building E Salem, OR 97310 Submitted by: 3410 West 11st Ave. Eugene, OR 97402 April
National Science Foundation Engineering Research Center. Bingcai Zhang BAE Systems San Diego, CA
 Bingcai Zhang BAE Systems San Diego, CA 92127 Bingcai.zhang@BAESystems.com Introduction It is a trivial task for a five-year-old child to recognize and name an object such as a car, house or building.
I CALCULATIONS WITHIN AN ATTRIBUTE TABLE
 Geology & Geophysics REU GPS/GIS 1-day workshop handout #4: Working with data in ArcGIS You will create a raster DEM by interpolating contour data, create a shaded relief image, and pull data out of the
Watershed Sciences 4930 & 6920 GEOGRAPHIC INFORMATION SYSTEMS
 HOUSEKEEPING Watershed Sciences 4930 & 6920 GEOGRAPHIC INFORMATION SYSTEMS CONTOURS! Self-Paced Lab Due Friday! WEEK SIX Lecture RASTER ANALYSES Joe Wheaton YOUR EXCERCISE Integer Elevations Rounded up
Generate Digital Elevation Models Using Laser Altimetry (LIDAR) Data
 Data") Generate Digital Elevation Models Using Laser Altimetry (LIDAR) Data Literature Survey Christopher Weed October 2000 Abstract Laser altimetry (LIDAR) data must be processed to generate a digital elevation
Generate Digital Elevation Models Using Laser Altimetry (LIDAR) Data Literature Survey Christopher Weed October 2000 Abstract Laser altimetry (LIDAR) data must be processed to generate a digital elevation
Learn how to delineate a watershed using the hydrologic modeling wizard
 v. 11.0 WMS 11.0 Tutorial Learn how to delineate a watershed using the hydrologic modeling wizard Objectives Import a digital elevation model, compute flow directions, and delineate a watershed and sub-basins
Maps as Numbers: Data Models
 Maps as Numbers: Data Models vertices E Reality S E S arcs S E Conceptual Models nodes E Logical Models S Start node E End node S Physical Models 1 The Task An accurate, registered, digital map that can
GEON LiDAR Workflow (GLW) Users Guide
 Users Guide") GEON LiDAR Workflow (GLW) Users Guide Joshua Coyan Christopher Crosby Ramón Arrowsmith School of Earth and Space Exploration Arizona State University 24 October 2007 http://lidar.asu.edu Table of Contents
GEON LiDAR Workflow (GLW) Users Guide Joshua Coyan Christopher Crosby Ramón Arrowsmith School of Earth and Space Exploration Arizona State University 24 October 2007 http://lidar.asu.edu Table of Contents
WMS 9.1 Tutorial Watershed Modeling DEM Delineation Learn how to delineate a watershed using the hydrologic modeling wizard
 v. 9.1 WMS 9.1 Tutorial Learn how to delineate a watershed using the hydrologic modeling wizard Objectives Read a digital elevation model, compute flow directions, and delineate a watershed and sub-basins
3D Analyst Visualization with ArcGlobe. Brady Hoak, ESRI DC
 3D Analyst Visualization with ArcGlobe Brady Hoak, ESRI DC 3D GIS Viewing geospatial data in 3D leads to new insights 2D 3D Sometimes you need to edit your data in 3D 2D 3D Some problems can only be solved
DIGITAL TERRAIN MODELLING. Endre Katona University of Szeged Department of Informatics
 DIGITAL TERRAIN MODELLING Endre Katona University of Szeged Department of Informatics katona@inf.u-szeged.hu The problem: data sources data structures algorithms DTM = Digital Terrain Model Terrain function:
RASTER ANALYSIS GIS Analysis Winter 2016
 RASTER ANALYSIS GIS Analysis Winter 2016 Raster Data The Basics Raster Data Format Matrix of cells (pixels) organized into rows and columns (grid); each cell contains a value representing information.
Purpose: To explore the raster grid and vector map element concepts in GIS.
 GIS INTRODUCTION TO RASTER GRIDS AND VECTOR MAP ELEMENTS c:wou:nssi:vecrasex.wpd Purpose: To explore the raster grid and vector map element concepts in GIS. PART A. RASTER GRID NETWORKS Task A- Examine
Combine Yield Data From Combine to Contour Map Ag Leader
 Combine Yield Data From Combine to Contour Map Ag Leader Exporting the Yield Data Using SMS Program 1. Data format On Hard Drive. 2. Start program SMS Basic. a. In the File menu choose Open. b. Click on
Algorithms for GIS: Terrain simplification
 Algorithms for GIS: Terrain simplification Digital terrain models in GIS grid (raster) TIN Data Sources: digitizing contour maps Data Sources: satellite imagery Data Sources: satellite imagery \ Data Sources:
Stream network delineation and scaling issues with high resolution data
 Stream network delineation and scaling issues with high resolution data Roman DiBiase, Arizona State University, May 1, 2008 Abstract: In this tutorial, we will go through the process of extracting a stream
Creating Contours using ArcMap
 Creating Contours with ArcMap and ArcScene Digital elevation models (DEMs) are geospatial datasets that contain elevation values sampled according to a regularly spaced rectangular grid. They can be used
Geostatistics Predictions with Deterministic Procedures
 Instituto Superior de Estatística e Gestão de Informação Universidade Nova de Lisboa Master of Science in Geospatial Technologies Geostatistics Predictions with Deterministic Procedures Carlos Alberto
Generate Digital Elevation Models Using Laser Altimetry (LIDAR) Data. Christopher Weed
 Data. Christopher Weed") Generate Digital Elevation Models Using Laser Altimetry (LIDAR) Data Christopher Weed Final Report EE 381K Multidimensional Digital Signal Processing December 11, 2000 Abstract A Laser Altimetry (LIDAR)
Generate Digital Elevation Models Using Laser Altimetry (LIDAR) Data Christopher Weed Final Report EE 381K Multidimensional Digital Signal Processing December 11, 2000 Abstract A Laser Altimetry (LIDAR)
National Center for Airborne Laser Mapping. Airborne LIDAR Data Processing and Analysis Tools ALDPAT 1.0
 National Center for Airborne Laser Mapping Airborne LIDAR Data Processing and Analysis Tools ALDPAT 1.0 Keqi Zhang 1,2 & Zheng Cui 1 1 International Hurricane Research Center 2 Department of Environmental
Big Spatial Data Performance With Oracle Database 12c. Daniel Geringer Spatial Solutions Architect
 Big Spatial Data Performance With Oracle Database 12c Daniel Geringer Spatial Solutions Architect Oracle Exadata Database Machine Engineered System 2 What Is the Oracle Exadata Database Machine? Oracle
Municipal Projects in Cambridge Using a LiDAR Dataset. NEURISA Day 2012 Sturbridge, MA
 Municipal Projects in Cambridge Using a LiDAR Dataset NEURISA Day 2012 Sturbridge, MA October 15, 2012 Jeff Amero, GIS Manager, City of Cambridge Presentation Overview Background on the LiDAR dataset Solar
Review of Cartographic Data Types and Data Models
 Review of Cartographic Data Types and Data Models GIS Data Models Raster Versus Vector in GIS Analysis Fundamental element used to represent spatial features: Raster: pixel or grid cell. Vector: x,y coordinate
Tools, Tips, and Workflows Breaklines, Part 4 Applying Breaklines to Enforce Constant Elevation
 Breaklines, Part 4 Applying Breaklines to l Lewis Graham Revision 1.0 In the last edition of LP360 News, we discussed the creation of 3D breaklines. Recall that, for our purposes, a 3D breakline is a vector
Chapters 1 7: Overview
 Chapters 1 7: Overview Photogrammetric mapping: introduction, applications, and tools GNSS/INS-assisted photogrammetric and LiDAR mapping LiDAR mapping: principles, applications, mathematical model, and
Introduction to GIS 2011
 Introduction to GIS 2011 Digital Elevation Models CREATING A TIN SURFACE FROM CONTOUR LINES 1. Start ArcCatalog from either Desktop or Start Menu. 2. In ArcCatalog, create a new folder dem under your c:\introgis_2011
Georeferencing in ArcGIS
 Georeferencing in ArcGIS Georeferencing In order to position images on the surface of the earth, they need to be georeferenced. Images are georeferenced by linking unreferenced features in the image with
GIS IN ECOLOGY: VISUALIZING IN 3D
 GIS IN ECOLOGY: VISUALIZING IN 3D Contents Introduction... 2 3D Analyst and ArcScene... 2 3D Data... 2 Course Data Sources... 3 Instructions for Copying the Course Dataset... 4 Tasks... 4 Visualizing and
An Introduction to Lidar & Forestry May 2013
 An Introduction to Lidar & Forestry May 2013 Introduction to Lidar & Forestry Lidar technology Derivatives from point clouds Applied to forestry Publish & Share Futures Lidar Light Detection And Ranging
Lecture 06. Raster and Vector Data Models. Part (1) Common Data Models. Raster. Vector. Points. Points. ( x,y ) Area. Area Line.
 Common Data Models. Raster. Vector. Points. Points. ( x,y ) Area. Area Line.") Lecture 06 Raster and Vector Data Models Part (1) 1 Common Data Models Vector Raster Y Points Points ( x,y ) Line Area Line Area 2 X 1 3 Raster uses a grid cell structure Vector is more like a drawn map
Lecture 06 Raster and Vector Data Models Part (1) 1 Common Data Models Vector Raster Y Points Points ( x,y ) Line Area Line Area 2 X 1 3 Raster uses a grid cell structure Vector is more like a drawn map
What s New in Imagery in ArcGIS. Presented by: Christopher Patterson Date: September 12, 2017
 What s New in Imagery in ArcGIS Presented by: Christopher Patterson Date: September 12, 2017 Agenda Ortho Mapping Elevation extraction Drone2Map Raster Analytics ArcGIS is a Comprehensive Imagery System
Masking Lidar Cliff-Edge Artifacts
 Masking Lidar Cliff-Edge Artifacts Methods 6/12/2014 Authors: Abigail Schaaf is a Remote Sensing Specialist at RedCastle Resources, Inc., working on site at the Remote Sensing Applications Center in Salt
Tutorial 1: Downloading elevation data
 Tutorial 1: Downloading elevation data Objectives In this exercise you will learn how to acquire elevation data from the website OpenTopography.org, project the dataset into a UTM coordinate system, and