Lidar Talking Points Status of lidar collection in Pennsylvania Estimated cost and timeline
|
|
|
- Olivia McKinney
- 5 years ago
- Views:
Transcription
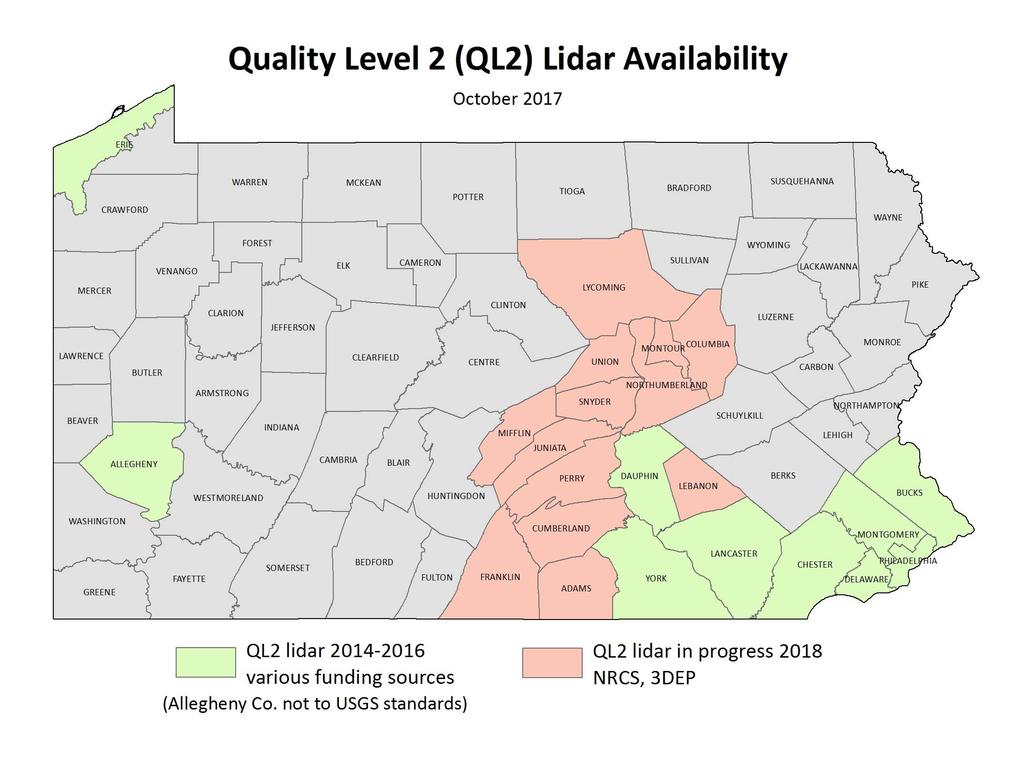
1 Lidar Talking Points Pennsylvania has an immediate need for new lidar (topographic) data coverage. Some uses of the data are enumerated later in this document. USGS has calculated an average return on investment for lidar at 5:1. If we can act in the 2018 budget year, we have the opportunity to apply to the USGS 3DEP program to cover 30-40% of the project cost. Status of lidar collection in Pennsylvania The first complete lidar coverage of the state of Pennsylvania was made over a three-year period from 2006 to 2008, by the PAMAP program. The program was funded primarily by DCNR, with contributions from other state agencies (OA, PennDOT, PEMA, DEP), USGS, and FEMA. The data has a vertical accuracy of 18.5 cm; 2-foot elevation contours and 1-meter digital elevation models (DEMs) were produced. This product cost about $15M, and has since informed billions of dollars of site engineering, planning, environmental management, and investment. These existing 10-year-old lidar products are the most-downloaded data on the state geospatial data clearinghouse despite the fact that, in many locations, the data does not reflect current on-the-ground conditions. In the intervening 10 years, technology has improved so that current standards (QL2) are vertical accuracy of 10 cm, yielding 1-foot contours and 1-meter DEMs. Eight counties in southeastern Pennsylvania have been collected at QL2 under the USGS 3DEP initiative. Allegheny County paid for its own collection in NRCS and USGS 3DEP are currently in the process of contracting for QL2 lidar for 13 counties in the Chesapeake Bay watershed in central Pennsylvania (see attached map). An ad hoc group of state, federal, and local government agencies and non-governmental organizations (NGOs) have come together as the Lidar Working Group to work toward a complete QL2 lidar coverage of the state, and to plan for data management and maintenance into the future. Agencies currently represented include: PEMA, DCNR, PennDOT, DEP, PA Game Commission, USGS, NRCS, National Forest Service, PASDA, Shippensburg University, PA Magic, PA MAPPS, Susquehanna River Basin Commission. Estimated cost and timeline A current estimate for the cost of obtaining QL2 lidar for the remaining 45 counties is about $7.6 million (33,337 sq. mi. x $226/sq. mi.). On average, the 3DEP initiative covers about 36% of the cost of successful proposals, bringing the cost to the state and other partners closer to $4.8 million. The work would likely be completed as a two-year or perhaps three-year project, thus reducing the cost per year to partner agencies. The aim would be to line up partners within and outside state government, and submit a proposal to 3DEP in September Ideally, the partners would look at refreshing the elevation data on a 3-7 year cycle. Some determining factors are technological advances leading to improved data accuracy at comparable or reduced cost, coordination with PEMA orthophotography cycle, and rapidity of change on the ground. 1

2 Uses of lidar data Lidar data is processed to produce a variety of data layers, including height of tree canopy, building locations and heights, bare earth DEMs, and elevation contours. Some examples of applications of the data follow: Flood or inundation modeling o Use case: Cambria County s GIS Director used the 2006 PAMAP lidar data to enhance building information for the county s updated Hazard Mitigation Plan (HMP). First, he enhanced building footprints using the 2006 data. Then he used elevation data to figure rooftop heights and ground elevation for each building. Using a little math, he derived number of stories per feature, and first floor height above ground. This input is required for the GIS analysis to model estimated flood level within a building and calculate property loss values for each building. The project relied heavily on the accurate elevation values provided by the lidar data. Counties are required to update HMPs every five years, demonstrating the need for regular updating of lidar data. FEMA 100-year floodplain (depth grid) near Johnstown, PA displayed with 3D building heights and data, all derived from lidar and used to update the Cambria County Hazard Mitigation Plan. Building colors show the dollar loss estimate, with higher values in orange and red. (Cambria County GIS Center) Land cover Elevation data can be used to categorize the land surface into forest, water, agriculture, impervious surface, etc. o Use case: DCNR partnered with the Chesapeake Conservancy to analyze riparian forest buffers (35-foot buffer along streams) in the Susquehanna Watershed. The PAMAP lidar was used along with imagery to generate a 1-meter landcover dataset along with an improved hydrography layer. This analysis was not possible without lidar as previous data was insufficiently precise to resolve a 35-foot buffer. Forest canopy heights Total height of the forest canopy is used by forest managers to identify poor, average, and superior sites for growing trees. This data is also used to map 2

 Hydrography and flow-path mapping; storm water infrastructure needs (MS4).")

3 areas of State Forest understocked with trees, and to map forest stands (groups of similar trees) Base maps Lidar and its derivatives (DEM, slope, hillshade, contours) provide a standardized base map for cartographic products and geologic maps, as well as for accurate mapping of vector layers such as road, trails, and streams. Lidar-derived hillshade showing bare-earth surface. Blue lines are streams. Red lines are trails. (PA DCNR, Bureau of Forestry) Hydrography and flow-path mapping; storm water infrastructure needs (MS4). o Use case: Our present water base map is about 40 years old and largely schematic. When overlaid on modern imagery and topography, streams plot outside of their valleys and do not map to their full extent. Research in Lancaster County illustrated the difference in extent of current base mapping and that which can be derived from modern lidar. Comparison of the current state standard hydrography (left) and the same area enhanced with lidar and flow accumulation study; Upper Chiques Creek, Lancaster County. 3

4 Archaeological and historical preservation needs Delineation of geologic hazards, such as landslides and sinkholes Wetland determination Infrastructure management Energy and mineral resources Change mapping Comparison of previous lidar datasets to new lidar datasets allows analysis of changes in landcover, land use, and hydrography. New Marcellus well pads incorporated into PAMAP lidar DEM to compare hydrography before and after well pads existed. (PA DCNR, Bureau of Forestry) 4
5
3D Elevation Program GeoCue Webinar April 29, The National Map
 + 3D Elevation Program GeoCue Webinar April 29, 2014 The National Map + 3D Elevation Program (3DEP) 2 Topics What is the 3DEP? Overview and background: National Elevation Dataset National Enhanced Elevation
An Introduction to Lidar & Forestry May 2013
 An Introduction to Lidar & Forestry May 2013 Introduction to Lidar & Forestry Lidar technology Derivatives from point clouds Applied to forestry Publish & Share Futures Lidar Light Detection And Ranging
Existing Elevation Data Sets. Quality Level 2 (QL2) Lidar Data Sets. Better Land Characterization More Accurate Results!
 Lidar Data Sets. Better Land Characterization More Accurate Results!") Existing Elevation Data Sets Out of Date: Most > 40 yrs old Data range from 15 yrs old to > 70 yrs old Spatial Resolution: 33 ft (10 m) or coarser Vertical Accuracy: 3.3 ft 6.6 ft (1 2 m) or worse Quality
Existing Elevation Data Sets Out of Date: Most > 40 yrs old Data range from 15 yrs old to > 70 yrs old Spatial Resolution: 33 ft (10 m) or coarser Vertical Accuracy: 3.3 ft 6.6 ft (1 2 m) or worse Quality
Hamilton County Enhances GIS Base Mapping with 1-foot Contours
 Hamilton County Enhances GIS Base Mapping with 1-foot Contours Presented by Larry Stout, Hamilton County GIS Manager Brad Fugate, Woolpert Inc. Today s Presentation Hamilton County s 2004 Base Mapping
Overview. 1. Aerial LiDAR in Wisconsin (20 minutes) 2. Demonstration of data in CAD (30 minutes) 3. High Density LiDAR (20 minutes)
 2. Demonstration of data in CAD (30 minutes) 3. High Density LiDAR (20 minutes)") Overview 1. Aerial LiDAR in Wisconsin (20 minutes) 2. Demonstration of data in CAD (30 minutes) 3. High Density LiDAR (20 minutes) 4. Aerial lidar technology advancements (15 minutes) 5. Q & A 1. Aerial
Overview 1. Aerial LiDAR in Wisconsin (20 minutes) 2. Demonstration of data in CAD (30 minutes) 3. High Density LiDAR (20 minutes) 4. Aerial lidar technology advancements (15 minutes) 5. Q & A 1. Aerial
BRIEF EXAMPLES OF PRACTICAL USES OF LIDAR
 BRIEF EXAMPLES OF PRACTICAL USES OF LIDAR PURDUE ROAD SCHOOL - 3/9/2016 CHRIS MORSE USDA-NRCS, STATE GIS COORDINATOR LIDAR/DEM SOURCE DATES LiDAR and its derivatives (DEMs) have a collection date for data
N.J.P.L.S. An Introduction to LiDAR Concepts and Applications
 N.J.P.L.S. An Introduction to LiDAR Concepts and Applications Presentation Outline LIDAR Data Capture Advantages of Lidar Technology Basics Intensity and Multiple Returns Lidar Accuracy Airborne Laser
3D Elevation Program- Status and Updates. Claire DeVaughan South Central Arc User Group Conference April 11, 2018
 + 1 3D Elevation Program- Status and Updates Claire DeVaughan South Central Arc User Group Conference April 11, 2018 + 2 3D Elevation Program (3DEP) Goals Complete acquisition in 8 years Address Federal,
IGIC Helping Coordinate GIS Initiatives for Indiana
 IGIC Helping Coordinate GIS Initiatives for Indiana GIS Day at Purdue University 2014 Phil Worrall, Executive Director Indiana Geographic Information Council, Inc. (IGIC) IGIC Helping Coordinate GIS Initiatives
Reality Check: Processing LiDAR Data. A story of data, more data and some more data
 Reality Check: Processing LiDAR Data A story of data, more data and some more data Red River of the North Red River of the North Red River of the North Red River of the North Introduction and Background
LIDAR MAPPING FACT SHEET
 1. LIDAR THEORY What is lidar? Lidar is an acronym for light detection and ranging. In the mapping industry, this term is used to describe an airborne laser profiling system that produces location and
Data Acquisition Through the Geospatial Products and Services Contract (GPSC)
") Data Acquisition Through the Geospatial Products and Services Contract (GPSC) Kathryn Yoder GPSC COTR ESRI, 2015 U.S. Department of the Interior U.S. Geological Survey Overview Background Info Acquisition
Data Acquisition Through the Geospatial Products and Services Contract (GPSC) Kathryn Yoder GPSC COTR ESRI, 2015 U.S. Department of the Interior U.S. Geological Survey Overview Background Info Acquisition
Should Contours Be Generated from Lidar Data, and Are Breaklines Required? Lidar data provides the most
 Should Contours Be Generated from Lidar Data, and Are Breaklines Required? Lidar data provides the most accurate and reliable representation of the topography of the earth. As lidar technology advances
2D Large Scale Automated Engineering for FEMA Floodplain Development in South Dakota. Eli Gruber, PE Brooke Conner, PE
 2D Large Scale Automated Engineering for FEMA Floodplain Development in South Dakota Eli Gruber, PE Brooke Conner, PE Project Acknowledgments FEMA Region 8 Staff: Brooke Conner, PE Casey Zuzak, GISP Ryan
Topographic Lidar Data Employed to Map, Preserve U.S. History
 OCTOBER 11, 2016 Topographic Lidar Data Employed to Map, Preserve U.S. History In August 2015, the National Park Service (NPS) contracted Woolpert for the Little Bighorn National Monument Mapping Project
MICA High Water Mark Mapping Project What WE Learned Mission Assignment 4222DR-OK-COE-SWD-01/02
 MICA High Water Mark Mapping Project What WE Learned Mission Assignment 4222DR-OK-COE-SWD-01/02 Disaster DR-4222 Oklahoma Severe Storms, Tornadoes, Straight-line Winds, and Flooding Major Disaster Declaration
Workshops funded by the Minnesota Environment and Natural Resources Trust Fund
 Workshops funded by the Minnesota Environment and Natural Resources Trust Fund Conservation Applications of LiDAR Data Workshops funded by: Minnesota Environment and Natural Resources Trust Fund Presented
2D Model Implementation for Complex Floodplain Studies. Sam Crampton, P.E., CFM Dewberry
 2D Model Implementation for Complex Floodplain Studies Sam Crampton, P.E., CFM Dewberry 2D Case Studies Case Study 1 Rain-on-Grid 2D floodplain simulation for unconfined flat topography in coastal plain
2010 LiDAR Project. GIS User Group Meeting June 30, 2010
 2010 LiDAR Project GIS User Group Meeting June 30, 2010 LiDAR = Light Detection and Ranging Technology that utilizes lasers to determine the distance to an object or surface Measures the time delay between
GIS Tools for Hydrology and Hydraulics
 1 OUTLINE GIS Tools for Hydrology and Hydraulics INTRODUCTION Good afternoon! Welcome and thanks for coming. I once heard GIS described as a high-end Swiss Army knife: lots of tools in one little package
Lidar and GIS: Applications and Examples. Dan Hedges Clayton Crawford
 Lidar and GIS: Applications and Examples Dan Hedges Clayton Crawford Outline Data structures, tools, and workflows Assessing lidar point coverage and sample density Creating raster DEMs and DSMs Data area
Channel Conditions in the Onion Creek Watershed. Integrating High Resolution Elevation Data in Flood Forecasting
 Channel Conditions in the Onion Creek Watershed Integrating High Resolution Elevation Data in Flood Forecasting Lukas Godbout GIS in Water Resources CE394K Fall 2016 Introduction Motivation Flooding is
Automated Enforcement of High Resolution Terrain Models April 21, Brian K. Gelder, PhD Associate Scientist Iowa State University
 Automated Enforcement of High Resolution Terrain Models April 21, 2015 Brian K. Gelder, PhD Associate Scientist Iowa State University Problem Statement High resolution digital elevation models (DEMs) should
Contents of Lecture. Surface (Terrain) Data Models. Terrain Surface Representation. Sampling in Surface Model DEM
 Data Models. Terrain Surface Representation. Sampling in Surface Model DEM") Lecture 13: Advanced Data Models: Terrain mapping and Analysis Contents of Lecture Surface Data Models DEM GRID Model TIN Model Visibility Analysis Geography 373 Spring, 2006 Changjoo Kim 11/29/2006 1
Lecture 13: Advanced Data Models: Terrain mapping and Analysis Contents of Lecture Surface Data Models DEM GRID Model TIN Model Visibility Analysis Geography 373 Spring, 2006 Changjoo Kim 11/29/2006 1
Ada L. Benavides, Deputy Chief South Pacific Division Regional Integration Team. May 5, US Army Corps of Engineers BUILDING STRONG
 Building Strong Collaborative Relationships for a Sustainable Water Resources Future The Federal Support Toolbox for Integrated Water Resources Management Ada L. Benavides, Deputy Chief South Pacific Division
Esri International User Conference. July San Diego Convention Center. Lidar Solutions. Clayton Crawford
 Esri International User Conference July 23 27 San Diego Convention Center Lidar Solutions Clayton Crawford Outline Data structures, tools, and workflows Assessing lidar point coverage and sample density
UAV Surveying II. Precision. Accuracy. Reliability
 UAV Surveying II Precision. Accuracy. Reliability Part One: Project Lifecycle Deliverables Part Two: Evaluation of UAV Data Accuracy and Examples of Error Part Three: AGENDA Review of Results Examples
LiDAR data overview. Dr. Keiko Saito Global Facility for Disaster Reduction and Recovery (GFDRR)
") LiDAR data overview Dr. Keiko Saito Global Facility for Disaster Reduction and Recovery (GFDRR) LiDAR (Light Detecting And Ranging) 3D height profile Laser emitted from sensor onboard aircraft to measure
LiDAR data overview Dr. Keiko Saito Global Facility for Disaster Reduction and Recovery (GFDRR) LiDAR (Light Detecting And Ranging) 3D height profile Laser emitted from sensor onboard aircraft to measure
Municipal Projects in Cambridge Using a LiDAR Dataset. NEURISA Day 2012 Sturbridge, MA
 Municipal Projects in Cambridge Using a LiDAR Dataset NEURISA Day 2012 Sturbridge, MA October 15, 2012 Jeff Amero, GIS Manager, City of Cambridge Presentation Overview Background on the LiDAR dataset Solar
WMS 9.1 Tutorial GSSHA WMS Basics Watershed Delineation using DEMs and 2D Grid Generation Delineate a watershed and create a GSSHA model from a DEM
 v. 9.1 WMS 9.1 Tutorial GSSHA WMS Basics Watershed Delineation using DEMs and 2D Grid Generation Delineate a watershed and create a GSSHA model from a DEM Objectives Learn how to delineate a watershed
Synthetic Aperture Radar (SAR) Polarimetry for Wetland Mapping & Change Detection
 Polarimetry for Wetland Mapping & Change Detection") Synthetic Aperture Radar (SAR) Polarimetry for Wetland Mapping & Change Detection Jennifer M. Corcoran, M.S. Remote Sensing & Geospatial Analysis Laboratory Natural Resource Science & Management PhD Program
Synthetic Aperture Radar (SAR) Polarimetry for Wetland Mapping & Change Detection Jennifer M. Corcoran, M.S. Remote Sensing & Geospatial Analysis Laboratory Natural Resource Science & Management PhD Program
WMS 10.1 Tutorial GSSHA WMS Basics Watershed Delineation using DEMs and 2D Grid Generation Delineate a watershed and create a GSSHA model from a DEM
 v. 10.1 WMS 10.1 Tutorial GSSHA WMS Basics Watershed Delineation using DEMs and 2D Grid Generation Delineate a watershed and create a GSSHA model from a DEM Objectives Learn how to delineate a watershed
WMS 9.1 Tutorial Hydraulics and Floodplain Modeling Floodplain Delineation Learn how to us the WMS floodplain delineation tools
 v. 9.1 WMS 9.1 Tutorial Hydraulics and Floodplain Modeling Floodplain Delineation Learn how to us the WMS floodplain delineation tools Objectives Experiment with the various floodplain delineation options
Improved Applications with SAMB Derived 3 meter DTMs
 Improved Applications with SAMB Derived 3 meter DTMs Evan J Fedorko West Virginia GIS Technical Center 20 April 2005 This report sums up the processes used to create several products from the Lorado 7
Elevation Data Acquisition Update
 N G C E, F o r t W o r t h Elevation Data Acquisition Update November 27, 2017 Collin McCormick National Elevation Leader Data Acquisition Updates FY17/18 Contracts & Acquisitions Data Processing State
Automated Feature Extraction from Aerial Imagery for Forestry Projects
 Automated Feature Extraction from Aerial Imagery for Forestry Projects Esri UC 2015 UC706 Tuesday July 21 Bart Matthews - Photogrammetrist US Forest Service Southwestern Region Brad Weigle Sr. Program
Alaska Department of Transportation Roads to Resources Project LiDAR & Imagery Quality Assurance Report Juneau Access South Corridor
 Alaska Department of Transportation Roads to Resources Project LiDAR & Imagery Quality Assurance Report Juneau Access South Corridor Written by Rick Guritz Alaska Satellite Facility Nov. 24, 2015 Contents
Applications of LiDAR in seismic acquisition and processing Mark Wagaman and Ron Sfara, Veritas DGC
 Applications of LiDAR in seismic acquisition and processing Mark Wagaman and Ron Sfara, Veritas DGC Abstract With its ability to provide accurate land surface elevations, the LiDAR (Light Detection And
Multi-LCC Mississippi River Basin Gulf Hypoxia Initiative. ScienceBase and Data Basin User Guide
 Multi-LCC Mississippi River Basin Gulf Hypoxia Initiative ScienceBase and Data Basin User Guide Data delivery for the Gulf Hypoxia Initiative is carried out through the use of two websites: ScienceBase
FOR 474: Forest Inventory. Plot Level Metrics: Getting at Canopy Heights. Plot Level Metrics: What is the Point Cloud Anyway?
 FOR 474: Forest Inventory Plot Level Metrics from Lidar Heights Other Plot Measures Sources of Error Readings: See Website Plot Level Metrics: Getting at Canopy Heights Heights are an Implicit Output of
MODULE 1 BASIC LIDAR TECHNIQUES
 MODULE SCENARIO One of the first tasks a geographic information systems (GIS) department using lidar data should perform is to check the quality of the data delivered by the data provider. The department
Fusing LiDAR and Imagery: Providing Effective Solutions for Ohio s s Transportation Infrastructure
 Fusing LiDAR and Imagery: Providing Effective Solutions for Ohio s s Transportation Infrastructure Dave Blackstone GIS Manager Ohio Department of Transportation Brian Stevens, CP Project Manager Woolpert
Data Acquisition; Maintenance, and Dissemination
 Data Acquisition; Maintenance, and Dissemination Amar Nayegandhi, CP, CMS(RS), GISP Director of Remote Sensing Dewberry December 4, 2014 About MAPPS + MAPPS is the only national association of private
PROJECT BRIEFINGS: Statewide 2008 Orthoimagery LiDAR Elevation Data Program MN Geospatial Information Office. Chris Cialek
 PROJECT BRIEFINGS: Statewide 2008 Orthoimagery LiDAR Elevation Data Program MN Geospatial Information Office Chris Cialek MN Land Management Information Center (LMIC) chris.cialek@state.mn.us Mid-West
Using LiDAR (Light Distancing And Ranging) data to more accurately describe avalanche terrain
 data to more accurately describe avalanche terrain") International Snow Science Workshop, Davos 009, Proceedings Using LiDAR (Light Distancing And Ranging) data to more accurately describe avalanche terrain Christopher M. McCollister, and Robert H. Comey,
International Snow Science Workshop, Davos 009, Proceedings Using LiDAR (Light Distancing And Ranging) data to more accurately describe avalanche terrain Christopher M. McCollister, and Robert H. Comey,
v Prerequisite Tutorials GSSHA Modeling Basics Stream Flow GSSHA WMS Basics Creating Feature Objects and Mapping their Attributes to the 2D Grid
 v. 10.1 WMS 10.1 Tutorial GSSHA Modeling Basics Developing a GSSHA Model Using the Hydrologic Modeling Wizard in WMS Learn how to setup a basic GSSHA model using the hydrologic modeling wizard Objectives
FOR 274: Surfaces from Lidar. Lidar DEMs: Understanding the Returns. Lidar DEMs: Understanding the Returns
 FOR 274: Surfaces from Lidar LiDAR for DEMs The Main Principal Common Methods Limitations Readings: See Website Lidar DEMs: Understanding the Returns The laser pulse travel can travel through trees before
GIS-Generated Street Tree Inventory Pilot Study
 GIS-Generated Street Tree Inventory Pilot Study Prepared for: MSGIC Meeting Prepared by: Beth Schrayshuen, PE Marla Johnson, GISP 21 July 2017 Agenda 2 Purpose of Street Tree Inventory Pilot Study Evaluation
UAV Flight Operations for Mapping. Precision. Accuracy. Reliability
 UAV Flight Operations for Mapping Precision. Accuracy. Reliability Part One: Why is Mapping different? Part Two: What about accuracy and precision? Part Three: What is the Workflow? Part Four: AGENDA What
Upper Trinity River Corridor Development Certificate Model Updates. Flood Management Task Force Meeting April 20, 2018
 Upper Trinity River Corridor Development Certificate Model Updates Flood Management Task Force Meeting April 20, 2018 Agenda Review of the Phase II Upper Trinity Watershed CDC Model Development Hydrology
Creating raster DEMs and DSMs from large lidar point collections. Summary. Coming up with a plan. Using the Point To Raster geoprocessing tool
 Page 1 of 5 Creating raster DEMs and DSMs from large lidar point collections ArcGIS 10 Summary Raster, or gridded, elevation models are one of the most common GIS data types. They can be used in many ways
APPENDIX E2. Vernal Pool Watershed Mapping
 APPENDIX E2 Vernal Pool Watershed Mapping MEMORANDUM To: U.S. Fish and Wildlife Service From: Tyler Friesen, Dudek Subject: SSHCP Vernal Pool Watershed Analysis Using LIDAR Data Date: February 6, 2014
Information Technology Community Involvement
 Information Technology Community Involvement Tom Hoover Associate Vice Chancellor Helping students achieve through technology Information Technology at the University of Tennessee Chattanooga is focused
Edward G. Beadenkopf, PE, CFM RAMPP-URS Corporation
 FEMA and Multi-Federal Agency Cooperation to Support Dam Safety and to Develop Tools for States and Local Communities to Create More Resilient Communities Edward G. Beadenkopf, PE, CFM RAMPP-URS Corporation
FOR Save the Poudre: Poudre Waterkeeper BY PetersonGIS. Inputs, Methods, Results. June 15, 2012
 W e t l a n d s A n a l y s i s FOR Save the Poudre: Poudre Waterkeeper BY PetersonGIS Inputs, Methods, Results June 15, 2012 PROJECT GOALS The project goals were 1) create variable width buffers along
Watershed Analysis and A Look Ahead
 Watershed Analysis and A Look Ahead 1 2 Specific Storm Flow to Grate What data do you need? Watershed boundaries for each storm sewer Net flow generated from each point across the landscape Elevation Fill
I. An Intro to ArcMap Version 9.3 and 10. 1) Arc Map is basically a build your own Google map
 Arc Map is basically a build your own Google map") I. An Intro to ArcMap Version 9.3 and 10 What is Arc Map? 1) Arc Map is basically a build your own Google map a. Display and manage geo-spatial data (maps, images, points that have a geographic location)
I. An Intro to ArcMap Version 9.3 and 10 What is Arc Map? 1) Arc Map is basically a build your own Google map a. Display and manage geo-spatial data (maps, images, points that have a geographic location)
Airborne and Mobile LiDAR for Transport Corridor Survey Dr. Bharat Lohani Director, Geokno India Pvt. Ltd. & Professor, Geoinformatics IIT Kanpur
 www.geokno.com Airborne and Mobile LiDAR for Transport Corridor Survey Dr. Bharat Lohani Director, Geokno India Pvt. Ltd. & Professor, Geoinformatics IIT Kanpur Geokno has executed and is executing multiple
UTILIZACIÓN DE DATOS LIDAR Y SU INTEGRACIÓN CON SISTEMAS DE INFORMACIÓN GEOGRÁFICA
 UTILIZACIÓN DE DATOS LIDAR Y SU INTEGRACIÓN CON SISTEMAS DE INFORMACIÓN GEOGRÁFICA Aurelio Castro Cesar Piovanetti Geographic Mapping Technologies Corp. (GMT) Consultores en GIS info@gmtgis.com Geographic
Exercise 5. Height above Nearest Drainage Flood Inundation Analysis
 Exercise 5. Height above Nearest Drainage Flood Inundation Analysis GIS in Water Resources, Fall 2018 Prepared by David G Tarboton Purpose The purpose of this exercise is to learn how to calculation the
Using GeoNet 2.0 for feature identification in an urban environment Anna Kladzyk
 Using GeoNet 2.0 for feature identification in an urban environment by Anna Kladzyk CE397 Flood Forecasting Term Project The University of Texas at Austin May 2015 TABLE OF CONTENTS Introduction... 3 Data...
LiDAR Applications. Examples of LiDAR applications. forestry hydrology geology urban applications
 LiDAR Applications Examples of LiDAR applications forestry hydrology geology urban applications 1 Forestry applications canopy heights individual tree and crown mapping estimated DBH and leaf area index
Rapid Floodplain Delineation. Presented by: Leo R. Kreymborg 1, P.E. David T. Williams 2, Ph.D., P.E. Iwan H. Thomas 3, E.I.T.
 007 ASCE Rapid Floodplain Delineation Presented by: Leo R. Kreymborg 1, P.E. David T. Williams, Ph.D., P.E. Iwan H. Thomas 3, E.I.T. 1 Project Manager, PBS&J, 975 Sky Park Court, Suite 00, San Diego, CA
WMS 9.0 Tutorial GSSHA WMS Basics Watershed Delineation using DEMs and 2D Grid Generation Delineate a watershed and create a GSSHA model from a DEM
 v. 9.0 WMS 9.0 Tutorial GSSHA WMS Basics Watershed Delineation using DEMs and 2D Grid Generation Delineate a watershed and create a GSSHA model from a DEM Objectives Learn how to delineate a watershed
2014 AWRA Annual Water Resources Conference November 5, 2014 Tysons Corner, VA
 2014 AWRA Annual Water Resources Conference November 5, 2014 Tysons Corner, VA HEC-RAS Overview, History, & Future How HEC-RAS Works Model Development Standard FEMA Assumptions Building A Model FEMA Levels
AIRBORNE GEIGER MODE LIDAR - LATEST ADVANCEMENTS IN REMOTE SENSING APPLICATIONS RANDY RHOADS
 Place image here (10 x 3.5 ) AIRBORNE GEIGER MODE LIDAR - LATEST ADVANCEMENTS IN REMOTE SENSING APPLICATIONS RANDY RHOADS Geospatial Industry Manager HARRIS.COM #HARRISCORP Harris Company Information SECURITY
WMS 10.1 Tutorial Hydraulics and Floodplain Modeling Simplified Dam Break Learn how to run a dam break simulation and delineate its floodplain
 v. 10.1 WMS 10.1 Tutorial Hydraulics and Floodplain Modeling Simplified Dam Break Learn how to run a dam break simulation and delineate its floodplain Objectives Setup a conceptual model of stream centerlines
Watershed Modeling With DEMs: The Rest of the Story
 Watershed Modeling With DEMs: The Rest of the Story Lesson 7 7-1 DEM Delineation: The Rest of the Story DEM Fill for some cases when merging DEMs Delineate Basins Wizard Smoothing boundaries Representing
PUBLIC WORKS. 1oo. DiEital Fee Schedules. Effective January 1, 2008
 PUBLIC WORKS Geographic Information Systems DiEital Fee Schedules Effective January 1, 2008 Date Advertised 12103/07 In (Publication) Daily Business Journal Public Hearing Date Approved as to form: David
Objectives This tutorial shows how to use the Map Flood tool to quickly generate floodplain data.
 v. 11.0 WMS 11.0 Tutorial Creating a Objectives This tutorial shows how to use the Map Flood tool to quickly generate floodplain data. Prerequisite Tutorials Introduction to WMS Required Components Scatter
Feature Extraction from Imagery & Lidar. Kurt Schwoppe, Esri Mark Romero, Esri Gregory Bacon, Fairfax County
 Feature Extraction from & Lidar Kurt Schwoppe, Esri Mark Romero, Esri Gregory Bacon, Fairfax County Today s Speakers Image Processing Experts and Good Colleagues Kurt Schwoppe Industry Lead Esri Mark Romero
IMAGINE Objective. The Future of Feature Extraction, Update & Change Mapping
 IMAGINE ive The Future of Feature Extraction, Update & Change Mapping IMAGINE ive provides object based multi-scale image classification and feature extraction capabilities to reliably build and maintain
A Method to Create a Single Photon LiDAR based Hydro-flattened DEM
 A Method to Create a Single Photon LiDAR based Hydro-flattened DEM Sagar Deshpande 1 and Alper Yilmaz 2 1 Surveying Engineering, Ferris State University 2 Department of Civil, Environmental, and Geodetic
Flood Control Structures Sometimes Neither Fish Nor Fowl
 Proud Titanium Sponsor of the ASFPM 2016 Annual Conference Flood Control Structures Sometimes Neither Fish Nor Fowl David Rubenstein, CFM Jim Murphy, PE, CFM Agenda Approach Study Area Flood Control System
WMS 10.0 Tutorial Hydraulics and Floodplain Modeling HY-8 Modeling Wizard Learn how to model a culvert using HY-8 and WMS
 v. 10.0 WMS 10.0 Tutorial Hydraulics and Floodplain Modeling HY-8 Modeling Wizard Learn how to model a culvert using HY-8 and WMS Objectives Define a conceptual schematic of the roadway, invert, and downstream
Terrain Modeling with ArcView GIS from ArcUser magazine
 Lesson 6: DEM-Based Terrain Modeling Lesson Goal: Lean how to output a grid theme that can be used to generate a thematic two-dimensional map, compute an attractive hillshaded map, and create a contour
Field-Scale Watershed Analysis
 Conservation Applications of LiDAR Field-Scale Watershed Analysis A Supplemental Exercise for the Hydrologic Applications Module Andy Jenks, University of Minnesota Department of Forest Resources 2013
Applying Mitigation. to Build Resilient Communities
 Applying Mitigation to Build Resilient Communities The Hazards Around Us Think about the natural hazard that... poses the greatest risk to where you live or work OR has had the greatest impact on you personally
Tutorial 1: Downloading elevation data
 Tutorial 1: Downloading elevation data Objectives In this exercise you will learn how to acquire elevation data from the website OpenTopography.org, project the dataset into a UTM coordinate system, and
BASE FLOOD ELEVATION DETERMINATION MODULE
 BASE FLOOD ELEVATION DETERMINATION MODULE FEDERAL EMERGENCY MANAGEMENT AGENCY PREPARED BY: NOLTE ASSOCIATES, INC. June, 2003 ABSTRACT The FEMA Base Flood Elevation Determination Module is a Visual Basic
UNDERSTAND HOW TO SET UP AND RUN A HYDRAULIC MODEL IN HEC-RAS CREATE A FLOOD INUNDATION MAP IN ARCGIS.
 CE 412/512, Spring 2017 HW9: Introduction to HEC-RAS and Floodplain Mapping Due: end of class, print and hand in. HEC-RAS is a Hydrologic Modeling System that is designed to describe the physical properties
North Atlantic Coast Comprehensive Study: New Jersey Back Bays Focus Area Analysis
 North Atlantic Coast Comprehensive Study: New Jersey Back Bays Focus Area Analysis J. Bailey Smith, Regional Technical Specialist National Planning Center for Coastal Storm Risk Management U.S. Army Corps
Disaster Mitigation Projects in Polis. December 14, 2016
 1 Disaster Mitigation Projects in Polis December 14, 2016 Briefing Agenda 2 About Polis Multi s Mitigation Planning Flood s s Disaster Mitigation Platforms Consultancies Training Discussion 3 About us
2D Hydraulic Modeling, Steering Stream Restoration Design
 2D Hydraulic Modeling, Steering Stream Restoration Design PREPARED FOR: EcoStream 2018 Stream Ecology & Restoration Conference Presented By: Matthew D. Gramza, P.E., CFM, CPESC Civil & Environmental Consultants,
Exercise 4: Extracting Information from DEMs in ArcMap
 Exercise 4: Extracting Information from DEMs in ArcMap Introduction This exercise covers sample activities for extracting information from DEMs in ArcMap. Topics include point and profile queries and surface
Environmental Impact Questionnaire
 Community Development Department 11 English Street Petaluma, CA 94952 Phone: 707-778-4301 Email: cdd@ci.petaluma.ca.us Web: www.cityofpetaluma.net/cdd Building Geographic Information Systems Housing Neighborhood
FEMA s Romance with LiDAR
 Example comparison between LiDAR-derived stream cross section and field surveyed cross section. Many such NCFMP examples demonstrated that the number of surveyed cross sections could be significantly reduced
v Modeling Orange County Unit Hydrograph GIS Learn how to define a unit hydrograph model for Orange County (California) from GIS data
 from GIS data") v. 10.1 WMS 10.1 Tutorial Modeling Orange County Unit Hydrograph GIS Learn how to define a unit hydrograph model for Orange County (California) from GIS data Objectives This tutorial shows how to define
v. 10.1 WMS 10.1 Tutorial Modeling Orange County Unit Hydrograph GIS Learn how to define a unit hydrograph model for Orange County (California) from GIS data Objectives This tutorial shows how to define
LiDAR Derived Contours
 LiDAR Derived Contours Final Delivery June 10, 2009 Prepared for: Prepared by: Metro 600 NE Grand Avenue Portland, OR 97232 Watershed Sciences, Inc. 529 SW Third Avenue, Suite 300 Portland, OR 97204 Metro
Welcome to NR402 GIS Applications in Natural Resources. This course consists of 9 lessons, including Power point presentations, demonstrations,
 Welcome to NR402 GIS Applications in Natural Resources. This course consists of 9 lessons, including Power point presentations, demonstrations, readings, and hands on GIS lab exercises. Following the last
Alberta's LiDAR Experience Lessons Learned Cosmin Tansanu
 Alberta's LiDAR Experience Lessons Learned Cosmin Tansanu Analysis Forester Alberta Environment and Sustainable Resource Development We are mandated to provide environmental leadership. We need to push
Airborne Laser Scanning: Remote Sensing with LiDAR
 Airborne Laser Scanning: Remote Sensing with LiDAR ALS / LIDAR OUTLINE Laser remote sensing background Basic components of an ALS/LIDAR system Two distinct families of ALS systems Waveform Discrete Return
The CaMa-Flood model description
 Japan Agency for Marine-Earth cience and Technology The CaMa-Flood model description Dai Yamazaki JAMTEC Japan Agency for Marine-Earth cience and Technology 4 th ep, 2015 Concepts of the CaMa-Flood development
U.S. Geological Survey (USGS) - National Geospatial Program (NGP) and the American Society for Photogrammetry and Remote Sensing (ASPRS)
 - National Geospatial Program (NGP) and the American Society for Photogrammetry and Remote Sensing (ASPRS)") U.S. Geological Survey (USGS) - National Geospatial Program (NGP) and the American Society for Photogrammetry and Remote Sensing (ASPRS) Summary of Research and Development Efforts Necessary for Assuring
U.S. Geological Survey (USGS) - National Geospatial Program (NGP) and the American Society for Photogrammetry and Remote Sensing (ASPRS) Summary of Research and Development Efforts Necessary for Assuring
The effect of LiDAR digital elevation model resolution on stream network prediction and computational requirements
 The effect of LiDAR digital elevation model resolution on stream network prediction and computational requirements Current Stream Layer Inaccuracy LiDAR Hillshade I Inaccuracy DNR Hydro Layer Problem Increased
RiparianZone = buffer( River, 100 Feet )
") GIS Analysts perform spatial analysis when they need to derive new data from existing data. In GIS I, for example, you used the vector approach to derive a riparian buffer feature (output polygon) around
GIS Analysts perform spatial analysis when they need to derive new data from existing data. In GIS I, for example, you used the vector approach to derive a riparian buffer feature (output polygon) around
Sandy River, OR Bathymetric Lidar Project, 2012 Delivery QC Analysis Lidar QC Report March 26 th, 2013
 O R E G O N D E P A R T M E N T O F G E O L O G Y A N D M I N E R A L I N D U S T R I E S OLC Sandy River, OR Bathymetric Lidar Project Delivery Acceptance Report. Department of Geology & Mineral Industries
ROCKY FORK TRACT: VIEWSHED ANALYSIS REPORT
 ROCKY FORK TRACT: VIEWSHED ANALYSIS REPORT Prepared for: The Conservation Fund Prepared by: A Carroll GIS 3711 Skylark Trail Chattanoga, TN 37416 INTRODUCTION This report documents methods and results
TAKING FLIGHT JULY/AUGUST 2015 COMMERCIAL UAS ADVANCEMENT BALLOONS THE POOR MAN S UAV? SINGLE PHOTON SENSOR REVIEW VOLUME 5 ISSUE 5
 VOLUME 5 ISSUE 5 JULY/AUGUST 2015 TAKING FLIGHT 14 COMMERCIAL UAS ADVANCEMENT 24 BALLOONS THE POOR MAN S UAV? 30 SINGLE PHOTON SENSOR REVIEW Closing in on 500 authorizations the FAA has expedited the exemption
National Science Foundation Engineering Research Center. Bingcai Zhang BAE Systems San Diego, CA
 Bingcai Zhang BAE Systems San Diego, CA 92127 Bingcai.zhang@BAESystems.com Introduction It is a trivial task for a five-year-old child to recognize and name an object such as a car, house or building.