An Introduction to Visualization of Diffusion Tensor Imaging and its Applications
|
|
|
- Tobias Hensley
- 6 years ago
- Views:
Transcription
1 An Introduction to Visualization of Diffusion Tensor Imaging and its Applications A. Vilanova 1, S. Zhang 2, G. Kindlmann 3, and D. Laidlaw 2 1 Department of Biomedical Engineering Eindhoven University of Technology, Eindhoven a.vilanova@tue.nl 2 Department of Computer Science Brown University, Providence {dhl,sz}@cs.brown.edu 3 School of Computing University of Utah, Salt Lake City gk@cs.utah.edu Summary. Water diffusion is anisotropic in organized tissues such as white matter and muscle. Diffusion tensor imaging (DTI), a non-invasive MR technique, measures water self-diffusion rates and thus gives an indication of the underlying microstructure of tissue. The diffusion rate is often expressed by a second-order tensor. Visualizing DTI in an insightful way is challenging because of the high dimensionality of the diffusion tensor and the complex spatial relationships in a diffusion tensor field. This chapter surveys the different visualization techniques that have been developed for DTI and compares their main characteristics and drawbacks. We also discuss some of the many biomedical applications in which DTI helps extend our understanding or improve clinical procedures. We conclude with an overview of open problems and research directions. 1 Introduction Diffusion tensor imaging (DTI) is a medical imaging modality that can reveal directional information in vivo in fibrous structures such as white matter or muscles. Although barely a decade old, DTI has become an important tool in studying white matter anatomy and pathology. Many hospitals, universities, and research centers have MRI scanners and diffusion imaging capability, allowing widespread DTI applications. However, DTI data require interpretation before they can be useful. Visualization methods are needed to bridge the gap between the DTI datasets and understanding of the underlying tissue microstructure. A diffusion tensor measures a 3D diffusion process and has six interrelated tensor components. A volumetric DTI dataset consists of a 3D grid of these diffusion tensors that
2 2 Vilanova, Zhang, Kindlmann, Laidlaw form complicated patterns. The multivariate nature of the diffusion tensor and the 3D spatial characteristics of the diffusion tensor field combine to make DTI visualization a challenging task. This chapter compares current visualization techniques and analyzes their strengths and weaknesses. DTI research is broadly interdisciplinary. Figure 1 gives a simplified illustration of the research domains surrounding DTI. It is worth noting that all of the components in the diagram are interrelated in a loop: new discoveries in one specific area often lead to improvements in the whole DTI field. For example, Pierpaoli et al. found incorrect connections in the neural pathways generated from a DTI dataset [1]. Issues like this stimulate research in diffusion imaging, and lead to new methods, in this case high angular resolution imaging [2, 3]. In section 2, we review techniques for DTI data acquisition In section 3, we survey the computation and visualization techniques. We review some applications of DTI in section 4, discuss some open issues and problems in section 5, and conclude in section 6. Fig. 1. The research context of DTI. Note that all the research domains are interrelated: progress in one domain can easily propagate into the rest of the field. 2 Diffusion Tensor Imaging As for any visualization method, the merits of DTI visualization methods depend on the quality of the data. Understanding where the data come from, what they measure, and what their limitations are is an important first step in designing and implementing a visualization scheme.
3 Visualization and Applications of DTI 3 Water molecules in human tissues constantly collide randomly with one another and with other molecules, a phenomenon called Brownian motion. In pure water, this seemingly random movement results in a dynamically expanding Gaussian distribution of water molecules released from one point [4]. In human tissues, however, cell membranes and large protein molecules limit the motion of water molecules. The geometrical and physical properties of the tissue determine the rate and direction of diffusion. We can thus infer the microstructure of human tissue by measuring the diffusion of the water molecules. The discovery of the nuclear magnetic resonance (NMR) effect [5, 6] in 1946 was the beginning of work that has led to the current form of diffusion magnetic resonance imaging (MRI). Two important landmarks were the discovery of the spin echo [7], whose signal is perturbed by the water molecule diffusion, and MR imaging [8], which determines exactly where the NMR signal originats within the sample. Diffusion imaging was the first imaging modality that can measure the diffusion of water in human tissues in vivo. Although the exact mechanism of the generation of diffusion MRI signals in biological tissues is not fully understood, it is generally believed that the quantity measured by diffusion MRI is a mixture of intracellular diffusion, intercellular diffusion, and the exchange between the two sides of the the cell membrane [9]. Inferring tissue structure from the diffusion process requires exploring the orientation dependence of the diffusion. This dependence can be described by the diffusion propagator P (r, r,τ), which is the probability of a water molecule traveling from position r to r in diffusion time τ [10]. In practice, the number of diffusion directions we can measure in a clinical scan is limited by scanning time, making it impossible to reconstruct the diffusion propagator completely. A diffusion tensor [11] describes the orientation dependence of diffusion assuming free diffusion in a uniform anisotropic medium (Gaussian diffusion). For example, a diffusion tensor is a good model for diffusion in uniformly oriented white matter structures such as the corpus callosum, but is insufficient in areas where different tracts cross or merge. The coefficients of the diffusion tensor, D, are related to the diffusion-weighted MRI(DWI) signals by [12]: Ĩ=I 0 exp(b : D), where I 0 is the 0-weighted diffusion image, the tensor b characterizes the diffusion-encoding gradient pulses used in the MRI sequence, and b : D = 3 3 i=1 j=i b ijd ij is the tensor dot product. A 3D diffusion tensor is a 3 3 positive symmetric matrix: D xx D xy D xz D = D xy D yy D yz D xz D yz D zz Diagonalizing D, we get three positive eigenvalues λ 1,λ 2 and λ 3 (in decreasing order) and their corresponding eigenvectors e 1, e 2 and e 3. Many scalar indices and visualization methods are based on the eigenvalues and eigenvectors of DTI measurements, as discussed in section 3.
4 4 Vilanova, Zhang, Kindlmann, Laidlaw Fig. 2. Barycentric space of diffusion tensor ellipsoids. One geometric representation of Gaussian diffusion is a diffusion ellipsoid. These ellipsoids represent the surface of constant mean-squared displacement of diffusing water molecules at some time τ after they are released from one point. The shape of a diffusion ellipsoid is inherently related to the eigenvalues and eigenvectors of the diffusion tensor: the three principal radii are proportional to the eigenvalues and the axes of the ellipsoid aligned with the three orthogonal eigenvectors of the diffusion tensor. Figure 2 shows ellipsoids representing different kinds of diffusion; the difference among the shapes of the ellipsoids are discussed in section 3.1. DTI measurements have been validated within acceptable error on the fibrous muscle tissue of the heart [13, 14]. However, in a voxel containing nonuniformly oriented neural fibers (see Figure 12), DTI measures an average signal from all the fibers within the voxel, which usually results in an apparent reduction of anisotropy and increase in uncertainty [15]. To resolve the uncertainty in these areas, q-space spectral imaging [16] and other high angular resolution diffusion imaging methods [17, 18] have been explored. Image acquisition for DTI is a very active research area. Progress is frequently reported on resolution improvement and reductions in imaging time, noise, and distortion. 3 DTI Visualization Meaningful visualization of high-dimensional data is challenging because of the high dimensionality of the diffusion tensor and the complex interrelationships in diffusion tensor fields. The last decade has seen several approaches to visualizing diffusion tensor data, most of them based on reducing the dimensionality of the data by extracting relevant information from the tensor. One possible classification of the different visualization techniques is by the dimensionality to which the tensor is reduced. Another important characteristic is the ability of these algorithms to show local or global information. Our discussion here groups the visualization methods on the basis of these two criteria. Anisotropy indices reduce the 6D information to a scalar value (1D). Volume
5 Visualization and Applications of DTI 5 rendering for DTI uses anisotropy indices to define transfer functions that show the anisotropy and shape of the tensor. Tensor glyphs do not reduce the dimensionality of the tensor, instead using primitives that show the 6D tensor as such; however, these techniques cannot show global information. Vector field visualization reduces the tensor field to a vector field, and therefore to 3D. Several techniques can be used for vector-field visualization that show local as well as global information. In section 3.5, algorithms are described in which the vector field information is extended to the whole tensor. Finally in section 3.6, several interaction schemes in DTI visualization are discussed. 3.1 Scalar Indices The complexity of a DTI dataset requires a complicated visualization scheme; however, medical researchers and practitioners alike are trained to read scalar fields on gray-level images slice by slice. Scalar datasets, although limited in the amount of information they can convey, can be visualized with simplicity and clarity and thus interpreted quickly and easily. It can thus be useful to reduce DTI to scalar datasets. Since the advent of diffusion MRI, scalar indices of diffusion MRI data have been designed and visualized successfully alongside multivariate visualization schemes: rather than competing, the two methods complement one another. The challenges of reducing a tensor-valued diffusion MRI measurement to a scalar index include mapping to a meaningful physical quantity, maintaining invariance with respect to rotation and translation, and reducing the effect of noise. Some scalar indices for DTI data are listed in Table 1. Mean diffusivity (MD), which measures the overall diffusion rate, is the average of the diffusion tensor eigenvalues and is rotationally invariant. van Gelderen et al. [22] demonstrated that, after a stroke, the trace of the diffusion tensor delineates the affected area much more accurately than the diffusion image in one direction. Before the diffusion tensor model was made explicit in 1994 by Basser et al. [11], several different anisotropy indices derived from DWIs had been used, such as anisotropic diffusion ratio [23]. Unfortunately, these anisotropy indices depend on the choice of laboratory coordinate system and are rotationally variant: their interpretation varies according to the relative positions of the MR gradient and the biological tissues, usually resulting in an underestimation of the degree of anisotropy [19]. Therefore it is important to use rotationally invariant anisotropy indices such as Volume ratio (VR), rational anisotropy (RA) or fractional anisotropy (FA), which are based on the rotationally invariant eigenvalues. Note that both RA and FA can be derived from tensor norms and traces without calculating the eigenvalues. However, rotationally invariant indices such as RA and FA are still susceptible to noise contamination. Pierpaoli et al. [19] calculated an intervoxel anisotropy index, the lattice index (LI), which locally averages inner products between diffusion tensors in neighboring voxels. LI decreases the sensitivity to
6 6 Vilanova, Zhang, Kindlmann, Laidlaw Scalar Index Equations D xx + D yy + D zz Mean diffusivity, D, λ 1 + λ 2 + λ 3, Trace(D) λ 1 λ 2 λ 3 [19] Volume ratio, VR ( λ1+λ ) 2+λ 3 3,27 Determinant(D) Trace(D) D D I [20] Fractional anisotropy, FA 2 D D D I Var(λ) [20] Rational anisotropy, RA, D I E(λ) ( N ) 3 A : An [19] Lattice index, LI a n + 3 A : A n 8 D : Dn 4 D : D Dn : D n n=1 [21] Linear anisotropy, c l λ 1 λ 2 λ 1 + λ 2 + λ 3 Planar anisotropy, c p 2(λ 2 λ 3 ) λ 1 + λ 2 + λ 3 Isotropy, c s 3λ 3 λ 1 + λ 2 + λ 3 Table 1: Some scalar indices for DTI data. D = D : D is the tensor norm, Var(λ) ande(λ) are the variance and expectation of the three eigenvalues, a n is a normalized weighting factor, A = D D I. noise and avoids underestimation of the anisotropy when the neighbor voxels have different fiber orientations. Because they contract the tensor to one scalar value, FA, RA and LI do not indicate the directional variation of the diffusion anisotropy well. For example, a cigar-shaped and a pancake-shaped ellipsoid can have equal FA while their shapes differ greatly. Geometrical diffusion measures [21] have been developed: linear anisotropy, c l, planar anisotropy, c p and spherical anisotropy or isotropy, c s. By construction, c l + c p + c s = 1. Thus, these three metrics parameterize a barycentric space in which the three shape extremes (linear, planar, and spherical) are at the corners of a triangle, as shown in Figure 2. It is worth noting that, unlike FA or RA, geometrical diffusion metrics depend on the order of the eigenvalues and are thus prone to bias in the presence of noise [19]. Figure 3 shows one way to compare qualitatively some of the metrics described above by sampling their values on a slice of a DTI dataset of a brain. Notice that the mean diffusivity (MD) is effective at distinguishing between cerebrospinal fluid (where MD is high) and brain tissue (lower MD), but fails to differentiate between different kinds of brain tissue. High fractional anisotropy, FA, on the other hand, indicates white matter, because the
7 Visualization and Applications of DTI 7 directionality of the axon bundles permits faster diffusion along the neuron fiber direction than across it. FA is highest inside thick regions of uniformly anisotropic diffusion, such as inside the corpus callosum. Finally, while both c l and c p indicate high anisotropy, their relative values indicate the shape of the diffusion ellipsoid. (a) MD: mean diffusivity (b) FA: fractional anisotropy (c) c l (green) and c p (magenta) Fig. 3. Different shape metrics applied to one slice of a brain DTI scan. 3.2 Volume Rendering Volume rendering is a means of visualizing large-scale structure in a tensor field, based on locally measured properties of the tensor data [24]. Volume rendering has the defining property of mapping from the tensor field attributes to a rendered image, without introducing additional geometry. However, volume rendering is inherently flexible in the sense that the volume scene can easily be supplemented with other visualizations (such as glyphs or fiber tracts, described in the following sections) to create a more informative image. Compositing all the scene components together creates an integrated visualization in which local and global aspects of the field may be seen in context. The volume of tensor field attributes can either be pre-computed and stored as a scalar field, or computed implicitly as part of rendering. In either case, an anisotropy index plays the important role of determining the opacity (thus visibility) of each sample. Each sample is then colored and shaded to indicate local shape characteristics, then samples composited as the integral of colors and opacities sampled along each ray. An essential element of volume rendering is the transfer function, which assigns colors and opacities according to locally measured field properties. Traditionally, volume rendering has been applied to visualization of scalar fields, in which the domain of the transfer function is either the scalar value
![8 Vilanova, Zhang, Kindlmann, Laidlaw defining the dataset or additionally includes derived quantities such as the gradient magnitude [25, 26].](/docs-images/75/71720051/images/8-0.jpg "The transfer function is usually implemented as a one-dimensional or two-dimensional lookup table.")

 is attractive in this respect because it can be expressed in terms of differentiable tensor invariants, so the chain rule can be used to calculate the gradient of FA as a")
, these images are computed with an opacity step function: opacity is 0.0 or 1.")
8 8 Vilanova, Zhang, Kindlmann, Laidlaw defining the dataset or additionally includes derived quantities such as the gradient magnitude [25, 26]. The transfer function is usually implemented as a one-dimensional or two-dimensional lookup table. The transfer function domain variables are quantized to generate indices of table entries that contain the colors and opacity of the transfer function range. The extension of volume rendering to diffusion tensor fields is thus essentially a matter of determining which quantities should serve as transfer function domain variables. To define opacity, the anisotropy indices in Table 1 are used. Fractional anisotropy (FA) is attractive in this respect because it can be expressed in terms of differentiable tensor invariants, so the chain rule can be used to calculate the gradient of FA as a normal for surface shading. Figure 4 shows depiction of basic 3-D structure with volume-rendered isosurfaces of fractional anisotropy. Rather than using a polygonal model of the anisotropy isosurface (as with Marching Cubes [27]), these images are computed with an opacity step function: opacity is 0.0 or 1.0 depending on whether FA is below or above the indicated threshold. FA = 0.0 FA = 0.3 FA = 0.5 FA = 0.65 Fig. 4. Volume-rendered isosurfaces at a range of FA values show basic 3D structure of white matter in a DTI brain scan. Color can be assigned in diffusion tensor volume rendering to indicate either the orientation or the shape of the underlying tensor samples. Applying the standard RGB coloring of the principal eigenvector (Sect. 3.4) allows basic neuroanatomic features to be recognized by their over-all color, as in Figure 5(a). Color can also be used to clarify differences in the shape of anisotropy apart from the anisotropy index used to define opacity. In particular, the difference between linear and planar anisotropy as measured by the c l and c p indices (Table 1) can be mapped onto the anisotropy isosurface, as in Figure 5(b) (where the variation from green to magenta for linear to planar anisotropy is the same as in Figure 3(c)). The rendering indicates how features with orthogonal orientations lead to planar anisotropy at their adjacencies. Locations in the brain characterized by this configuration of white matter fibers include the right-left trans-pontine tracts ventral to the inferiorsuperior corticospinal tracts in the brainstem, and the right-left tracts of the corpus callosum inferior to the anterior-posterior cingulum bundles.
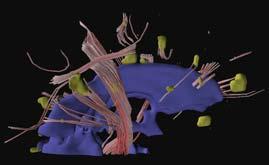
9 Visualization and Applications of DTI 9 (a) Principal eigenvector (b) Linear versus planar Fig. 5. Volume renderings of half a brain scan, (a) colored according to orientation of principal eigenvector, and (b) the distribution of linear (green) and planar (magenta) anisotropy. Surface is defined by FA = 0.4. A recent application of volume rendering to diffusion tensor visualization is based on converting the tensor field to scalar fields, as described by Wenger et al. [28]. The approach here is to precompute multiple scalar volumes, that can be layered and interactively rendered with 3D texture-mapping graphics hardware [29]. The renderings in Figure 6 demonstrate visualizations which combine a volume rendering of the ventricles, together with a collection of fiber tracts rasterized into a color-coded scalar volume, to illustrate the relationship between the distribution and direction of the fiber tracts and the large-scale patterns of anisotropy. The flexible combination of the different scalar volumes into the final rendering permits interactive exploration and generation of visualizations. There are currently no implementations that can volume render directly from a diffusion tensor volume to an image at interactive rates. The computational speed and flexibility of modern graphics hardware is increasing at such a rate, however, that this should soon be feasible. For example, two-dimensional transfer functions took minutes to render (in software) when introduced in 1988 [26], but can now be rendered at multiple frames per second with commodity graphics hardware [30]. Whether applied to scalar or tensor data, the intrinsically data-parallel nature of volume rendering means it is well suited to streaming-based processors found on modern graphics hardware [31]. We anticipate that volume-rendering graphics hardware will play an increasing role in the interactive visualization of diffusion tensor data. 3.3 Tensor Glyphs Another avenue of DTI visualization has focused on using tensor glyphs to visualize the complete tensor information at one point. A tensor glyph is a parameterized graphical object that describes a single diffusion tensor with its size, shape, color, texture, location, etc. Most tensor glyphs have six or more
 show collections of threads consistent with major white-matter structures: IC=internal capsule, CR=corona radiata, CB=cingulum bundle, CC=corpus callosum, diagrammed on")


10 10 Vilanova, Zhang, Kindlmann, Laidlaw Fig. 6. Interactive volume renderings of a human brain dataset. The volume renderings (top) show collections of threads consistent with major white-matter structures: IC=internal capsule, CR=corona radiata, CB=cingulum bundle, CC=corpus callosum, diagrammed on the bottom. Components of the tensor-valued data control thread direction, color, and density. Direct volume rendering simultaneously shows the ventricles (labeled V) in blue for anatomical context. degrees of freedom and can represent a diffusion tensor completely. However, tensor glyphs do not expose relationships and features across a diffusion tensor field, rather, they imply these relationships from the visual correlation and features of the individual glyphs. While exploiting many different types of tensor glyphs, from boxes to ellipsoids to superquadrics, tensor glyph designers aim to make the mapping between glyphs and diffusion tensors faithful, meaningful and explicit. The diffusion ellipsoid described in section 2above is the most commonly used representation of a diffusion tensor. Pierpaoli et al. [19], in the first use of ellipsoids as tensor glyphs, associated ellipsoid size with the mean diffusivity, indicated the preferred diffusion direction by the orientation of the diffusion ellipsoid. Arrays of ellipsoids were arranged together in the same order as the data points to show a 2D slice of DTI data. Laidlaw et al. normalized the size of the ellipsoids to fit more of them in a single image [32] (see Figure 7(a)). While this method forgoes the ability to show mean diffusivity, it creates more uniform glyphs that better show anatomy and pathology over regions.
 Brush strokes illustrate the direction and magnitude of the diffusion: background color and texturemap show additional information. Fig. 8.")
11 Visualization and Applications of DTI 11 (a) (b) Fig. 7. (a) Arrays of normalized ellipsoids visualize the diffusion tensors in a single slice. (b) Brush strokes illustrate the direction and magnitude of the diffusion: background color and texturemap show additional information. Fig. 8. Superquadrics as tensor glyphs, sampling the same barycentric space as in Figure 2. Laidlaw et al. [32] also developed a method that uses the concepts of brush strokes and layering from oil painting to emphasize the diffusion patterns. They used 2D brush strokes both individually, to encode specific values, and collectively, to show spatial connections and to generate texture and a sense of speed corresponding to the speed of diffusion. They also used layering and contrast to create depth. This method was applied to sections of spinal cords of mice with experimental allergic encephalomyelitis (EAE) and clearly showed anatomy and pathology (see Figure 7(b)). Boxes and cylinders have also been used to show the directions and relative lengths of all three eigenvectors. Boxes clearly indicate the orientation of the eigenvectors. They also have fewer polygons and are thus faster to render. But their flat faces usually make it hard to infer the 3D shapes from a 2D image (see Figure 9(a) below). Kindlmann adapted superquadrics, a traditional surface modeling technique, to generate tensor glyphs [33]. The class of shapes he created includes spheres in the isotropic case, while emphasizing the differences among the
. eigenvalues in the anisotropic cases.")
12 12 Vilanova, Zhang, Kindlmann, Laidlaw (a) Boxes (b) Ellipsoids (c) Superquadrics Fig. 9. A portion of a brain DTI scan as visualized by three different glyph methods (overall glyph sizes have been normalized). eigenvalues in the anisotropic cases. As shown in Figure 8, cylinders are used for linear and planar anisotropy and intermediate forms of anisotropy are represented by approximations to boxes. As with ellipsoid glyphs, a circular cross-section accompanies equal eigenvalues, for which distinct eigenvectors are not defined. The differences among some of the glyph methods can be appreciated by comparing their results on a portion of a slice of a DTI brain scan, as shown in Figure 9. The individual glyphs have been colored with the principal eigenvector colormap. The directional cue given by the edges of box glyphs 9(a) is effective in linearly anisotropic regions, but can be misleading in regions of planar anisotropy and isotropy, since in these cases the corresponding eigenvectors are not well defined numerically. The rotational symmetry of ellipsoid glyphs 9(b) avoids misleading depictions of orientation, with the drawback that different shapes can be difficult to distinguish. The superquadric glyphs 9(c) aim to combine the best of the box and ellipsoid methods. 3.4 Vector Field Visualization The tensor field can also be simplified to a vector field defined by the main eigenvector, e 1. This simplification is based on the assumption that in the areas of linear anisotropy, e 1 defines the direction of linear structures. The sign of e 1 has no meaning. One commonly used method to visualize DTI data is to map e 1 to color, e.g., directly using the absolute value of the e 1 components for the RGB channel: R = e 1 x, G= e 1 y, B= e 1 z The saturation of this color is weighted by an anisotropy index to deemphasize isotropic areas (see figure 10). Other methods have been proposed to visualize the global information of 2D as well as 3D vector fields [34], and there are well established 2D vectorfield visualization methods [35]. Although 2D techniques have been extended
13 Visualization and Applications of DTI 13 to 3D, the visualization of 3D vector fields is still a challenging problem due to visual cluttering and computational cost. We concentrate here on 3D DTI data. The most commonly used technique to visualize DTI data is streamline tracing; in DTI-specific literature this is also called fiber tracking [36] or tractography [37]. There is a direct analogy between the streamlines and the linear structures to be visualized (e.g., fibers). Furthermore, streamlines in 3D can easily be visualized by regions in order to avoid cluttering. Streamline tracing is based on solving equation: p(t) = t 0 v(p(s))ds (1) where p(t) is the generated streamline and v corresponds to the vector field generated from e 1. p(0) is set to the initial point of the integral curve. The streamline technique has three main steps: definition of initial tracking points (i.e., seed points), integration, and the definition of stopping criteria. Seed points are usually user defined: the user specifies one or more regions of interest (ROI). Interior of the ROIs are sampled and the samples are used as seed points. Equation ( 1 ) is solved by numerical integration via such schemes as: Euler forward and second-or fourth-order Runge-Kutta. Stopping criteria avoids calculation of the streamline where the vector field is not robustly defined. In areas of isotropic or planar diffusion, the value of e 1 can be considered random, and thus has no meaning for the underlying structure. The user can usually set a threshold based on the anisotropy indices (e.g., FA, RA or C l ) to describe the areas where the vector field is defined; the value of this threshold depends on the data-acquisition protocol and the (a) axial slice (b) sagital slice Fig. 10. Mapping of e 1 to the RGB channel shown in 2D slices of a healthy volunteer brain.
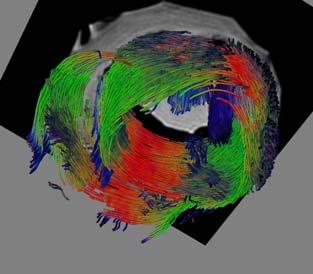
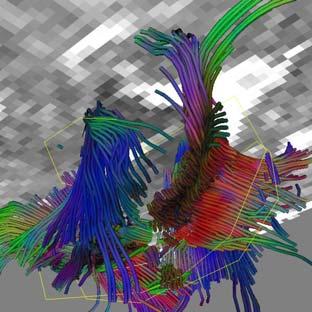
14 14 Vilanova, Zhang, Kindlmann, Laidlaw (a) (b) Fig. 11. (a) Streamline tracing using two ROIs to trace the corona radiata in a data set of a healthy volunteer brain. (b) Streamlines in a data set of a goat heart using the tracing seeding technique by Vilanova et al. [38] nature of the object that is being scanned. Other criteria can also be used, such as the curvature or length of the streamline. Hyperstreamlines are an extension to streamlines for second-order tensor fields [39], first used by Zhang et al. for DTI data [40]. Hyperstreamlines employ all eigenvalues and eigenvectors. A streamline defines the axis of a generalized cylinder whose cross-section perpendicular to the axis is an ellipse defined by e 2 and e 3 and λ 2 and λ 3, respectively. Streamline-tracing techniques for DTI have several disadvantages that are constantly being addressed. In areas of non-linear diffusion the main eigenvector is not robustly defined [15]. However, linear structures can be present in areas with nonlinear diffusion, appearing where the linear structure direction is not coherent within a voxel (see figure 12) or arising from noise. Most DTI tracing algorithms consider only the areas where the vector field is defined robustly. Several authors have proposed methods to trace within areas of isotropic or planar diffusion following the most probable diffusion direction based on some heuristics(e.g., [41, 42]). Some of these methods are based on regularization techniques that are commonly used in image processing for noise removal. Another difficulty in streamlines is seeding. The seed points can be defined by the user. In a healthy person with known anatomy, users can estimate where the interesting bundles are and where to seed. However, in some cases, there are no real clues to the possible underlying structure and user seeding can miss important structures. Defining the seed points to cover the whole volume can be computationally expensive, however and furthermore, too many seed points, clutter the image and it becomes difficult to extract useful information. Zhang et al. [40] employed uniform seeding throughout the entire volume and developed a culling algorithm as a postprocessing step to control
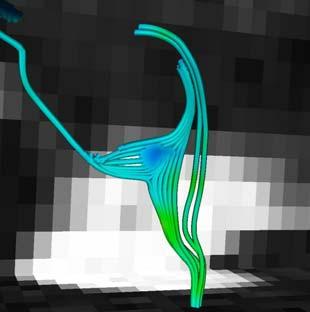
15 Visualization and Applications of DTI 15 Fig. 12. Regions on which fibers are present but the diffusion tensor is planar: (left) kissing fibers, (middle) two fiber bundles crossing and (right) diverging fibers. Gray regions have a tensor with planar diffusion. the streamlines density.this allows inside structures to be visible and outside structures still to be adequately represented. The metrics for the culling process include the length of a trajectory, the average linear anisotropy along a trajectory, and the similarity between a trajectory and the group of trajectories already selected. Vilanova et al. [38] extended of Jobard et al. s seeding algorithm [43] for 3D DTI data (see Figure 11(b). Here seeding and generation of streamlines depend on a parameter that defines the density of the streamlines (i.e., minimal distance between streamlines). This method allows control of cluttering and a less computationally expensive generation of streamlines than seeding the whole volume regularly. However, if the density is set to a low value this method does not guarantee that the important structures are visible, since only the distance between streamline seed points is taken into account. Generally, the fiber bundles are more interesting than an individual, and here several authors have proposed ways to cluster the streamlines to obtain bundles (e.g.,[44, 45, 46, 47]). These algorithms differ primarily in the metrics used to define the similarity between streamlines and clusters, which are mainly based on the shape and distance between fiber pairs. It is not clear which metric gives the best clustering results. Bundles are a compact representation of the data, that alleviates cluttering; however, these algorithms have the disadvantage of relying solely on the results of the streamline-tracing algorithm, and therefore are very sensitive to its errors. 3.5 Beyond Vector Field Visualization The previous section presented several visualization methods on which the diffusion tensor data are simplified to the main diffusion direction to reconstruct the underlying linear structure. In doing this of course information is lost. In this section, we present several approaches that try to rectify this loss and use more information than the main eigenvector.
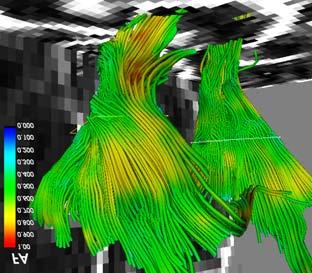
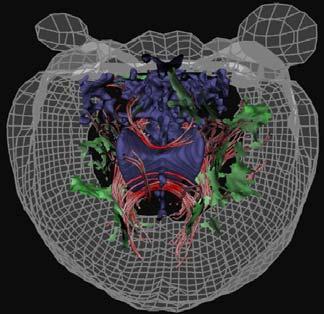
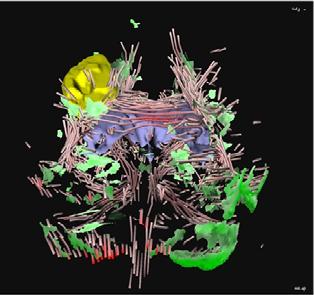
16 16 Vilanova, Zhang, Kindlmann, Laidlaw In the streamline tracing algorithm, the main eigenvector is assumed to represent the tangent vector of an underlying linear structure. In a similar way, it can be assumed that planar anisotropy indicates planar structure. Therefore, the two main eigenvectors define the tangent plane of an underlying planar structure, i.e., streamsurface. Zhang et al. [40] presented an algorithm to generate the streamsurface based in the planar anisotropy. Figure 13(a) shows the results of using their algorithm to trace streamlines and streamsurfaces in the whole volume. Vilanova et al. [38] used a similar algorithm in combination with streamline tracing to show the areas where linear structures cross, kiss, converge or diverge (see Figure 12). Figure 13b shows streamlines generated by a few seed points (in the yellow circle). Instead of stopping, a streamsurface is traced when a streamline reaches an area of planar anisotropy. In addition, the possible continuations of the initial streamline going through the streamsurface are traced further. Seed Points (a) (b) Fig. 13. (a)red streamlines (represented as cylinders) and green streamsurfaces generated using the method of Zhang et al. [40] show linear and planar anisotropy, respectively, together with anatomical landmarks for context; (b) Streamlines using seed points (yellow region), trace streamsurfaces and show the possible prolongation of the fiber bundle, generated using the algorithm Vilanova et al. algorithm [38] Streamsurfaces are extensions of streamlines, but the tensor information is still simplified and not treated as a whole. Parker et al. [48] and Brun et al. [49] modelled all possible paths from a given starting point. Parker et al. used a front-propagation method with a speed function based on the underlying tensor field. The path between the starting point and any point in the volume is defined, by using the time of arrival of the front to each point and a gradient descent algorithm. A connectivity metric describes the likelihood of connection of each path. Brun et al. [49] modelled the paths as a probability distribution, that is discretely represented by weighted samples from it. For
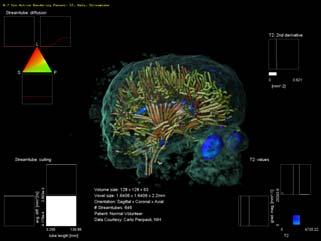
17 Visualization and Applications of DTI 17 each path, a connectivity is also assigned according to diffusion tensor and the path s shape. Batchelor et al. [50] propose a method based on simulating the diffusion defined by the diffusion tensor, and use a probabilistic interpretation of the time of arrival of the diffusion front to quantify the connectivity of two points. O Donnell et al. [51] describe a similar idea: a flux vector field based on solving the steady-state concentration is created. Paths generated in this vector field have a measure of connectivity based on the flow along the paths; the maximum flow indicates the most probable connection. They also present a method based on warping the space locally using a metric defined by the inverse of the diffusion tensor. Finding the minimum-distance path (i.e., geodesic) in this warped space provides a reconstruction of a possible underlying linear structure and a numerical measure of connectivity between two points (i.e., distance). The advantage of these methods is that they are well defined in the complete space, even in areas with planar or isotropic diffusion. Furthermore, they give a quantitative measure of connectivity. Their drawbacks are that they are computationally expensive and any pair of points in the space is connected. Therefore, it is necessary to define not just a starting point but also end points, or to establish criteria for which points are considered to be connected (e.g., a percentile of the most probable connections). There have been several efforts to visualize the global information of the second-order tensor field in general [52, 53]. Recently, Zheng and Pang [54] presented an extended the vector-field visualization method LIC (line integral convolution) to tensor data. As in the 3D extension of the LIC, cluttering is a problem, when this method is applied to DTI data, not much more than the outer shell of the anisotropic areas is visible. Hesselink et al. [55] presented a method to extract topology skeletons of second-order 3D tensor fields. These skeletons are mainly defined by points, lines and surfaces that represent the complex structure of a tensor field in a compact and abstract way. The main component of the topology is the calculation of degenerated points whose eigenvalues are equal to each other. The main drawback of this method is the lack of intuitive interpretation of the topology skeletons for tensor fields. It is also very sensitive to noise, so that the resulting skeletons can be very complex and difficult to analyze. 3.6 Interaction Human-computer interaction (HCI) arises in multiple aspects of DTI visualization: transfer function manipulation, seeding point selection, streamline culling, streamline query, and graphical model exploration, to name a few. We briefly review some of the interaction techniques here. In volume rendering, transfer functions determine the mapping from the data to color and opacity (see section 3.2). The selection of transfer functions often requires expertise; in addition, it is often done by trial and error, so that it is important that the user be able to select the transfer functions intuitively
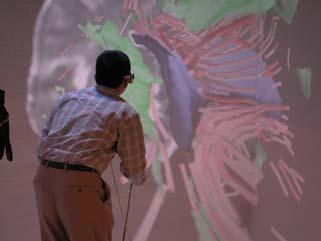
18 18 Vilanova, Zhang, Kindlmann, Laidlaw and quickly. Kniss et al. [30] describes a set of widgets that let the user specify multi-dimensional transfer functions interactively. Wenger et al. [28] applied this idea to DTI volume rendering, employing a set of widgets including a barycentric widget for manipulating the geometrical diffusion measures (see Figure 14). Interaction permeates the whole process of vector field visualization: both seeding points selection and connectivity query involve specifying ROIs. Streamline culling requires selecting certain criteria and setting the corresponding thresholds. And displaying the 3D streamline models often relies on user input to show the models at different scales and perspectives. Akers et al. [56] developed a pathway-query prototype to expedite the first two operations, precomputing the pathways and their statistical properties to achieve real-time interaction. The complexity of the DTI datasets often yields complicated graphical models that are hard to discern in a still picture. Continuing developments in computer graphics constantly change how user interact with these models. Desktop 3D graphics used mouse click and drag to move the models; fishtank virtual reality display systems added stereo and head tracking [57]. the CAVE provided an immersive virtual environment that engaged the user in whole-body interaction [58] (see Figure 14(b)). However, none of these systems stand alone; each has its strengths and weaknesses depending on certain applications [57]. The interaction schemes can also be combined in hybrid visualization methods. For example, the streamtube-culling widget can be incorporated into the control panel with various other transfer function widgets (see Figure 14(a)). A traditional light-box display of a structural image slice provides context in a complex 3D scene (see Figure 14(b)). Currently, computational power limits our ability to achieve real-time interaction and precomputed models must often be used for the sake of the speed. In the future, we expect a closer tie between computation and human input for more efficient and effective data exploration. 4 Applications DTI is especially useful in studying fibrous structures such as white matter and muscle: the anisotropy information it provides reveals the fiber orientation in the tissue and can be used to map the white-matter anatomy and muscle structure in vivo [37]. The diffusion coefficient measures a physical property of the tissue and the measurements can be compared across different times, locations, and subjects. Therefore, DTI has frequently been used to identify differences in white matter due to a variety of conditions. Normal conditions such as age and gender have been reported to affect anisotropy and diffusivity; neural developments such as myelination, physical trauma such as brain injury, and neurodegenerative diseases such as multiple sclerosis and HIV have all
19 Visualization and Applications of DTI 19 (a) (b) Fig. 14. (a) An interactive exploration tool for DTI volume rendering. Clockwise from upper left are a 2D barycentric widget, a 1D widget, a 2D Cartesian widget, and a 2D Cartesian culling widget. (b) A user explores a complex 3D model in virtual reality. been indicated by DTI studies to affect white-matter composition, location, or integrity. The variety of DTI applications provides a valuable testbed for visualization methods. Indeed, without applications to guide the development of computational and visualization tools, these tools are far less likely to be applicable. We introduce some of the applications in this section. 4.1 White matter normal conditions Some normal conditions can affect the microstructure of white matter. Significant differences were found in diffusivity and anisotropy of the human corpus callosum with gender and handedness [59]. Age also has significant effect on white matter, usually resulting in reduced FA and increased diffusivity [60, 61]. These factors should be considered when selecting control groups for white-matter pathology studies. The vector field visualization methods introduced in section 3.4 have been employed to reveal connectivity in a normal brain. A common application is to use neuroanatomy knowledge to select the ROIs and then reconstruct neural pathways running through them. Evidence of occipito-temporal connections within the living human brain was found by tracing neural pathways between two ROIs [62]. Expert-defined ROIs for brainstem fibers and associate fibers have been used to generate corresponding tracts [63]. An exciting trend is to combine functional MRI (fmri), which measures the changes in blood flow and oxygenation in a brain area, with DTI fiber tracking, so that both activated brain areas and the tract connecting them to other brain areas can be visualized at the same time. For example, foci of fmri activation have been used as ROIs to reveal axonal connectivity in a cat s visual cortex [64].
20 20 Vilanova, Zhang, Kindlmann, Laidlaw 4.2 White Matter Development Almost all the neurons that the brain will ever have are present at birth. However, the brain continues to develop for a few years after birth. A significant aspect of brain development is myelinization, the continued growth of myelin around the axons. Myelin acts as an isolating membrane and allows a conduction of nerve impulses from ten to one hundred times faster than along a non-myelinated system and, at birth, few fibers are myelinated. The development of myelin is a measure of increasing maturity of the neural system. Previous studies have explored when particular fibers are myelinated, e.g., areas related with primary sensory (vision, touch, hearing, etc.) and motor areas are the first to myelinate [65]. Diffusion tensor imaging has the potential to evaluate brain maturaty in newborns. Myelinated fibers have higher anisotropy than non-myelinated ones, i.e., the anisotropy depends on the development phase. The study of newborn brain presents new challenges: The anisotropy in the neonatal brain is lower than in the adult brain. Therefore it is more difficult to reconstruct fibers reliably. Motion artifacts can play a larger role, since neonates often move more than adults. The signal-to-noise ratio is smaller. The neonatal brain is smaller than that of an adult, and hence the voxel size must be smaller, leading to decreased signal. Furthermore, one voxel in a neonate still contains more structures than a voxel in an adults. The first years of life are a critical time for brain development. Early diagnoses of brain lesions can help diminish the consequences of an injury. For example, neonates who suffer hypoxic ischemic brain damage, have brain injuries caused by lack of oxygen and nutrients arising from blood flow problems. Diffusion weighted imaging has already proved useful in detecting this injury. Diffusion tensor imaging might provide further information about structure and the development of the neonatal brain. Figure 15(a) shows the fibers corresponding to a data set of a premature neonate of 26 weeks and scanned at six weeks old. Several fiber structures are visible (e.g., corona radiata in blue). However, the corpus callosum is not visible: the arrow indicates where the fibers are missing. Further investigation of all MR images of this neonate confirmed that this patient lacks a corpus callosum. Figure 15(b) shows the result of tracing streamlines using ROIs to visualize the corpus callosum and the corona radiata in a full-term neonate scanned after four weeks of birth. The DTI data does not reveal any alteration in the fibers despite the neonate had meningitis. 4.3 White matter injury and disorders DTI has proven effective in studying a range of white-matter disorders including brain injury, brain tumor, focal epilepsy, multiple sclerosis, tuberous
21 Visualization and Applications of DTI 21 a) b) Fig. 15. Studies of fibers in neonatal brains with different data sets. (a) Premature neonate lacking corpus callosum (see arrow), (b) full-term neonate where no fiber abnormalities were found. Corpus callosum and corona radiata are seen. sclerosis, Parkinson s disease, Alzheimer s disease, schizophrenia, HIV infection, Krabbe s disease, chronic alcohol dependence, ALS, X-linked ALD, and CADASIL. Reviews of these studies can be found in [66, 67, 68, 69]. We select three application areas in which pathological causes differ greatly, resulting in different patterns and subtleties of the changes in white matter. Effective analysis of these cases can be realized only by applying processing and visualization methods accordingly. Brain tumor It is estimated that 17,500 people in the U.S. die from primary nervous-system tumors each year [70]. A better understanding of the pathophysiology of brain tumors is essential if we are to find effective treatments. Cortical disconnection syndromes may play a significant role in clinical dysfunction associated with this disorder. Tractography methods have been applied to study patterns of whitematter tract disruption and displacement adjacent to brain tumors. Wieshmann et al. [71] found evidence of displacement of white-matter fibers of the corona radiata in a patient with low-grade glioma when compared with spatially normalized data collected from 20 healthy volunteers. Mori et al. [72] found evidence of displacement and destruction of the superior longitudinal fasciculus and corona radiata in two patients with anaplastic astrocytoma. Gossl et al. [73] observed distortion of the pyramidal tract in a patient with a high-grade glioma. Witwer et al. [74] found evidence of white matter tract edema. Zhang et al. [75] observed the pattern of linear and planar diffusion
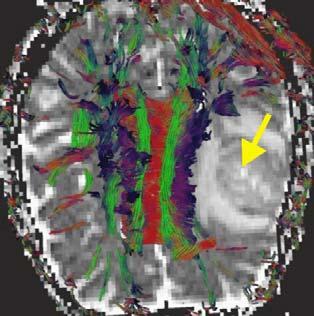
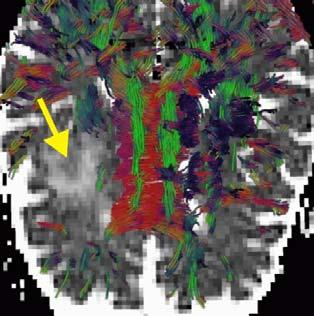
22 22 Vilanova, Zhang, Kindlmann, Laidlaw Cl=1 Cp=1 Cs=1 (a) (b) Fig. 16. Visual exploration and quantitative analysis of a tumor brain. (a) A 3D visualization showing streamtubes and streamsurfaces as well as tumor and ventricles. (b) The difference histogram obtained by subtracting normalized barycentric histograms calculated from tumor-bearing and contralateral sections. Here zero maps to medium gray because the difference is signed. Note that the most striking difference occurs near the c s =1vertex. around the tumor and analyzed the asymmetries of white-matter fiber tracts between the tumor and the contralateral hemispheres. Figure 16 shows visual exploration and quantitative analysis of a tumor brain [75]. The streamtubes and streamsurfaces visualize both linear and planar diffusion. The displacement of fiber tracts around the tumor is accompanied by a cradle of streamsurfaces, indicating a local increase of planar anisotropy. The normalized distribution of anisotropy is calculated on a barycentric space (see section 3.1) for both the tumor side and contralateral side of the brain. The difference in the two distributions (Figure 16(b)) clearly indicates a decrease in linear anisotropy and an increase in planar anisotropy in the tumor side of the brain. As Figure 17 indicates, the geometrical alteration of fiber structures surrounding the tumors can have different patterns [38]. In Figure 17(a), the fibers are pushed to the left by the presence of the tumor; in Figure 17(b), the fibers seem to be destroyed: the structure around the tumor is not moved, but in the tumor area no fibers are present. Tumors and their surrounding edema often cause gross changes in the neural fibers around them. DTI can benefit tumor growth study and surgery planning by modeling these changes geometrically. Scalar index analysis complement the geometrical modeling by quantifying these changes.
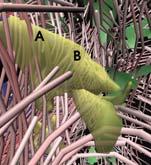
23 Visualization and Applications of DTI 23 (a) (b) Fig. 17. Two cases of adult tumor brain. (a) shows the fibers are pushed by the tumor. (b) shows no fiber in the tumor area, indicating the destruction of neural structures there. Multiple sclerosis Multiple sclerosis (MS) is a chronic disease of the central nervous system that predominantly affects young adults during their most productive years. Pathologically, MS is characterized by the presence of areas of demyelination and T-cell predominant perivascular inflammation in the brain white matter. Recent studies on MS have shown an elevated mean diffusivity and reduced diffusion anisotropy [76] in MS lesion areas. The lesions with more destructive pathology are generally shown to have the highest diffusivity. Analyzing the interrelationship between the MS lesion and the affected fiber pathways might help in understanding the mechanism of the axonal damage. The visualization of DTI models with coregistered MS lesion masks in Figure 18 can be utilized to determine the relationship between focal lesions and the neuronal tracts that are anatomically related. Figure 18(b) suggests the different effects that the focal lesions might have on the fibers. Note that the streamtubes sometimes continue through the lesions (A) and sometimes break within them (B). Figure 18(c) depicts only the fiber pathways that are confined in the lesion area. MS lesions are often dispersed and show different levels of severity. Visualizing the affected tracts can clarify the various effects of the lesions. Also, the connection of partially damaged tracts to the gray matter might help explain the disabling effect of MS. HIV neurodegeneration Human immunodeficiency virus (HIV) is an aggressive disease that affects multiple organ systems and body compartments, including the central ner-
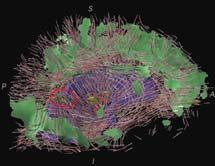
24 24 Vilanova, Zhang, Kindlmann, Laidlaw (a) (b) (c) Fig. 18. Visualization of coregistered DTI and MS lesion models. (a) The whole brain with streamtubes, streamsurfaces, lesion masks and ventricles. (b) A closeup view of white matter fibers near the MS lesions. The streamtubes around the lesion area give some clues about white matter structural changes there. (c) The same brain and view as (a) but showing only streamtubes that contact the lesions, thus clarifying the white matter structures involved. vous system (CNS). Structural imaging studies of HIV patients brains reveal morphometric changes in the subcortical gray and white matter regions [77]. However, because of the relatively poor sensitivity of structural imaging to white-matter abnormalities in patients with mild HIV [78], the relationship between cognition and white-matter abnormalities in structural MRI has not been fully determined. These limitations can be overcome by DTI. Recent DTI studies have demonstrated abnormalities among patients with HIV, even in the absence of white-matter abnormalities on fluid-attenuated inversion recovery (FLAIR) structural MRI scans [79, 80]. Most recently, Ragin et al. [81] reported strong relationships between whole-brain fractional anisotropy and severity of dementia among a small cohort of HIV patients (n = 6). In cases such as HIV infection, where the white-matter structural changes may be too subtle to detect with structural imaging, DTI can be used to quantify the changes. 4.4 Myocardial Structure Diffusion tensor MRI can also be used to measure directionally constrained diffusion applies to tissues outside the nervous system. Understanding the complex muscular structure of the mammalian heart is another important application. The efficiency of the heart is due in part to its precise arrangement of myofibers (contractile muscle cells), especially the myocardium (the muscular wall) of the left ventricle, which responsible for pumping blood to the rest of the body. The pattern of myofiber orientation in the myocardium is helical: between the epicardium and endocardium (outer and inner surface) there is roughly a 140 degree rotation of myofiber orientation, from -70 to +70 degrees. Computational simulations of heart dynamics require an accurate model of the myofibral orientation in order to model both the contractile
![Visualization and Applications of DTI 25 mechanics of the myocardium and the pattern of electrical wave propagation within it [82].](/docs-images/75/71720051/images/25-0.jpg "The principal eigenvector as measured by DT-MRI has been confirmed to align with the myofiber orientation [13, 14]. Recent work (Figure 4.")
25 Visualization and Applications of DTI 25 mechanics of the myocardium and the pattern of electrical wave propagation within it [82]. The principal eigenvector as measured by DT-MRI has been confirmed to align with the myofiber orientation [13, 14]. Recent work (Figure 4.4) has applied superquadric tensor glyphs to visualize the myofiber twisting, and to inspect other anatomical features revealed by DT-MRI [83]. Fig. 19. Visualization of transmural twist of myofibers in canine myocardium, seen in a short axis slice. The edges of the superquadric glyphs help show the flat inclination at midwall and the differences among the eigenvalues at various locations. As is clear from the descriptions above, the applications of DTI are increasingly diverse. Associated with the breadth of application areas is a need for a wide variety of visualizations techniques. Characterizing a tumor s effect on white matter integrity is based on fiber tracking, while the effect of neurodegenerative diseases may be quantified in terms of anisotropy metrics, and myocardial structure is described by a continuous rotation of the principal eigenvector. Successfully applying DTI to new research areas and problem domains demands that visualization tools be flexible enough to support experimentation with the range of techniques, so as to evaluate the appropriateness of each. This in turn requires that the modes of interaction efficiently support the exploration and parameter setting needed for creating visualizations, ideally in a manner friendly to application-area experts who may not be visualization experts. DTI visualization methods and their application will remain an active research area. 5 Open Problems We have presented several visualization techniques for DTI data that have been proposed in the last decade. These methods try to show the relevant information to physicians and researchers such that they can get insight on the data. These methods usually simplify the tensor information or are not
26 26 Vilanova, Zhang, Kindlmann, Laidlaw able to show its continuity. Further study of methods where the global whole tensor information can be shown is necessary. In clinical practice, anisotropy indices, such as FA or trace, are commonly used. Although, they show just a few information of the tensor, their visualization is similar to what radiologies are used to, and they are easy to understand and quantify. Other popular visualization techniques are based on tractography or fiber tracking, probably due to its direct analogy from streamlines to fibers. However, most of these techniques require some input from the user(e.g., seed point) and therefore they are user dependent. Important information can be missed if the user fails to give the right input. This might be quite challenging for data sets of patients where there is no real clue about what to expect. Non user dependency is critical for comparison and evaluation of diseases. Some methods have tried to achieve that by reconstructing linear structures in the whole volume so that all data is shown. The main problems in this case are the computational cost and the huge amount of data to inspect. Therefore, there is the need of good navigation tools that allow the user to inspect the data easily. For example, grouping or clustering of data without losing the detail can help the navigation. In order to explore the data, it is critical that the interaction is intuitive and in real-time. Interaction is also important for the setting of parameters, such as, transfer functions or thresholds (e.g., c l in fiber tracking to define areas with linear structure). This is necessary to explore new applications of DTI data and to robustly analyze the results. Visualization of uncertainty measures can also help in the analysis of data. At the moment, quantification can be done based on anisotropy indices. However quantification is an open problem in DTI when more DTI information is used. It is possible to evaluate the data qualitatively, however quantitative evaluation is difficult and needs further research. Quantification is important to get clinical acceptance. It should be possible to evaluate the methods and generate statistics and distinguish between diseased and non-diseased data. It should be possible to build models according to the different parameters that influence the results such as age, and sex. Validation is an important issue for DTI. There have been few validation studies to be able to conclude that what is measured corresponds with the anatomy [1, 13]. At the moment and to our knowledge, there is no gold standard to validate the results of the techniques developed in this field. One main open problem is the communication between different scientific fields to advance in the use of DTI in clinical practice. It is important that the physicians and technicians are able to communicate in a way the necessary software and tools to advance in the clinical investigations for DTI are developed. We presented several potential applications for DTI. However due to the open problems presented before there are few applications that are being commonly used in clinical environments. There is research in which applications DTI can be used in daily practice, or brings interesting new insight.
27 Visualization and Applications of DTI 27 Finally, although not dealt in this chapter, a main research issue is the protocols for DTI data acquisition in order to improve quality and reduce scanning times. Furthermore in image processing a lot of research has been devoted to scalar and less to vector images, but few research has been done in image processing techniques for tensor data. Filters for noise removal, interpolation, feature extraction, etc. are of relevant importance for the development of DTI. Second order diffusion tensor does not contain enough information to disambiguate areas where a voxel contains non-coherent linear structures. New representations for diffusion that show its more complex behavior are being researched. Visualization and image processing techniques might need to adapt to the complexity of this new data. 6 Conclusions DTI is the only modality that allows the visualization of tissue microstructure (e.g., white matter or muscle) in vivo. Meaningful visualizations are crucial to analyze and get insight in high-dimensional data such as DTI. We have presented several visualization techniques that have been developed in recent years. All visualization techniques have their advantages and disadvantages compared to the others. A combination of different visualization techniques might be the best solution to provide most insight in the data. However, there still essential disadvantages that need to be overcome, such as user dependency. Several potential applications for DTI have also been presented. A lot of research is being done in the study of white matter. The study of muscle such as the heart can also benefit from DTI. The goals of the research can differ from understanding, development and diagnoses. All these applications show the power of DTI to be able to see what some years ago was impossible. The variety and amount of applications of DTI is constantly increasing. DTI is a relative young and exciting new field of research that brings together several disciplines. Research in each of these disciplines is crucial to achieve fruitful results in the application and use of DTI data. Acknowledgments We thank the BioMedical NMR group at the Eindhoven University of Technology and Maxima Medical Center in Veldhoven, Drs. Raimond Winslow and Elliot McVeigh of Johns Hopkins University, and Andrew Alexander of the W. M. Keck Laboratory for Functional Brain Imaging and Behavior at the University of Wisconsin-Madison, for providing some of the datasets and evaluations used in this chapter. We thank Dr. Mark Bastin of the University of Edinburgh, Dr. Jack Simon of the University of Colorado Health Science Center, and Dr. Robert Paul of the Brown Medical School for providing some
28 28 Vilanova, Zhang, Kindlmann, Laidlaw of the data sets and for contributing to the section on white matter injury and disorders. References 1. C. Pierpaoli, A.S. Barnett, S. Pajevic, A. Virta, and P.J. Basser. Validation of DT-MRI tractography in the descending motor pathways of human subjects. In ISMRM, Conf. Proc., page 501, D.S. Tuch, R.M. Weisskoff, J.W. Belliveau, and V.J. Wedeen. High angular resolution diffusion imaging of the human brain. In ISMRM, Conf. Proc., page 321, L.R. Frank. Anisotropy in high angular resolution diffusion-weighted MRI. MR in Medicine, 45(6): , A. Einstein. Über die von der molekularkinetischen Theorie der Wärme geforderte Bewegung von in ruhenden Flüssigkeiten suspendierten Teilchen. Annalen der Physik, 17: , E.M. Purcell, H.C. Torrey, and R.V. Pound. Resonance absorption by nuclear magnetic moments in a solid. Physical Review, 69:37 43, F. Bloc. Nuclear induction. Physical Review, 70: , E.L. Hahn. Spin echoes. Physical Review, 80: , P.C. Lauterbur. Image formation by induced local interactions: examples employing nuclear magnetic resonance. Nature, 242: , G.J. Stanisz and R.M. Henkelman. Tissue compartments, exchange and diffusion. In Workshop on Diffusion MRI: Biophysical Issues, pages 34 37, P.T. Callaghan. Principles of Nuclear Magnetic Resonance Microscopy. Oxford, P.J. Basser, J. Mattiello, and D. LeBihan. Estimation of the effective selfdiffusion tensor from the NMR spin echo. MR Journal, 103(3):247 54, D. LeBihan. Molecular diffusion nuclear magnetic resonance imaging. Magn. Reson. Quant., 17:1 30, D.F. Scollan, A. Holmes, R. Winslow, and J. Forder. Histological validation of myocardial microstructure obtained from diffusion tensor magnetic resonance imaging. Am J Physiol, 275: , E.W. Hsu, A.L. Muzikant, S.A. Matulevicius, R.C. Penland, and C.S. Henriquez. Magnetic resonance myocardial fiber-orientation mapping with direct histological correlation. Am J Physiol, 274: , J.K. Jones. Determining and visualizing uncertainty in estimates of fiber orientation from diffusion tensor MRI. MR in Medicine, 49:7 12, Y. Assaf, A. Mayk, and Y. Cohen. Displacement imaging of spinal cord using q-space diffusion-weighted MRI. MR in Medicine, 44: , D.S. Tuch, T.G. Reese, M.R. Wiegell, N. Makris, J.W. Belliveau, and V.J. Wedeen. High angular resolution diffusion imaging reveals intravoxel white matter fiber heterogeneity. MR in Medicine, 48(4): , L.R. Frank. Characterization of anisotropy in high angular resolution diffusionweighted MRI. MR in Medicine, 47: , C. Pierpaoli and P.J. Basser. Toward a quantitative assessment of diffusion anisotropy. MR in Medicine, 36(6): , 1996.
29 Visualization and Applications of DTI P.J. Basser and C. Pierpaoli. Microstructural features measured using diffusion tensor imaging. MR Journal, pages , C.F. Westin, S. Peled, H. Gubjartsson, R. Kikinis, and F.A. Jolesz. Geometrical diffusion measures for MRI from tensor basis analysis. In ISMRM, Conf. Proc., page 1742, April P. van Gelderen, M.H. de Vleeschouwer, D. Despres, J. Pekar, P.C. van Zijl, and C.T. Moonen. Water diffusion and acute stroke. MR in Medicine, 31:154 63, P. Douek, R. Turner, J. Pekar, N. Patronas, and D. LeBihan. MR color mapping of myelin fiber orientation. J. Comput. Assist. Tomogr, 15: , G. Kindlmann, D. Weinstein, and D.A. Hart. Strategies for direct volume rendering of diffusion tensor fields. IEEE Trans. on Visualization and Computer Graphics, 6(2): , R.A. Drebin, L. Carpenter, and P. Hanrahan. Volume rendering. Computer Graphics, SIGGRAPH Proc., 22(4):65 74, M. Levoy. Display of surfaces from volume data. IEEE Computer Graphics & Applications, 8(5):29 37, W.E. Lorensen and H.E. Cline. Marching cubes: a high resolution 3D surface reconstruction algorithm. Computer Graphics, SIGGRAPH Proc., 21(4): , A. Wenger, D. Keefe, S. Zhang, and D.H. Laidlaw. Interactive volume rendering of thin thread structures within multivalued scientific datasets. IEEE Trans. on Visualization and Computer Graphics, In press. 29. B. Cabral, N. Cam, and J. Foran. Accelerated volume rendering and tomographic reconstruction using texture mapping hardware. In Symposium on Volume Visualization, Conf. Proc., pages 91 98, J. Kniss, G. Kindlmann, and C. Hansen. Interactive volume rendering using multi-dimensional transfer functions and direct manipulation widgets. In IEEE Visualization, Conf. Proc., pages , October R. Fernando, editor. GPU Gems: Programming Techniques, Tips, and Trick for Real-Time Graphics. Addison-Wesley, D.H. Laidlaw, E.T. Ahrens, D. Kremers, M.J. Avalos, C. Readhead, and R.E. Jacobs. Visualizing diffusion tensor images of the mouse spinal cord. In IEEE Visualization, Conf. Proc., pages , October G. Kindlmann. Superquadric tensor glyphs. In Proceedings IEEE TVCG/EG Symposium on Visualization 2004, pages , May F. Post, B. Vrolijk, H. Hauser, R.S. Laramee, and H. Doleisch. Feature extraction and visualization of flow fields. In State-of-the-Art EG, Conf. Proc., pages , J.J. van Wijk. Image based flow visualization. Computer Graphics, SIGGRAPH Proc., 21(3): , S. Mori and P.C.M. van Zijl. Fiber tracking: principles and strategies a technical review. NMR in Biomedicine, 15(7-8): , P.J. Basser, S. Pajevic, C. Pierpaoli, J. Duda, and A. Aldroubi. In vivo fiber tractography using DT-MRI data. MR in Medicine, 44: , A. Vilanova, G. Berenschot, and C. van Pul. DTI visualization with streamsurfaces and evenly-spaced volume seeding. In VisSym 04 Joint EG IEEE TCVG Symposium on Visualization, Conf. Proc., pages , T. Delmarcelle and L Hesselink. Visualizing second order-tensor fields with hyperstreamlines. IEEE Computer Graphics & Applications, 13(4):25 33, 1993.
30 30 Vilanova, Zhang, Kindlmann, Laidlaw 40. S. Zhang, C. Demiralp, and D.H. Laidlaw. Visualizing diffusion tensor MR images using streamtubes and streamsurfaces. IEEE Trans. on Visualization and Computer Graphics, 9(4): , D. Weinstein, G. Kindlmann, and E.C. Lundberg. Tensorlines: advectiondiffusion based propagation through diffusion tensor fields. In IEEE Visualization, Conf. Proc., pages , L. Zhukov and A.H. Barr. Oriented tensor reconstruction: tracing neural pathways from diffusion tensor MRI. In IEEE Visualization, Conf. Proc., pages , B. Jobard and W. Lefer. Creating evenly-spaced streamlines of arbitrary density. In Visualization in Scientific Computing. Proc. of the EG Workshop, pages Springer Verlag, Z. Ding, J.C. Gore, and A.A. Anderson. Classification and quantification of neuronal fiber pathways using diffusion tensor MRI. MR in Medicine, 49(4): , A. Brun, H-J. Park, H. Knutsson, and C.-F. Westin. Coloring of DT-MRI fiber traces using Laplacian eigenmaps. In EUROCAST, Conf. Proc., volume 2809 of LNCS, February S. Zhang and D.H. Laidlaw. Hierarchical clustering of streamtubes. Technical Report CS-02-18, Brown University Computer Science Dep., August I. Corouge, G. Gerig, and S. Gouttard. Towards a shape model of white matter fiber bundles using diffusion tensor MRI. In IEEE International Symposium on Biomedical Imaging, Conf. Proc., pages , G.J.M. Parker, C.A. Wheeker-Kingshott, and G.J Barker. Distributed anatomical connectivity derived from diffusion tensor imaging. IPMI, LNCS, 2082: , A. Brun, M. Björnemo, R. Kikinis, and C.-F. Westin. White matter tractography using sequential importance sampling. In ISMRM, Conf. Proc., May P.G. Batchelor, D.L.G. Hill, F. Calamante, and D. Atkinson. Study of connectivity in the brain using the full diffusion tensor from MRI. In IPMI, Conf. Proc., pages , L. O Donnell, S. Haker, and C.F. Westing. New approaches to estimation of white matter connectivity in diffusion tensor MRI: Elliptic PDE s and geodesics in tensor-warped space. In MICCAI, Conf. Proc., pages , X. Zheng and A. Pang. Volume deformation for tensor visualization. In IEEE Visualization, Conf. Proc., pages , A. Sigfridsson, T. Ebbers, E. Heiberg, and L. Wigström. Tensor field visualisation using adaptive filtering of noise fields combined with glyph rendering. In IEEE Visualization, Conf. Proc., pages , X. Zheng and A. Pang. Hyperlic. In IEEE Visualization, Conf. Proc., pages , L. Hesselink, Y. Levy, and Y. Lavin. The topology of symmetric, second-order 3D tensor fields:. IEEE Trans. on Visualization and Computer Graphics, 3(1):1 11, D. Akers, A. Sherbondy, R. Mackenzie, R. Dougherty, and B. Wandell. Exploration of the brain s white matter pathways with dynamic queries. In IEEE Visualization, Conf. Proc., October Ç. Demiralp, D.H. Laidlaw, C. Jackson, D. Keefe, and S. Zhang. Subjective usefulness of CAVE and fishtank VR display systems for a scientific visualization application. In IEEE Visualization Poster Compendium, 2003.
31 Visualization and Applications of DTI S. Zhang, Ç. Demiralp, D. Keefe, M. DaSilva, B.D. Greenberg, P.J. Basser, C. Pierpaoli, E.A. Chiocca, T.S. Deisboeck, and D.H. Laidlaw. An immersive virtual environment for DT-MRI volume visualization applications: a case study. In IEEE Visualization, Conf. Proc., pages , October R. Westerhausen, C. Walter, F. Kreuder, R.A. Wittling, E. Schweiger, and W. Wittling. The influence of handedness and gender on the microstructure of the human corpus callosum: a diffusion-tensor magnetic resonance imaging study. Neuroscience Letters, 351:99 102, A. Pfefferbaum, E.V. Sullivan, M. Hedehus, K.O. Lim, E. Adalsteinsson, and M. Moseley. Age-related decline in brain white matter anisotropy measured with spatially corrected echo-planar diffusion tensor imaging. MR in Medicine, 44(2): , M. O Sullivan, D.K. Jones, P.E. Summers, R.G. Morris, S.C.R. Williams, and H.S. Markus. Evidence for cortical disconnection as a mechanism of age-related cognitive decline. Neurology, 57: , M. Catani, D.K. Jones, R. Donato, and D.H. Ffytche. Occipito-temporal connections in the human brain. Brain, 126: , S. Wakana, H. Jiang, L.M. Nagae-Poetscher, P.C.M. van Zijl, and S. Mori. Fiber tract based atlas of human white matter anatomy. Radiology, 230:77 87, D.-S. Kim, M. Kima, I. Ronena, E. Formisanob, K.-H. Kima, K. Ugurbila, S. Moric, and R. Goebelb. In vivo mapping of functional domains and axonal connectivity in cat visual cortex using magnetic resonance imaging. MRI Journal, 21(10): , J.J. Volpe. Neurology of the Newborn. W.B. Saunders Company, K.O. Lim and J.A. Helpern. Neuropsychiatric applications of DTI a review. NMR in Biomedicine, 15(7-8): , M.A. Horsfield and D.K. Jones. Applications of diffusion-weighted and diffusion tensor MRI to white matter diseases a review. NMRinBiomedicine, 15(7-8): , M. Kubicki, C.-F. Westin, S.E. Maier, H. Mamata, M. Frumin, H. Ersner- Hershfield, R. Kikinis, F.A. Jolesz, R. McCarley, and M.E. Shenton. Diffusion tensor imaging and its application to neuropsychiatric disorders. Harvard Rev. of Psychiatry, 10: , P.C. Sundgren, Q. Dong, D. Gomez-Hassan, S.K. Mukherji, P. Maly, and R. Welsh. Diffusion tensor imaging of the brain: review of clinical applications. Neuroradiology, 46(5): , N.I. Bohnen, K. Radharkrishnan, B.P. O Neil, and L.T. Kurland. Descriptive and Analytic Epidemiology of Brain Tumours. Cancer of the Nervous System. Blackwell Publishing, U.C. Wieshmann, M.R. Symms, G.J. Parker, C.A. Clark, L. Lemieux, G.J. Barker, and S.D. Shorvon. Diffusion tensor imaging demonstrates deviation of fibres in normal appearing white matter adjacent to a brain tumour. J. Neurol. Neurosurg. Psychiatry, 68(4):501 3, S. Mori, K. Frederiksen, P.C. van Zijl, B. Stieltjes, M.A. Kraut, M. Solaiyappa, and M.G. Pomper. Brain white matter anatomy of tumor patients evaluated with diffusion tensor imaging. Ann. Neurol., 51(3):337 8, C. Gossl, L. Fahrmeir, B. Putz, L.M. Auer, and D.P. Auer. Fiber tracking from DTI using linear state space models: detectability of the pyramidal tract. Neuroimage, 16(2):378 88, 2002.
32 32 Vilanova, Zhang, Kindlmann, Laidlaw 74. B.P. Witwer, R. Moftakhar, K.M. Hasan, P. Deshmukh, V. Haughton, A. Field, K. Arfanakis, J. Noyes, C.H. Moritz, M.E. Meyerand, H.A. Rowley, A.L. Alexander, and B. Badie. Diffusion-tensor imaging of white matter tracts in patients with cerebral neoplasm. J. Neurosurg., 97(3):568 75, S. Zhang, M.E. Bastin, D.H. Laidlaw, S. Sinha, P.A. Armitage, and T.S. Deisboeck. Visualization and analysis of white matter structural asymmetry in diffusion tensor MR imaging data. MR in Medicine, 51(1): , D.J. Werring, C.A. Clark, G.J. Barker, A.J. Thompson, and D.H. Miller. Diffusion tensor imaging of lesions and normal-appearing white matter in multiple sclerosis. Neurology, 52: , R.H. Paul, R. Cohen, and R. Stern. Neurocognitive manifestations of HIV. CNS Spectrums, 7(12): , R.H. Paul, R. Cohen, B. Navia, and K. Tashima. Relationships between cognition and structural neuroimaging findings in adults with human immunodeficiency virus type-1. Neurosci Biobehav Rev, 26(3):353 9, N. Pomara, D.T. Crandall, S.J. Choi, G. Johnson, and K.O. Lim. White matter abnormalities in HIV-1 infection: a diffusion tensor imaging study. Psychiatry Res, 106(1):15 24, C.G. Filippi, A.M. Ulug, E. Ryan, S.J. Ferrando, and W. van Gorp. Diffusion tensor imaging of patients with HIV and normal-appearing white matter on MR images of the brain. American Journal of Neuroradiology, 22: , A. B. Ragin, P. Storey, B. A. Cohen, L. G. Epstein, and R. R. Edelman. Whole brain diffusion tensor imaging in HIV-associated cognitive impairment. American Journal of Neuroradiology, 25(2): , F.B. Sachse. Computational Cardiology: Modeling of Anatomy, Electrophysiology, and Mechanics. LNCS Vol Springer Verlag, D.B. Ennis, G. Kindlmann, P.A. Helm, I. Rodriguez, H. Wen, and E.R. McVeigh. Visualization of high-resolution myocardial strain and diffusion tensors using superquadric glyphs. In ISMRM, Conf. Proc., May 2004.
 Principal eigenvector Fig. 5. (b) Linear versus planar Fig.")
33 Visualization and Applications of DTI 33 (a) MD (b) FA (c) c l -c p Fig. 3. (a) Principal eigenvector Fig. 5. (b) Linear versus planar Fig. 6.

")
 (a) Boxes")
")

34 34 Vilanova, Zhang, Kindlmann, Laidlaw (a) Fig. 7. (b) (a) Boxes (b) Ellipsoids (c) Superquadrics Fig. 9. (a) axial slice (b) sagital slice Fig. 10.
35 Visualization and Applications of DTI 35 (a) (b) Fig. 11. Seed Points (a) (b) Fig. 13. (a) Fig. 14. (b)

36 36 Vilanova, Zhang, Kindlmann, Laidlaw a) b) Fig. 15. Cl=1 (a) Cp=1 (b) Cs=1 Fig. 16. (a) (b) Fig. 17.
37 Visualization and Applications of DTI 37 (a) (b) (c) Fig. 18.
8. Tensor Field Visualization
 8. Tensor Field Visualization Tensor: extension of concept of scalar and vector Tensor data for a tensor of level k is given by t i1,i2,,ik (x 1,,x n ) Second-order tensor often represented by matrix Examples:
HST.583 Functional Magnetic Resonance Imaging: Data Acquisition and Analysis Fall 2008
 MIT OpenCourseWare http://ocw.mit.edu HST.583 Functional Magnetic Resonance Imaging: Data Acquisition and Analysis Fall 2008 For information about citing these materials or our Terms of Use, visit: http://ocw.mit.edu/terms.
Fiber Selection from Diffusion Tensor Data based on Boolean Operators
 Fiber Selection from Diffusion Tensor Data based on Boolean Operators D. Merhof 1, G. Greiner 2, M. Buchfelder 3, C. Nimsky 4 1 Visual Computing, University of Konstanz, Konstanz, Germany 2 Computer Graphics
Evaluation of Local Filter Approaches for Diffusion Tensor based Fiber Tracking
 Evaluation of Local Filter Approaches for Diffusion Tensor based Fiber Tracking D. Merhof 1, M. Buchfelder 2, C. Nimsky 3 1 Visual Computing, University of Konstanz, Konstanz 2 Department of Neurosurgery,
Saturn User Manual. Rubén Cárdenes. 29th January 2010 Image Processing Laboratory, University of Valladolid. Abstract
 Saturn User Manual Rubén Cárdenes 29th January 2010 Image Processing Laboratory, University of Valladolid Abstract Saturn is a software package for DTI processing and visualization, provided with a graphic
Complex Fiber Visualization
 Annales Mathematicae et Informaticae 34 (2007) pp. 103 109 http://www.ektf.hu/tanszek/matematika/ami Complex Fiber Visualization Henrietta Tomán a, Róbert Tornai b, Marianna Zichar c a Department of Computer
Technische Universiteit Eindhoven Department of Mathematics and Computer Science. Master s Thesis HIERARCHICAL VISUALIZATION USING FIBER CLUSTERING
 Technische Universiteit Eindhoven Department of Mathematics and Computer Science Master s Thesis HIERARCHICAL VISUALIZATION USING FIBER CLUSTERING by Ing. B. Moberts Supervisors: Dr. A. Vilanova Prof.dr.ir.
Automatic Quantification of DTI Parameters along Fiber Bundles
 Automatic Quantification of DTI Parameters along Fiber Bundles Jan Klein 1, Simon Hermann 1, Olaf Konrad 1, Horst K. Hahn 1, and Heinz-Otto Peitgen 1 1 MeVis Research, 28359 Bremen Email: klein@mevis.de
Diffusion model fitting and tractography: A primer
 Diffusion model fitting and tractography: A primer Anastasia Yendiki HMS/MGH/MIT Athinoula A. Martinos Center for Biomedical Imaging 03/18/10 Why n how Diffusion model fitting and tractography 0/18 Why
Diffusion Imaging Visualization
 Diffusion Imaging Visualization Thomas Schultz URL: http://cg.cs.uni-bonn.de/schultz/ E-Mail: schultz@cs.uni-bonn.de 1 Outline Introduction to Diffusion Imaging Basic techniques Glyph-based Visualization
Generation of Hulls Encompassing Neuronal Pathways Based on Tetrahedralization and 3D Alpha Shapes
 Generation of Hulls Encompassing Neuronal Pathways Based on Tetrahedralization and 3D Alpha Shapes Dorit Merhof 1,2, Martin Meister 1, Ezgi Bingöl 1, Peter Hastreiter 1,2, Christopher Nimsky 2,3, Günther
Automatic Quantification of DTI Parameters along Fiber Bundles
 Automatic Quantification of DTI Parameters along Fiber Bundles Jan Klein, Simon Hermann, Olaf Konrad, Horst K. Hahn, Heinz-Otto Peitgen MeVis Research, 28359 Bremen Email: klein@mevis.de Abstract. We introduce
Diffusion Tensor Imaging and Reading Development
 Diffusion Tensor Imaging and Reading Development Bob Dougherty Stanford Institute for Reading and Learning Reading and Anatomy Every brain is different... Not all brains optimized for highly proficient
The Application of GPU Particle Tracing to Diffusion Tensor Field Visualization
 The Application of GPU Particle Tracing to Diffusion Tensor Field Visualization Polina Kondratieva, Jens Krüger, Rüdiger Westermann Computer Graphics and Visualization Group Technische Universität München
Vector Visualization
 Vector Visualization Vector Visulization Divergence and Vorticity Vector Glyphs Vector Color Coding Displacement Plots Stream Objects Texture-Based Vector Visualization Simplified Representation of Vector
HST.583 Functional Magnetic Resonance Imaging: Data Acquisition and Analysis Fall 2008
 MIT OpenCourseWare http://ocw.mit.edu HST.583 Functional Magnetic Resonance Imaging: Data Acquisition and Analysis Fall 2008 For information about citing these materials or our Terms of Use, visit: http://ocw.mit.edu/terms.
Chapter 4. Clustering Core Atoms by Location
 Chapter 4. Clustering Core Atoms by Location In this chapter, a process for sampling core atoms in space is developed, so that the analytic techniques in section 3C can be applied to local collections
NEURO M203 & BIOMED M263 WINTER 2014
 NEURO M203 & BIOMED M263 WINTER 2014 MRI Lab 2: Neuroimaging Connectivity Lab In today s lab we will work with sample diffusion imaging data and the group averaged fmri data collected during your scanning
Quantitative MRI of the Brain: Investigation of Cerebral Gray and White Matter Diseases
 Quantities Measured by MR - Quantitative MRI of the Brain: Investigation of Cerebral Gray and White Matter Diseases Static parameters (influenced by molecular environment): T, T* (transverse relaxation)
Fiber Selection from Diffusion Tensor Data based on Boolean Operators
 Fiber Selection from Diffusion Tensor Data based on Boolean Operators D. Merhofl, G. Greiner 2, M. Buchfelder 3, C. Nimsky4 1 Visual Computing, University of Konstanz, Konstanz, Germany 2 Computer Graphics
FROM IMAGE RECONSTRUCTION TO CONNECTIVITY ANALYSIS: A JOURNEY THROUGH THE BRAIN'S WIRING. Francesca Pizzorni Ferrarese
 FROM IMAGE RECONSTRUCTION TO CONNECTIVITY ANALYSIS: A JOURNEY THROUGH THE BRAIN'S WIRING Francesca Pizzorni Ferrarese Pipeline overview WM and GM Segmentation Registration Data reconstruction Tractography
DIFFUSION TENSOR IMAGING ANALYSIS. Using Analyze
 DIFFUSION TENSOR IMAGING ANALYSIS Using Analyze 2 Table of Contents 1. Introduction page 3 2. Loading DTI Data page 4 3. Computing DTI Maps page 5 4. Defining ROIs for Fiber Tracking page 6 5. Visualizing
A Generic Lie Group Model for Computer Vision
 A Generic Lie Group Model for Computer Vision Within this research track we follow a generic Lie group approach to computer vision based on recent physiological research on how the primary visual cortex
ECE1778 Final Report MRI Visualizer
 ECE1778 Final Report MRI Visualizer David Qixiang Chen Alex Rodionov Word Count: 2408 Introduction We aim to develop a mobile phone/tablet based neurosurgical MRI visualization application with the goal
Scientific Visualization Example exam questions with commented answers
 Scientific Visualization Example exam questions with commented answers The theoretical part of this course is evaluated by means of a multiple- choice exam. The questions cover the material mentioned during
3D vector fields. Contents. Introduction 3D vector field topology Representation of particle lines. 3D LIC Combining different techniques
 3D vector fields Scientific Visualization (Part 9) PD Dr.-Ing. Peter Hastreiter Contents Introduction 3D vector field topology Representation of particle lines Path lines Ribbons Balls Tubes Stream tetrahedra
Structural connectivity of the brain measured by diffusion tensor imaging [DTI]
![Structural connectivity of the brain measured by diffusion tensor imaging [DTI]](/thumbs/74/71065400.jpg "Structural connectivity of the brain measured by diffusion tensor imaging [DTI]") Structural connectivity of the brain measured by diffusion tensor imaging [DTI] Lars T. Westlye CSHC / Centre for Advanced Study PSY4320 06.05.2012 l.t.westlye@psykologi.uio.no ~ 40 % of the brain is white
Structural connectivity of the brain measured by diffusion tensor imaging [DTI] Lars T. Westlye CSHC / Centre for Advanced Study PSY4320 06.05.2012 l.t.westlye@psykologi.uio.no ~ 40 % of the brain is white
Computational Medical Imaging Analysis Chapter 4: Image Visualization
 Computational Medical Imaging Analysis Chapter 4: Image Visualization Jun Zhang Laboratory for Computational Medical Imaging & Data Analysis Department of Computer Science University of Kentucky Lexington,
Advanced Visual Medicine: Techniques for Visual Exploration & Analysis
 Advanced Visual Medicine: Techniques for Visual Exploration & Analysis Interactive Visualization of Multimodal Volume Data for Neurosurgical Planning Felix Ritter, MeVis Research Bremen Multimodal Neurosurgical
The organization of the human cerebral cortex estimated by intrinsic functional connectivity
 1 The organization of the human cerebral cortex estimated by intrinsic functional connectivity Journal: Journal of Neurophysiology Author: B. T. Thomas Yeo, et al Link: https://www.ncbi.nlm.nih.gov/pubmed/21653723
syngo.mr Neuro 3D: Your All-In-One Post Processing, Visualization and Reporting Engine for BOLD Functional and Diffusion Tensor MR Imaging Datasets
 syngo.mr Neuro 3D: Your All-In-One Post Processing, Visualization and Reporting Engine for BOLD Functional and Diffusion Tensor MR Imaging Datasets Julien Gervais; Lisa Chuah Siemens Healthcare, Magnetic
Analysis of Functional MRI Timeseries Data Using Signal Processing Techniques
 Analysis of Functional MRI Timeseries Data Using Signal Processing Techniques Sea Chen Department of Biomedical Engineering Advisors: Dr. Charles A. Bouman and Dr. Mark J. Lowe S. Chen Final Exam October
Mirrored LH Histograms for the Visualization of Material Boundaries
 Mirrored LH Histograms for the Visualization of Material Boundaries Petr Šereda 1, Anna Vilanova 1 and Frans A. Gerritsen 1,2 1 Department of Biomedical Engineering, Technische Universiteit Eindhoven,
Visualization. Images are used to aid in understanding of data. Height Fields and Contours Scalar Fields Volume Rendering Vector Fields [chapter 26]
![Visualization. Images are used to aid in understanding of data. Height Fields and Contours Scalar Fields Volume Rendering Vector Fields [chapter 26]](/thumbs/74/70771954.jpg "Visualization. Images are used to aid in understanding of data. Height Fields and Contours Scalar Fields Volume Rendering Vector Fields [chapter 26]") Visualization Images are used to aid in understanding of data Height Fields and Contours Scalar Fields Volume Rendering Vector Fields [chapter 26] Tumor SCI, Utah Scientific Visualization Visualize large
Visualization Images are used to aid in understanding of data Height Fields and Contours Scalar Fields Volume Rendering Vector Fields [chapter 26] Tumor SCI, Utah Scientific Visualization Visualize large
Vector Visualization. CSC 7443: Scientific Information Visualization
 Vector Visualization Vector data A vector is an object with direction and length v = (v x,v y,v z ) A vector field is a field which associates a vector with each point in space The vector data is 3D representation
CHAPTER 2. Morphometry on rodent brains. A.E.H. Scheenstra J. Dijkstra L. van der Weerd
 CHAPTER 2 Morphometry on rodent brains A.E.H. Scheenstra J. Dijkstra L. van der Weerd This chapter was adapted from: Volumetry and other quantitative measurements to assess the rodent brain, In vivo NMR
The Anatomical Equivalence Class Formulation and its Application to Shape-based Computational Neuroanatomy
 The Anatomical Equivalence Class Formulation and its Application to Shape-based Computational Neuroanatomy Sokratis K. Makrogiannis, PhD From post-doctoral research at SBIA lab, Department of Radiology,
Data Representation in Visualisation
 Data Representation in Visualisation Visualisation Lecture 4 Taku Komura Institute for Perception, Action & Behaviour School of Informatics Taku Komura Data Representation 1 Data Representation We have
MITK-DI. A new Diffusion Imaging Component for MITK. Klaus Fritzsche, Hans-Peter Meinzer
 MITK-DI A new Diffusion Imaging Component for MITK Klaus Fritzsche, Hans-Peter Meinzer Division of Medical and Biological Informatics, DKFZ Heidelberg k.fritzsche@dkfz-heidelberg.de Abstract. Diffusion-MRI
Whole Body MRI Intensity Standardization
 Whole Body MRI Intensity Standardization Florian Jäger 1, László Nyúl 1, Bernd Frericks 2, Frank Wacker 2 and Joachim Hornegger 1 1 Institute of Pattern Recognition, University of Erlangen, {jaeger,nyul,hornegger}@informatik.uni-erlangen.de
A Study of Medical Image Analysis System
 Indian Journal of Science and Technology, Vol 8(25), DOI: 10.17485/ijst/2015/v8i25/80492, October 2015 ISSN (Print) : 0974-6846 ISSN (Online) : 0974-5645 A Study of Medical Image Analysis System Kim Tae-Eun
n o r d i c B r a i n E x Tutorial DTI Module
 m a k i n g f u n c t i o n a l M R I e a s y n o r d i c B r a i n E x Tutorial DTI Module Please note that this tutorial is for the latest released nordicbrainex. If you are using an older version please
Atelier 2 : Calcul Haute Performance et Sciences du Vivant Forum er juillet, Paris, France
 From Diffusion MR Image Analysis to Whole Brain Connectivity Simulation Jean-Philippe Thiran EPFL Lausanne, Switzerland EPFL - Lausanne HPC in life sciences at EPFL The Blue Brain project: create a biologically
This exercise uses one anatomical data set (ANAT1) and two functional data sets (FUNC1 and FUNC2).
 and two functional data sets (FUNC1 and FUNC2).") Exploring Brain Anatomy This week s exercises will let you explore the anatomical organization of the brain to learn some of its basic properties, as well as the location of different structures. The human
Exploring Brain Anatomy This week s exercises will let you explore the anatomical organization of the brain to learn some of its basic properties, as well as the location of different structures. The human
Volume Illumination & Vector Field Visualisation
 Volume Illumination & Vector Field Visualisation Visualisation Lecture 11 Institute for Perception, Action & Behaviour School of Informatics Volume Illumination & Vector Vis. 1 Previously : Volume Rendering
Flow Visualisation - Background. CITS4241 Visualisation Lectures 20 and 21
 CITS4241 Visualisation Lectures 20 and 21 Flow Visualisation Flow visualisation is important in both science and engineering From a "theoretical" study of o turbulence or o a fusion reactor plasma, to
Network connectivity via inference over curvature-regularizing line graphs
 Network connectivity via inference over curvature-regularizing line graphs Asian Conference on Computer Vision Maxwell D. Collins 1,2, Vikas Singh 2,1, Andrew L. Alexander 3 1 Department of Computer Sciences
Scalar Visualization
 Scalar Visualization Visualizing scalar data Popular scalar visualization techniques Color mapping Contouring Height plots outline Recap of Chap 4: Visualization Pipeline 1. Data Importing 2. Data Filtering
Using surface markings to enhance accuracy and stability of object perception in graphic displays
 Using surface markings to enhance accuracy and stability of object perception in graphic displays Roger A. Browse a,b, James C. Rodger a, and Robert A. Adderley a a Department of Computing and Information
Automatic MS Lesion Segmentation by Outlier Detection and Information Theoretic Region Partitioning Release 0.00
 Automatic MS Lesion Segmentation by Outlier Detection and Information Theoretic Region Partitioning Release 0.00 Marcel Prastawa 1 and Guido Gerig 1 Abstract July 17, 2008 1 Scientific Computing and Imaging
coding of various parts showing different features, the possibility of rotation or of hiding covering parts of the object's surface to gain an insight
 Three-Dimensional Object Reconstruction from Layered Spatial Data Michael Dangl and Robert Sablatnig Vienna University of Technology, Institute of Computer Aided Automation, Pattern Recognition and Image
CIS 467/602-01: Data Visualization
 CIS 467/602-01: Data Visualization Vector Field Visualization Dr. David Koop Fields Tables Networks & Trees Fields Geometry Clusters, Sets, Lists Items Items (nodes) Grids Items Items Attributes Links
Learning-based Neuroimage Registration
 Learning-based Neuroimage Registration Leonid Teverovskiy and Yanxi Liu 1 October 2004 CMU-CALD-04-108, CMU-RI-TR-04-59 School of Computer Science Carnegie Mellon University Pittsburgh, PA 15213 Abstract
MR IMAGE SEGMENTATION
 MR IMAGE SEGMENTATION Prepared by : Monil Shah What is Segmentation? Partitioning a region or regions of interest in images such that each region corresponds to one or more anatomic structures Classification
Norbert Schuff VA Medical Center and UCSF
 Norbert Schuff Medical Center and UCSF Norbert.schuff@ucsf.edu Medical Imaging Informatics N.Schuff Course # 170.03 Slide 1/67 Objective Learn the principle segmentation techniques Understand the role
Blood Particle Trajectories in Phase-Contrast-MRI as Minimal Paths Computed with Anisotropic Fast Marching
 Blood Particle Trajectories in Phase-Contrast-MRI as Minimal Paths Computed with Anisotropic Fast Marching Michael Schwenke 1, Anja Hennemuth 1, Bernd Fischer 2, Ola Friman 1 1 Fraunhofer MEVIS, Institute
Prof. Fanny Ficuciello Robotics for Bioengineering Visual Servoing
 Visual servoing vision allows a robotic system to obtain geometrical and qualitative information on the surrounding environment high level control motion planning (look-and-move visual grasping) low level
Effect of age and dementia on topology of brain functional networks. Paul McCarthy, Luba Benuskova, Liz Franz University of Otago, New Zealand
 Effect of age and dementia on topology of brain functional networks Paul McCarthy, Luba Benuskova, Liz Franz University of Otago, New Zealand 1 Structural changes in aging brain Age-related changes in
3D Surface Reconstruction of the Brain based on Level Set Method
 3D Surface Reconstruction of the Brain based on Level Set Method Shijun Tang, Bill P. Buckles, and Kamesh Namuduri Department of Computer Science & Engineering Department of Electrical Engineering University
Introduction to Medical Image Processing
 Introduction to Medical Image Processing Δ Essential environments of a medical imaging system Subject Image Analysis Energy Imaging System Images Image Processing Feature Images Image processing may be
Automatic segmentation of the cortical grey and white matter in MRI using a Region Growing approach based on anatomical knowledge
 Automatic segmentation of the cortical grey and white matter in MRI using a Region Growing approach based on anatomical knowledge Christian Wasserthal 1, Karin Engel 1, Karsten Rink 1 und André Brechmann
CS/NEUR125 Brains, Minds, and Machines. Due: Wednesday, April 5
 CS/NEUR125 Brains, Minds, and Machines Lab 8: Using fmri to Discover Language Areas in the Brain Due: Wednesday, April 5 In this lab, you will analyze fmri data from an experiment that was designed to
Lecture overview. Visualisatie BMT. Vector algorithms. Vector algorithms. Time animation. Time animation
 Visualisatie BMT Lecture overview Vector algorithms Tensor algorithms Modeling algorithms Algorithms - 2 Arjan Kok a.j.f.kok@tue.nl 1 2 Vector algorithms Vector 2 or 3 dimensional representation of direction
Data Visualization (CIS/DSC 468)
") Data Visualization (CIS/DSC 468) Vector Visualization Dr. David Koop Visualizing Volume (3D) Data 2D visualization slice images (or multi-planar reformating MPR) Indirect 3D visualization isosurfaces (or
Data Visualization (CIS/DSC 468) Vector Visualization Dr. David Koop Visualizing Volume (3D) Data 2D visualization slice images (or multi-planar reformating MPR) Indirect 3D visualization isosurfaces (or
Strategies for Direct Volume Rendering of Diffusion Tensor Fields
 Strategies for Direct Volume Rendering of Diffusion Tensor Fields Gordon Kindlmann, David Weinstein, David Hart Scientific Computing and Imaging Department of Computer Science, University of Utah {gk dmw
Course Review. Computer Animation and Visualisation. Taku Komura
 Course Review Computer Animation and Visualisation Taku Komura Characters include Human models Virtual characters Animal models Representation of postures The body has a hierarchical structure Many types
CIS 467/602-01: Data Visualization
 CIS 467/60-01: Data Visualization Isosurfacing and Volume Rendering Dr. David Koop Fields and Grids Fields: values come from a continuous domain, infinitely many values - Sampled at certain positions to
Multimodal Visualization of DTI and fmri Data using Illustrative Methods
 Multimodal Visualization of DTI and fmri Data using Illustrative Methods Silvia Born 1, Werner Jainek 1, Mario Hlawitschka 2, Gerik Scheuermann 3, Christos Trantakis 4, Jürgen Meixensberger 4, Dirk Bartz
Lilla Zöllei A.A. Martinos Center, MGH; Boston, MA
 Lilla Zöllei lzollei@nmr.mgh.harvard.edu A.A. Martinos Center, MGH; Boston, MA Bruce Fischl Gheorghe Postelnicu Jean Augustinack Anastasia Yendiki Allison Stevens Kristen Huber Sita Kakonoori + the FreeSurfer
Chapter 9 Conclusions
 Chapter 9 Conclusions This dissertation has described a new method for using local medial properties of shape to identify and measure anatomical structures. A bottom up approach based on image properties
Measuring longitudinal brain changes in humans and small animal models. Christos Davatzikos
 Measuring longitudinal brain changes in humans and small animal models Christos Davatzikos Section of Biomedical Image Analysis University of Pennsylvania (Radiology) http://www.rad.upenn.edu/sbia Computational
Generating Fiber Crossing Phantoms Out of Experimental DWIs
 Generating Fiber Crossing Phantoms Out of Experimental DWIs Matthan Caan 1,2, Anne Willem de Vries 2, Ganesh Khedoe 2,ErikAkkerman 1, Lucas van Vliet 2, Kees Grimbergen 1, and Frans Vos 1,2 1 Department
Image Acquisition Systems
 Image Acquisition Systems Goals and Terminology Conventional Radiography Axial Tomography Computer Axial Tomography (CAT) Magnetic Resonance Imaging (MRI) PET, SPECT Ultrasound Microscopy Imaging ITCS
Advanced MRI Techniques (and Applications)
") Advanced MRI Techniques (and Applications) Jeffry R. Alger, PhD Department of Neurology Ahmanson-Lovelace Brain Mapping Center Brain Research Institute Jonsson Comprehensive Cancer Center University of
Advanced MRI Techniques (and Applications) Jeffry R. Alger, PhD Department of Neurology Ahmanson-Lovelace Brain Mapping Center Brain Research Institute Jonsson Comprehensive Cancer Center University of
Data Visualization (DSC 530/CIS )
") Data Visualization (DSC 530/CIS 60-0) Isosurfaces & Volume Rendering Dr. David Koop Fields & Grids Fields: - Values come from a continuous domain, infinitely many values - Sampled at certain positions
Data Visualization (DSC 530/CIS 60-0) Isosurfaces & Volume Rendering Dr. David Koop Fields & Grids Fields: - Values come from a continuous domain, infinitely many values - Sampled at certain positions
Visualization Computer Graphics I Lecture 20
 15-462 Computer Graphics I Lecture 20 Visualization Height Fields and Contours Scalar Fields Volume Rendering Vector Fields [Angel Ch. 12] April 15, 2003 Frank Pfenning Carnegie Mellon University http://www.cs.cmu.edu/~fp/courses/graphics/
MITK-DI. A new Diffusion Imaging Component for MITK. Klaus Fritzsche, Hans-Peter Meinzer
 MITK-DI A new Diffusion Imaging Component for MITK Klaus Fritzsche, Hans-Peter Meinzer Division of Medical and Biological Informatics, DKFZ Heidelberg k.fritzsche@dkfz-heidelberg.de Abstract. Diffusion-MRI
AUTOMATED 4 AXIS ADAYfIVE SCANNING WITH THE DIGIBOTICS LASER DIGITIZER
 AUTOMATED 4 AXIS ADAYfIVE SCANNING WITH THE DIGIBOTICS LASER DIGITIZER INTRODUCTION The DIGIBOT 3D Laser Digitizer is a high performance 3D input device which combines laser ranging technology, personal
Supplementary methods
 Supplementary methods This section provides additional technical details on the sample, the applied imaging and analysis steps and methods. Structural imaging Trained radiographers placed all participants
Chapter 5. Projections and Rendering
 Chapter 5 Projections and Rendering Topics: Perspective Projections The rendering pipeline In order to view manipulate and view a graphics object we must find ways of storing it a computer-compatible way.
Understanding Diffusion. Diffusion-weighted Imaging to Diffusion Tensor Imaging and Beyond 1
 CENTRAL NERVOUS SYSTEM: STATE OF THE ART Understanding Diffusion MR Imaging Techniques: From Scalar Diffusion-weighted Imaging to Diffusion Tensor Imaging and Beyond 1 S205 TEACHING POINTS See last page
Data Visualization (DSC 530/CIS )
") Data Visualization (DSC 530/CIS 60-01) Scalar Visualization Dr. David Koop Online JavaScript Resources http://learnjsdata.com/ Good coverage of data wrangling using JavaScript Fields in Visualization Scalar
Data Visualization (DSC 530/CIS 60-01) Scalar Visualization Dr. David Koop Online JavaScript Resources http://learnjsdata.com/ Good coverage of data wrangling using JavaScript Fields in Visualization Scalar
Object Identification in Ultrasound Scans
 Object Identification in Ultrasound Scans Wits University Dec 05, 2012 Roadmap Introduction to the problem Motivation Related Work Our approach Expected Results Introduction Nowadays, imaging devices like
Shape-based Diffeomorphic Registration on Hippocampal Surfaces Using Beltrami Holomorphic Flow
 Shape-based Diffeomorphic Registration on Hippocampal Surfaces Using Beltrami Holomorphic Flow Abstract. Finding meaningful 1-1 correspondences between hippocampal (HP) surfaces is an important but difficult
Height Fields and Contours Scalar Fields Volume Rendering Vector Fields [Angel Ch. 12] April 23, 2002 Frank Pfenning Carnegie Mellon University
![Height Fields and Contours Scalar Fields Volume Rendering Vector Fields [Angel Ch. 12] April 23, 2002 Frank Pfenning Carnegie Mellon University](/thumbs/90/102611276.jpg "Height Fields and Contours Scalar Fields Volume Rendering Vector Fields [Angel Ch. 12] April 23, 2002 Frank Pfenning Carnegie Mellon University") 15-462 Computer Graphics I Lecture 21 Visualization Height Fields and Contours Scalar Fields Volume Rendering Vector Fields [Angel Ch. 12] April 23, 2002 Frank Pfenning Carnegie Mellon University http://www.cs.cmu.edu/~fp/courses/graphics/
15-462 Computer Graphics I Lecture 21 Visualization Height Fields and Contours Scalar Fields Volume Rendering Vector Fields [Angel Ch. 12] April 23, 2002 Frank Pfenning Carnegie Mellon University http://www.cs.cmu.edu/~fp/courses/graphics/
11/1/13. Visualization. Scientific Visualization. Types of Data. Height Field. Contour Curves. Meshes
 CSCI 420 Computer Graphics Lecture 26 Visualization Height Fields and Contours Scalar Fields Volume Rendering Vector Fields [Angel Ch. 2.11] Jernej Barbic University of Southern California Scientific Visualization
Visualization. CSCI 420 Computer Graphics Lecture 26
 CSCI 420 Computer Graphics Lecture 26 Visualization Height Fields and Contours Scalar Fields Volume Rendering Vector Fields [Angel Ch. 11] Jernej Barbic University of Southern California 1 Scientific Visualization
Visualization Computer Graphics I Lecture 20
 15-462 Computer Graphics I Lecture 20 Visualization Height Fields and Contours Scalar Fields Volume Rendering Vector Fields [Angel Ch. 12] November 20, 2003 Doug James Carnegie Mellon University http://www.cs.cmu.edu/~djames/15-462/fall03
Supplementary Materials for
 advances.sciencemag.org/cgi/content/full/4/1/eaao7005/dc1 Supplementary Materials for Computational discovery of extremal microstructure families The PDF file includes: Desai Chen, Mélina Skouras, Bo Zhu,
13. Learning Ballistic Movementsof a Robot Arm 212
 13. Learning Ballistic Movementsof a Robot Arm 212 13. LEARNING BALLISTIC MOVEMENTS OF A ROBOT ARM 13.1 Problem and Model Approach After a sufficiently long training phase, the network described in the
Scalar Visualization
 Scalar Visualization 5-1 Motivation Visualizing scalar data is frequently encountered in science, engineering, and medicine, but also in daily life. Recalling from earlier, scalar datasets, or scalar fields,
Chapter 6 Visualization Techniques for Vector Fields
 Chapter 6 Visualization Techniques for Vector Fields 6.1 Introduction 6.2 Vector Glyphs 6.3 Particle Advection 6.4 Streamlines 6.5 Line Integral Convolution 6.6 Vector Topology 6.7 References 2006 Burkhard
A method of visualization of a brain neural pathway by using critical points and target regions
 Modelling in Medicine and Biology VII 309 A method of visualization of a brain neural pathway by using critical points and target regions A. Doi 1, H. Fujimura 2, M. Nagano 1, T. Inoue 3 & A. Ogawa 3 1
K-Means Clustering Using Localized Histogram Analysis
 K-Means Clustering Using Localized Histogram Analysis Michael Bryson University of South Carolina, Department of Computer Science Columbia, SC brysonm@cse.sc.edu Abstract. The first step required for many
Calculating the Distance Map for Binary Sampled Data
 MITSUBISHI ELECTRIC RESEARCH LABORATORIES http://www.merl.com Calculating the Distance Map for Binary Sampled Data Sarah F. Frisken Gibson TR99-6 December 999 Abstract High quality rendering and physics-based
A Ray-based Approach for Boundary Estimation of Fiber Bundles Derived from Diffusion Tensor Imaging
 A Ray-based Approach for Boundary Estimation of Fiber Bundles Derived from Diffusion Tensor Imaging M. H. A. Bauer 1,3, S. Barbieri 2, J. Klein 2, J. Egger 1,3, D. Kuhnt 1, B. Freisleben 3, H.-K. Hahn
Direct and Comparative Visualization Techniques for HARDI Data
 Direct and Comparative Visualization Techniques for HARDI Data Rik Sonderkamp c 2010 Rik Sonderkamp Delft University of Technology Final Thesis Direct and Comparative Visualization Techniques for HARDI
Visualizing Diffusion Tensor Imaging Data with Merging Ellipsoids
 Visualizing Diffusion Tensor Imaging Data with Merging Ellipsoids Wei Chen Song Zhang Stephen Correia David F. Tate State Key Lab of CAD&CG, ZJU, China Mississippi State University Brown University Brigham
Constrained Reconstruction of Sparse Cardiac MR DTI Data
 Constrained Reconstruction of Sparse Cardiac MR DTI Data Ganesh Adluru 1,3, Edward Hsu, and Edward V.R. DiBella,3 1 Electrical and Computer Engineering department, 50 S. Central Campus Dr., MEB, University
SUMMARY: DISTINCTIVE IMAGE FEATURES FROM SCALE- INVARIANT KEYPOINTS
 SUMMARY: DISTINCTIVE IMAGE FEATURES FROM SCALE- INVARIANT KEYPOINTS Cognitive Robotics Original: David G. Lowe, 004 Summary: Coen van Leeuwen, s1460919 Abstract: This article presents a method to extract