DEM Artifacts: Layering or pancake effects
|
|
|
- Bonnie Williamson
- 5 years ago
- Views:
Transcription
1 Outcomes


2 DEM Artifacts: Stream networks & watersheds derived using ArcGIS s HYDROLOGY routines are only as good as the DEMs used. - Both DEM examples below have problems - Lidar and SRTM DEM products are free of such problems - Lidar DEMs often produces unique problems of their own Layering or pancake effects USGS 1:24,000 quad-based DEM The National Elevation Dataset (NED)
. Therefore, it is crucial to filter or extract bare earth points from LiDAR data.")
3 Lidar DEMs: Raw LiDAR data contain return signals from Human-made objects (buildings, telephone poles, and power lines) Vegetation (Trees, shrubs, grasses) Birds (Barber & Shortrudge 2004, Stoker et al. 2006). Therefore, it is crucial to filter or extract bare earth points from LiDAR data. Various filter methods have been developed to classify or separate raw LiDAR data into ground and non-ground data. None of automated filter processes is 100% accurate so far (Romano, 2004). Manual editing of the filtering results are still needed (Chen, 2007). Efforts are still needed to improve the performance of filter algorithms. Corduroy A common Lidar artifact due to vertical misalignment in scan lines. Most prominent when gridding data at a resolution that approaches the spacing of the individual scan lines.


4 Where to find NED & SRTM DEM data National Elevation Dataset (NED)
5 Where to find Lidar DEMs for IOWA ftp://ftp.igsb.uiowa.edu/gis_library/projects/lidar/lidar_blocks/lidar_las_ascii.html
6 Lidar DEMs: No best method of interpolation Deterministic Methods do not take into account a model of the spatial processes within the data IDW - Assumes each input point has a local influence that diminishes with distance - Works well for dense, evenly-distributed Lidar sample points (A.K.A. postings). - If postings are sparse or unevenly distributed results may not sufficiently represent the desired surface. - IDW s weighted averaging cannot make estimates that are outside the range of minimum & maximum sample point values - Some topographical features (e.g., ridges & valleys) are likely to be lost unless adequately sampled. SPLINE - Fits a minimum-curvature surface exactly through the measured values at the sample location. - Can estimate values that are below the minimum or above the maximum values in the sample data. - Produce smooth surfaces, but with less recognizable characteristic features like peaks, ridges and valleys (Podobnikar, 2005). Geostatistical Methods Factors in both (1) the distance & (2) the degree of SAC among samples. KRIGING - Essentially a weighted average technique, but its weights depend not only on the distances between sample points and estimation locations but also on mutual distances among sample point pairs. - Does better than IDW, especially when sample points are sparse (Zimmerman et al. 1999, Lloyd and Atkinson, 2006)
 DISADVANTAGES May be statistically inefficient Equal sampling undersampling May be hard to stay on track Rough terrain private land restrictions May introduce BIAS in measured variable Pattern may")
7 Sampling Patterns -- Systematic ADVANTAGES Fixed X, Y intervals Simplest to plan No in-field subjective judgments required Can be adapted to avoid spatial autocorrelation (range param.) DISADVANTAGES May be statistically inefficient Equal sampling undersampling May be hard to stay on track Rough terrain private land restrictions May introduce BIAS in measured variable Pattern may coincide with grid Oversampling misinterpretation
8 Sampling Patterns -- Random ADVANTAGES X & Y coords each chosen in separate random process Satisfies one assumption of linear regression each point on landscape has equal chance of being sampled Don t have to sample in any order Can reduce pt-pt travel time. DISADVANTAGES Does noting to reduce over/under sampling in areas of high variation Can complicate field crew training Seldom chosen for sampling over large areas May not be spatially independent: SAC
9 Sampling Patterns -- Cluster ADVANTAGES Can place systematically or randomly Cluster centers Point within a cluster Speeds up ground sampling time Often used in off-road natural resource surveys USFS & DNR Good for understanding SAC in the measured variable DISADVANTAGES Still prone to over/under sampling in areas of high variation Must be careful to avoid those measurements (in later analyses) that are spatially autocorrelated (SAC) Sample colinearity SLR/OLS violation
10 Sampling Patterns -- Adaptive ADVANTAGES Can be designed to avoid over/under sampling Increase sample density where feature of interest is more variable Also good for understanding SAC in the measured variable DISADVANTAGES Must be careful to avoid those measurements (in later analyses) that are spatially autocorrelated (SAC) Sample colinearity Ordinary least-squares regression GLM
11 Systematic Sample Plot Layout NW corner N E SW corner N E East Boundary E Say we want 20 sample points placed systematically within this area. There are many options, but we want 4 E-W lines (spaced from N-S) with 5 plots/line. Also, we want to stay away from the edges to avoid bias 20 meter (~1 chain). E-W distance: = 157 m 40 m buffer 117 m E-W N-S distance: = 183 m 40 m buffer 143 m N-S EW Spacing between plots on a line is 117/4 = m NS Spacing between lines is 143/3 = 47.6 m Coordinates for the first plot in the NW are: N = = E = = All plots on the same line will have the same northing First plot on the west will start 20 m in from the west boundary, and all successive plots eastward will have easting values m greater than the previous plot. Each line will have a northing value of 47.6 m less than the previous line.
 isn't important")


12 Systematic Plot Coordinates The order of the Descriptor, Northing, Easting (DNE) isn't important for PFO, but once an order is selected, it must be the same for all waypoints in the file. Excel Format for ingest with ArcGIS Y X COL m Comma delimited TEXT format for ingest with PFO ROW 47.6 m Repeat 5 X s

13 ArcGIS Ingest of Excel Coordinate File


14 ArcGIS Ingesting of Excel Coordinate File Make sure XLS columns match Arc s X, Y Fields Right Click on file & select Display XY Data which pops this open. Set projection
15 ArcGIS Ingesting of Excel Coordinate File As a SHAPEFILE
16 HawthsTools: Available for ArcGIS 10? In short.no. What did HawthsTools do?? Provide tools to easily allow the user to Creating Random Sample Points Within a single polygon (simple random sampling) Within multiple polygons (stratified random sampling) or from a subset of polygons from the full set. Could also specified a Minimum Distance Between Points If you were doing a forest inventory and didn't want the sample points to be any closer to each other than 1 chain (66 feet), you would specify a minimum distance of 20 meters which very close to 1 chain. There were 3 options for generating sample points Same number of sample points in each polygon Proportional (to polygon area) distribution of points Distribute pre-determined number of points/polygon Based on attribute specifying the number of points

17 HawthsTools & The ArcGIS 10 Facsimile HawthsTools is now formally discontinued, but ARC10 has a couple options: Requires surface probability raster layers to use properly OR

18 Get Today s Data From the Class Website
19 Grad Presentations Next 2 Weeks WEEK14 Tuesday Cooley, Rayma Belyaeva, Anna Iverson, Eve Thursday Konrady, Steven Kuntz, Cody Luby, Elizabeth WEEK15 Tuesday Madden, James Tuttle, Ross Sandoval, Claudette Thursday Final Exam Review


20 Generate Fixed # of Random Points/Polygon Have table open with polygons selected Puts 25 points in whatever polygon record(s) you select regardless of polygon size


21 Proportional Random Sampling Points If you want to have 5 sample points/acre in Forest - First, using Add Field create FOR5 in attribute table - Leave as short integer - Select FOR5 column and all the FOREST records - Then, use the Field Calculator [Acres] * 5 Because the FOR5 column is INTEGER, the result is truncated Then

22 5 Random Points/Acre in Forest Click
} / 3.28 = 22.")
23 Generate a specific % Sample Random Plots Now, you want a 25% sample of the GRASS areas using random 1 10 acre circular plots without double sampling - First, Add Field Grass25 as an integer - Select Grass25 column and all Grass records - Use Field Calculator to get number of points - [Acres] * 10 * Minimum point spacing = {2*sqrt(4356/PI)} / 3.28 = 22.71m (aka LINEAR UNIT) 1 10 acre 1 10 acre Then go to Create Random Points


24 25% sample with 1/10 ac circular plots What s wrong with this?


25 Buffer in from Polygon Edge By Plot Radius Don t want 1/10 th acre plot centers to be < 11.35m from an edge. Select the polygon(s) to buffer in the Attribute Table


26 Generate Points in Buffered Polygon

27 Generate Points in the Buffered Polygon
28 Start Here

29 Viewshed Analysis A viewshed is created from a DEM by using an algorithm that estimates the difference of elevation from one cell (the viewpoint cell) to the next (the target cell). To determine the visibility of a target cell, each cell between the viewpoint cell and target cell is examined for line of sight. If cells of higher value are between the viewpoint and target cells the line of sight is blocked. If the line of sight is blocked then the target cell is determined to not be part of the viewshed. If it is not blocked than it is included in the viewshed.

30 LANDSAT/ Data for today s exercise

 and")
31 Creating a Viewshed using a DEM srtm-dem_30m.img View_Point_Top.shp Qutput_raster To pick you own viewpoint, open an edit session on either of the point files (top or bottom) and move the point. Then, rerun the VIEWSHED function.

32 Prepare Viewshed for Export to KML Edit your viewshed output so that the Not Visible locations have no color

33 Viewshed from the Red Point
34 Exporting GIS data to a KML file Keyhole Markup Language (KML) is an XML (extensible Markup Language) notation for expressing geographic annotation and visualization within internet-based, two-dimensional maps and three-dimensional Earth browsers. KML was developed for use with Google Earth, which was originally named Keyhole Earth Viewer.


35 Exporting GIS data to a KML file Can export a whole Map Document or a single GIS Layer Save the DEM, the POINTS, and your Viewshed to a MAP DOCUMENT Then

36 Exporting GIS Data to a KML


 Quad")
37 3D Image Rendering (aka image drape) 30 meter SRTM DEM 30 meter Landsat-5 ( ) Quad Cities Area

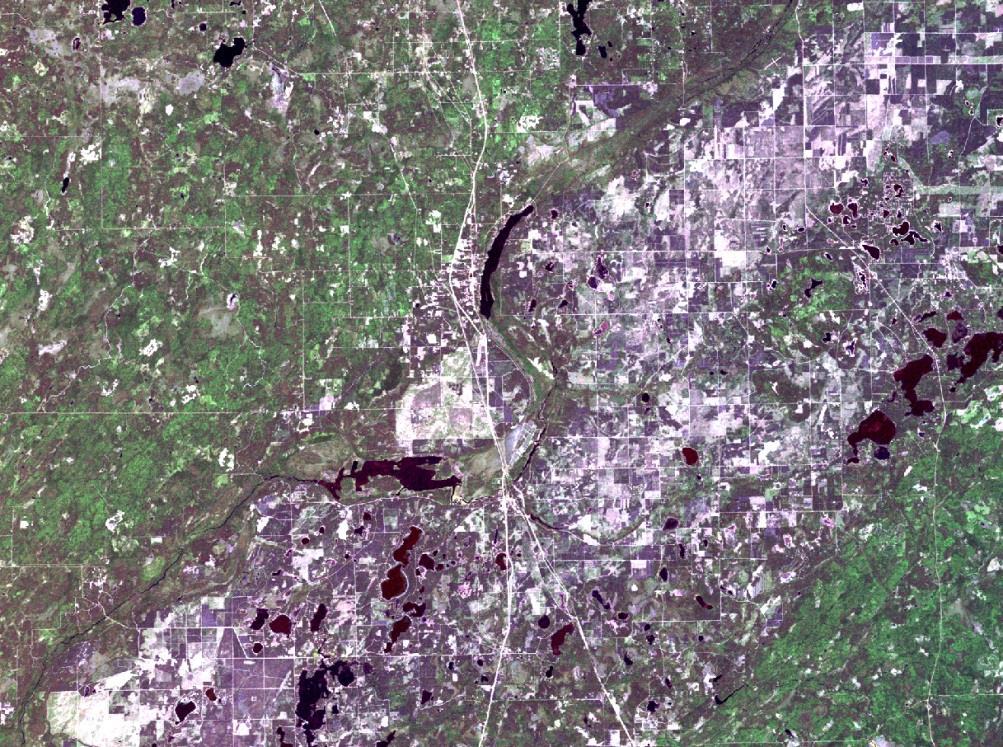

38 3D Image Rendering

39 3D Image Rendering ArcScene Read Landsat image & DEM same way as in ArcGIS Then, you can play with this to change view angle

40 3D Image Rendering ArcScene srtm-dem_30m.img

41 3D Image Rendering ArcScene
42 3D Image Rendering ArcScene First, use this to set observer position. e.g. Then, click this to start flying around...don t get lost!! Mouse = altitude Mouse = bearing Left click = faster Right click = slower reverse

43 Create Flyby Animation Open animation editor toolbar Animation Toolbar

44 Animation Controls

45 Exporting a FLYBY to an AVI file Audio Video Interleave
DEM Artifacts: Layering or pancake effects
 Outcomes DEM Artifacts: Stream networks & watersheds derived using ArcGIS s HYDROLOGY routines are only as good as the DEMs used. - Both DEM examples below have problems - Lidar and SRTM DEM products are
Lesson 5 overview. Concepts. Interpolators. Assessing accuracy Exercise 5
 Interpolation Tools Lesson 5 overview Concepts Sampling methods Creating continuous surfaces Interpolation Density surfaces in GIS Interpolators IDW, Spline,Trend, Kriging,Natural neighbors TopoToRaster
GEOGRAPHIC INFORMATION SYSTEMS Lecture 24: Spatial Analyst Continued
 GEOGRAPHIC INFORMATION SYSTEMS Lecture 24: Spatial Analyst Continued Spatial Analyst - Spatial Analyst is an ArcGIS extension designed to work with raster data - in lecture I went through a series of demonstrations
Lecture 21 - Chapter 8 (Raster Analysis, part2)
") GEOL 452/552 - GIS for Geoscientists I Lecture 21 - Chapter 8 (Raster Analysis, part2) Today: Digital Elevation Models (DEMs), Topographic functions (surface analysis): slope, aspect hillshade, viewshed,
GEOL 452/552 - GIS for Geoscientists I Lecture 21 - Chapter 8 (Raster Analysis, part2) Today: Digital Elevation Models (DEMs), Topographic functions (surface analysis): slope, aspect hillshade, viewshed,
GY461 GIS 1: Environmental Campus Topography Project with ArcGIS 9.x
 I. Introduction GY461 GIS 1: Environmental In this project you will use data from a topographic survey of the USA campus to generate 2 separate maps: 1. A color-coded 2-dimensional topographic contour
LAB #7 Creating TIN and 3D scenes (ArcScene) GISC, UNIVERSITY OF CALIFORNIA BERKELEY
 GISC, UNIVERSITY OF CALIFORNIA BERKELEY") LAB #7 Creating TIN and 3D scenes (ArcScene) GISC, UNIVERSITY OF CALIFORNIA BERKELEY The purpose of this laboratory is to introduce and explore surface data analysis using a vector data model: TIN. We
LAB #7 Creating TIN and 3D scenes (ArcScene) GISC, UNIVERSITY OF CALIFORNIA BERKELEY The purpose of this laboratory is to introduce and explore surface data analysis using a vector data model: TIN. We
Lecture 9. Raster Data Analysis. Tomislav Sapic GIS Technologist Faculty of Natural Resources Management Lakehead University
 Lecture 9 Raster Data Analysis Tomislav Sapic GIS Technologist Faculty of Natural Resources Management Lakehead University Raster Data Model The GIS raster data model represents datasets in which square
Surface Analysis with 3D Analyst
 2013 Esri International User Conference July 8 12, 2013 San Diego, California Technical Workshop Surface Analysis with 3D Analyst Khalid H. Duri Esri UC2013. Technical Workshop. Why use 3D GIS? Because
Lab 12: Sampling and Interpolation
 Lab 12: Sampling and Interpolation What You ll Learn: -Systematic and random sampling -Majority filtering -Stratified sampling -A few basic interpolation methods Data for the exercise are in the L12 subdirectory.
Surface Creation & Analysis with 3D Analyst
 Esri International User Conference July 23 27 San Diego Convention Center Surface Creation & Analysis with 3D Analyst Khalid Duri Surface Basics Defining the surface Representation of any continuous measurement
GIS LAB 8. Raster Data Applications Watershed Delineation
 GIS LAB 8 Raster Data Applications Watershed Delineation This lab will require you to further your familiarity with raster data structures and the Spatial Analyst. The data for this lab are drawn from
Reality Check: Processing LiDAR Data. A story of data, more data and some more data
 Reality Check: Processing LiDAR Data A story of data, more data and some more data Red River of the North Red River of the North Red River of the North Red River of the North Introduction and Background
Watershed Sciences 4930 & 6920 GEOGRAPHIC INFORMATION SYSTEMS
 HOUSEKEEPING Watershed Sciences 4930 & 6920 GEOGRAPHIC INFORMATION SYSTEMS Quizzes Lab 8? WEEK EIGHT Lecture INTERPOLATION & SPATIAL ESTIMATION Joe Wheaton READING FOR TODAY WHAT CAN WE COLLECT AT POINTS?
Applied Cartography and Introduction to GIS GEOG 2017 EL. Lecture-7 Chapters 13 and 14
 Applied Cartography and Introduction to GIS GEOG 2017 EL Lecture-7 Chapters 13 and 14 Data for Terrain Mapping and Analysis DEM (digital elevation model) and TIN (triangulated irregular network) are two
Purpose: To explore the raster grid and vector map element concepts in GIS.
 GIS INTRODUCTION TO RASTER GRIDS AND VECTOR MAP ELEMENTS c:wou:nssi:vecrasex.wpd Purpose: To explore the raster grid and vector map element concepts in GIS. PART A. RASTER GRID NETWORKS Task A- Examine
Creating Surfaces. Steve Kopp Steve Lynch
 Steve Kopp Steve Lynch Overview Learn the types of surfaces and the data structures used to store them Emphasis on surface interpolation Learn the interpolation workflow Understand how interpolators work
Contents of Lecture. Surface (Terrain) Data Models. Terrain Surface Representation. Sampling in Surface Model DEM
 Data Models. Terrain Surface Representation. Sampling in Surface Model DEM") Lecture 13: Advanced Data Models: Terrain mapping and Analysis Contents of Lecture Surface Data Models DEM GRID Model TIN Model Visibility Analysis Geography 373 Spring, 2006 Changjoo Kim 11/29/2006 1
Lecture 13: Advanced Data Models: Terrain mapping and Analysis Contents of Lecture Surface Data Models DEM GRID Model TIN Model Visibility Analysis Geography 373 Spring, 2006 Changjoo Kim 11/29/2006 1
Lab 11: Terrain Analyses
 Lab 11: Terrain Analyses What You ll Learn: Basic terrain analysis functions, including watershed, viewshed, and profile processing. There is a mix of old and new functions used in this lab. We ll explain
What can we represent as a Surface?
 Geography 38/42:376 GIS II Topic 7: Surface Representation and Analysis (Chang: Chapters 13 & 15) DeMers: Chapter 10 What can we represent as a Surface? Surfaces can be used to represent: Continuously
Getting Started with Spatial Analyst. Steve Kopp Elizabeth Graham
 Getting Started with Spatial Analyst Steve Kopp Elizabeth Graham Spatial Analyst Overview Over 100 geoprocessing tools plus raster functions Raster and vector analysis Construct workflows with ModelBuilder,
GEON Points2Grid Utility Instructions By: Christopher Crosby OpenTopography Facility, San Diego Supercomputer Center
 GEON Points2Grid Utility Instructions By: Christopher Crosby (ccrosby@sdsc.edu) OpenTopography Facility, San Diego Supercomputer Center (Formerly: GEON / Active Tectonics Research Group School of Earth
MODULE 1 BASIC LIDAR TECHNIQUES
 MODULE SCENARIO One of the first tasks a geographic information systems (GIS) department using lidar data should perform is to check the quality of the data delivered by the data provider. The department
L7 Raster Algorithms
 L7 Raster Algorithms NGEN6(TEK23) Algorithms in Geographical Information Systems by: Abdulghani Hasan, updated Nov 216 by Per-Ola Olsson Background Store and analyze the geographic information: Raster
Final project: Lecture 21 - Chapter 8 (Raster Analysis, part2) GEOL 452/552 - GIS for Geoscientists I
 GEOL 452/552 - GIS for Geoscientists I") GEOL 452/552 - GIS for Geoscientists I Lecture 21 - Chapter 8 (Raster Analysis, part2) Talk about class project (copy follow_along_data\ch8a_class_ex into U:\ArcGIS\ if needed) Catch up with lecture 20
GEOL 452/552 - GIS for Geoscientists I Lecture 21 - Chapter 8 (Raster Analysis, part2) Talk about class project (copy follow_along_data\ch8a_class_ex into U:\ArcGIS\ if needed) Catch up with lecture 20
Lab 12: Sampling and Interpolation
 Lab 12: Sampling and Interpolation What You ll Learn: -Systematic and random sampling -Majority filtering -Stratified sampling -A few basic interpolation methods Videos that show how to copy/paste data
GEOGRAPHIC INFORMATION SYSTEMS Lecture 25: 3D Analyst
 GEOGRAPHIC INFORMATION SYSTEMS Lecture 25: 3D Analyst 3D Analyst - 3D Analyst is an ArcGIS extension designed to work with TIN data (triangulated irregular network) - many of the tools in 3D Analyst also
Lab 7: Bedrock rivers and the relief structure of mountain ranges
 Lab 7: Bedrock rivers and the relief structure of mountain ranges Objectives In this lab, you will analyze the relief structure of the San Gabriel Mountains in southern California and how it relates to
Lidar and GIS: Applications and Examples. Dan Hedges Clayton Crawford
 Lidar and GIS: Applications and Examples Dan Hedges Clayton Crawford Outline Data structures, tools, and workflows Assessing lidar point coverage and sample density Creating raster DEMs and DSMs Data area
Lecture 06. Raster and Vector Data Models. Part (1) Common Data Models. Raster. Vector. Points. Points. ( x,y ) Area. Area Line.
 Common Data Models. Raster. Vector. Points. Points. ( x,y ) Area. Area Line.") Lecture 06 Raster and Vector Data Models Part (1) 1 Common Data Models Vector Raster Y Points Points ( x,y ) Line Area Line Area 2 X 1 3 Raster uses a grid cell structure Vector is more like a drawn map
Lecture 06 Raster and Vector Data Models Part (1) 1 Common Data Models Vector Raster Y Points Points ( x,y ) Line Area Line Area 2 X 1 3 Raster uses a grid cell structure Vector is more like a drawn map
Lecture 4: Digital Elevation Models
 Lecture 4: Digital Elevation Models GEOG413/613 Dr. Anthony Jjumba 1 Digital Terrain Modeling Terms: DEM, DTM, DTEM, DSM, DHM not synonyms. The concepts they illustrate are different Digital Terrain Modeling
Field-Scale Watershed Analysis
 Conservation Applications of LiDAR Field-Scale Watershed Analysis A Supplemental Exercise for the Hydrologic Applications Module Andy Jenks, University of Minnesota Department of Forest Resources 2013
LiDAR Derived Contours
 LiDAR Derived Contours Final Delivery June 10, 2009 Prepared for: Prepared by: Metro 600 NE Grand Avenue Portland, OR 97232 Watershed Sciences, Inc. 529 SW Third Avenue, Suite 300 Portland, OR 97204 Metro
Topic 5: Raster and Vector Data Models
 Geography 38/42:286 GIS 1 Topic 5: Raster and Vector Data Models Chapters 3 & 4: Chang (Chapter 4: DeMers) 1 The Nature of Geographic Data Most features or phenomena occur as either: discrete entities
Getting Started with Spatial Analyst. Steve Kopp Elizabeth Graham
 Getting Started with Spatial Analyst Steve Kopp Elizabeth Graham Workshop Overview Fundamentals of using Spatial Analyst What analysis capabilities exist and where to find them How to build a simple site
Watershed Sciences 4930 & 6920 GEOGRAPHIC INFORMATION SYSTEMS
 HOUSEKEEPING Watershed Sciences 4930 & 6920 GEOGRAPHIC INFORMATION SYSTEMS CONTOURS! Self-Paced Lab Due Friday! WEEK SIX Lecture RASTER ANALYSES Joe Wheaton YOUR EXCERCISE Integer Elevations Rounded up
Geographical Information Systems Institute. Center for Geographic Analysis, Harvard University. LAB EXERCISE 1: Basic Mapping in ArcMap
 Harvard University Introduction to ArcMap Geographical Information Systems Institute Center for Geographic Analysis, Harvard University LAB EXERCISE 1: Basic Mapping in ArcMap Individual files (lab instructions,
GY301 Geomorphology Lab 5 Topographic Map: Final GIS Map Construction
 GY301 Geomorphology Lab 5 Topographic Map: Final GIS Map Construction Introduction This document describes how to take the data collected with the total station for the campus topographic map project and
Lab 11: Terrain Analyses
 Lab 11: Terrain Analyses What You ll Learn: Basic terrain analysis functions, including watershed, viewshed, and profile processing. There is a mix of old and new functions used in this lab. We ll explain
Representing Geography
 Data models and axioms Chapters 3 and 7 Representing Geography Road map Representing the real world Conceptual models: objects vs fields Implementation models: vector vs raster Vector topological model
Visualization with ArcGlobe. Brady Hoak
 Visualization with ArcGlobe Brady Hoak Contents What is ArcGlobe? 3D Mapping and ArcGlobe Displaying data in ArcGlobe ArcGlobe tools Tips for constructing ArcGlobe documents New at ArcGIS 9.3 ArcGIS integration
Esri International User Conference. San Diego, California. Technical Workshops. July Creating Surfaces. Steve Kopp and Steve Lynch
 Esri International User Conference San Diego, California Technical Workshops July 2011 Creating Surfaces Steve Kopp and Steve Lynch Overview Learn the types of surfaces and the data structures used to
N.J.P.L.S. An Introduction to LiDAR Concepts and Applications
 N.J.P.L.S. An Introduction to LiDAR Concepts and Applications Presentation Outline LIDAR Data Capture Advantages of Lidar Technology Basics Intensity and Multiple Returns Lidar Accuracy Airborne Laser
GIS IN ECOLOGY: VISUALIZING IN 3D
 GIS IN ECOLOGY: VISUALIZING IN 3D Contents Introduction... 2 3D Analyst and ArcScene... 2 3D Data... 2 Course Data Sources... 3 Instructions for Copying the Course Dataset... 4 Tasks... 4 Visualizing and
Visual Information Solutions. E3De. The interactive software environment for extracting 3D information from LiDAR data.
 Visual Information Solutions E3De. The interactive software environment for extracting 3D information from LiDAR data. Photorealistic Visualizations. 3D Feature Extraction. Versatile Geospatial Products.
Developing an Interactive GIS Tool for Stream Classification in Northeast Puerto Rico
 Developing an Interactive GIS Tool for Stream Classification in Northeast Puerto Rico Lauren Stachowiak Advanced Topics in GIS Spring 2012 1 Table of Contents: Project Introduction-------------------------------------
Channel Conditions in the Onion Creek Watershed. Integrating High Resolution Elevation Data in Flood Forecasting
 Channel Conditions in the Onion Creek Watershed Integrating High Resolution Elevation Data in Flood Forecasting Lukas Godbout GIS in Water Resources CE394K Fall 2016 Introduction Motivation Flooding is
IMPROVING THE ACCURACY OF DIGITAL TERRAIN MODELS
 STUDIA UNIV. BABEŞ BOLYAI, INFORMATICA, Volume XLV, Number 1, 2000 IMPROVING THE ACCURACY OF DIGITAL TERRAIN MODELS GABRIELA DROJ Abstract. The change from paper maps to GIS, in various kinds of geographical
APPENDIX E2. Vernal Pool Watershed Mapping
 APPENDIX E2 Vernal Pool Watershed Mapping MEMORANDUM To: U.S. Fish and Wildlife Service From: Tyler Friesen, Dudek Subject: SSHCP Vernal Pool Watershed Analysis Using LIDAR Data Date: February 6, 2014
E3De. E3De Discover the Next Dimension of Your Data.
 International Support Exelis Visual Information Solutions is a global company with direct offices in North America, Europe, and Asia. Combined with our extensive, worldwide distributor network, we can
I CALCULATIONS WITHIN AN ATTRIBUTE TABLE
 Geology & Geophysics REU GPS/GIS 1-day workshop handout #4: Working with data in ArcGIS You will create a raster DEM by interpolating contour data, create a shaded relief image, and pull data out of the
Geol 588. GIS for Geoscientists II. Zonal functions. Feb 22, Zonal statistics. Interpolation. Zonal statistics Sp. Analyst Tools - Zonal.
 Zonal functions Geol 588 GIS for Geoscientists II Feb 22, 2011 Zonal statistics Interpolation Zonal statistics Sp. Analyst Tools - Zonal Choose correct attribute for zones (usually: must be unique ID for
University of West Hungary, Faculty of Geoinformatics. Béla Márkus. Spatial Analysis 5. module SAN5. 3D analysis
 University of West Hungary, Faculty of Geoinformatics Béla Márkus Spatial Analysis 5. module SAN5 3D analysis SZÉKESFEHÉRVÁR 2010 The right to this intellectual property is protected by the 1999/LXXVI
GIS IN ECOLOGY: VISUALIZING IN 3D
 GIS IN ECOLOGY: VISUALIZING IN 3D Contents Introduction... 2 3D Analyst and ArcScene... 2 3D Data... 3 Course Data Sources... 4 Copying the Course Dataset... 5 Tasks... 5 Creating/Converting 3D Data...
Copyright The McGraw-Hill Companies, Inc. Permission required for reproduction or display.
 Chapter 13. TERRAIN MAPPING AND ANALYSIS 13.1 Data for Terrain Mapping and Analysis 13.1.1 DEM 13.1.2 TIN Box 13.1 Terrain Data Format 13.2 Terrain Mapping 13.2.1 Contouring 13.2.2 Vertical Profiling 13.2.3
Importing GPS points and Hyperlinking images.
 Geol 3050 GIS for Geologists Exercise 15 Exercise 15 Making a Virtual Fieldtrip: Importing GPS points and Hyperlinking images. Due: Thursday, March 22. Goal: A) Get familiar with importing GPS points and
v TUFLOW-2D Hydrodynamics SMS Tutorials Time minutes Prerequisites Overview Tutorial
 v. 12.2 SMS 12.2 Tutorial TUFLOW-2D Hydrodynamics Objectives This tutorial describes the generation of a TUFLOW project using the SMS interface. This project utilizes only the two dimensional flow calculation
RASTER ANALYSIS S H A W N L. P E N M A N E A R T H D A T A A N A LY S I S C E N T E R U N I V E R S I T Y O F N E W M E X I C O
 RASTER ANALYSIS S H A W N L. P E N M A N E A R T H D A T A A N A LY S I S C E N T E R U N I V E R S I T Y O F N E W M E X I C O TOPICS COVERED Spatial Analyst basics Raster / Vector conversion Raster data
Topographic Lidar Data Employed to Map, Preserve U.S. History
 OCTOBER 11, 2016 Topographic Lidar Data Employed to Map, Preserve U.S. History In August 2015, the National Park Service (NPS) contracted Woolpert for the Little Bighorn National Monument Mapping Project
Lecture 23 - LiDAR. GEOL 452/552 - GIS for Geoscientists I. Scanning Lidar. 30 m DEM. Lidar representations:
 GEOL 452/552 - GIS for Geoscientists I Lecture 23 - LiDAR LiDAR - some background (thanks to Chris Kahle, DNR) Converting Lidar point data to a raster Look at online lidar data for Iowa (1m hillshaded)
Conservation Applications of LiDAR. Terrain Analysis. Workshop Exercises
 Conservation Applications of LiDAR Terrain Analysis Workshop Exercises 2012 These exercises are part of the Conservation Applications of LiDAR project a series of hands on workshops designed to help Minnesota
Improved Applications with SAMB Derived 3 meter DTMs
 Improved Applications with SAMB Derived 3 meter DTMs Evan J Fedorko West Virginia GIS Technical Center 20 April 2005 This report sums up the processes used to create several products from the Lorado 7
SilvAssist 3.5 Instruction Manual Instruction Manual for the SilvAssist Toolbar For ArcGIS. Version 3.5
 Instruction Manual for the SilvAssist Toolbar For ArcGIS Version 3.5 1 2 Contents Introduction... 5 Preparing to Use SilvAssist... 6 Polygon Selection... 6 Plot Allocator... 7 Requirements:... 7 Operation...
Statistical surfaces and interpolation. This is lecture ten
 Statistical surfaces and interpolation This is lecture ten Data models for representation of surfaces So far have considered field and object data models (represented by raster and vector data structures).
Raster GIS. Raster GIS 11/1/2015. The early years of GIS involved much debate on raster versus vector - advantages and disadvantages
 Raster GIS Google Earth image (raster) with roads overlain (vector) Raster GIS The early years of GIS involved much debate on raster versus vector - advantages and disadvantages 1 Feb 21, 2010 MODIS satellite
Using LiDAR (Light Distancing And Ranging) data to more accurately describe avalanche terrain
 data to more accurately describe avalanche terrain") International Snow Science Workshop, Davos 009, Proceedings Using LiDAR (Light Distancing And Ranging) data to more accurately describe avalanche terrain Christopher M. McCollister, and Robert H. Comey,
International Snow Science Workshop, Davos 009, Proceedings Using LiDAR (Light Distancing And Ranging) data to more accurately describe avalanche terrain Christopher M. McCollister, and Robert H. Comey,
Files Used in this Tutorial
 Generate Point Clouds and DSM Tutorial This tutorial shows how to generate point clouds and a digital surface model (DSM) from IKONOS satellite stereo imagery. You will view the resulting point clouds
Suitability Modeling with GIS
 Developed and Presented by Juniper GIS 1/33 Course Objectives What is Suitability Modeling? The Suitability Modeling Process Cartographic Modeling GIS Tools for Suitability Modeling Demonstrations of Models
GIS and Forest Engineering Applications
 FE 257. GIS and Forest Engineering Applications Week 3 This week s topics Clip and erase processes Chapter 6 Selecting landscape features in a GIS Chapter 5 GIS Lab3: Determining land use and ownership
FOR 274: Surfaces from Lidar. Lidar DEMs: Understanding the Returns. Lidar DEMs: Understanding the Returns
 FOR 274: Surfaces from Lidar LiDAR for DEMs The Main Principal Common Methods Limitations Readings: See Website Lidar DEMs: Understanding the Returns The laser pulse travel can travel through trees before
Making ArcGIS Work for You. Elizabeth Cook USDA-NRCS GIS Specialist Columbia, MO
 Making ArcGIS Work for You Elizabeth Cook USDA-NRCS GIS Specialist Columbia, MO 1 Topics Using ArcMap beyond the Toolkit buttons GIS data formats Attributes and what you can do with them Calculating Acres
Creating raster DEMs and DSMs from large lidar point collections. Summary. Coming up with a plan. Using the Point To Raster geoprocessing tool
 Page 1 of 5 Creating raster DEMs and DSMs from large lidar point collections ArcGIS 10 Summary Raster, or gridded, elevation models are one of the most common GIS data types. They can be used in many ways
v Prerequisite Tutorials GSSHA Modeling Basics Stream Flow GSSHA WMS Basics Creating Feature Objects and Mapping their Attributes to the 2D Grid
 v. 10.1 WMS 10.1 Tutorial GSSHA Modeling Basics Developing a GSSHA Model Using the Hydrologic Modeling Wizard in WMS Learn how to setup a basic GSSHA model using the hydrologic modeling wizard Objectives
Lesson 2 Installing and Using Quantum GIS (QGIS)
") Lesson 2 Installing and Using Quantum GIS (QGIS) Use file Explorer to open County QGIS portable hard drive provided. The program execute (.exe) will be at the bottom of the list. Double click on the file.
Lesson 2 Installing and Using Quantum GIS (QGIS) Use file Explorer to open County QGIS portable hard drive provided. The program execute (.exe) will be at the bottom of the list. Double click on the file.
Objectives Learn how GMS uses rasters to support all kinds of digital elevation models and how rasters can be used for interpolation in GMS.
 v. 9.1 GMS 9.1 Tutorial Using rasters for interpolation and visualization in GMS Objectives Learn how GMS uses rasters to support all kinds of digital elevation models and how rasters can be used for interpolation
COPYRIGHTED MATERIAL. Introduction to 3D Data: Modeling with ArcGIS 3D Analyst and Google Earth CHAPTER 1
 CHAPTER 1 Introduction to 3D Data: Modeling with ArcGIS 3D Analyst and Google Earth Introduction to 3D Data is a self - study tutorial workbook that teaches you how to create data and maps with ESRI s
Lecture 22 - Chapter 8 (Raster Analysis, part 3)
") GEOL 452/552 - GIS for Geoscientists I Lecture 22 - Chapter 8 (Raster Analysis, part 3) Today: Zonal Analysis (statistics) for polygons, lines, points, interpolation (IDW), Effects Toolbar, analysis masks
GEOL 452/552 - GIS for Geoscientists I Lecture 22 - Chapter 8 (Raster Analysis, part 3) Today: Zonal Analysis (statistics) for polygons, lines, points, interpolation (IDW), Effects Toolbar, analysis masks
WMS 9.1 Tutorial Hydraulics and Floodplain Modeling Floodplain Delineation Learn how to us the WMS floodplain delineation tools
 v. 9.1 WMS 9.1 Tutorial Hydraulics and Floodplain Modeling Floodplain Delineation Learn how to us the WMS floodplain delineation tools Objectives Experiment with the various floodplain delineation options
Digital Elevation Models (DEM)
") Digital Elevation Models (DEM) Digital representation of the terrain surface also referred to as Digital Terrain Models (DTM) Digital Elevation Models (DEM) How has relief depiction changed with digital
Digital Elevation Models (DEM) Digital representation of the terrain surface also referred to as Digital Terrain Models (DTM) Digital Elevation Models (DEM) How has relief depiction changed with digital
Terrain Modeling and Mapping for Telecom Network Installation Using Scanning Technology. Maziana Muhamad
 Terrain Modeling and Mapping for Telecom Network Installation Using Scanning Technology Maziana Muhamad Summarising LiDAR (Airborne Laser Scanning) LiDAR is a reliable survey technique, capable of: acquiring
Masking Lidar Cliff-Edge Artifacts
 Masking Lidar Cliff-Edge Artifacts Methods 6/12/2014 Authors: Abigail Schaaf is a Remote Sensing Specialist at RedCastle Resources, Inc., working on site at the Remote Sensing Applications Center in Salt
START>PROGRAMS>ARCGIS>
 Department of Urban Studies and Planning Spring 2006 Department of Architecture Site and Urban Systems Planning 11.304J / 4.255J GIS EXERCISE 2 Objectives: To generate the following maps using ArcGIS Software:
Raster GIS applications
 Raster GIS applications Columns Rows Image: cell value = amount of reflection from surface DEM: cell value = elevation (also slope/aspect/hillshade/curvature) Thematic layer: cell value = category or measured
Working with Elevation Data URPL 969 Applied GIS Workshop: Rethinking New Orleans After Hurricane Katrina Spring 2006
 Working with Elevation Data URPL 969 Applied GIS Workshop: Rethinking New Orleans After Hurricane Katrina Spring 2006 This GIS lab exercise will explore Light Detection And Ranging (LiDAR) data for New
Chapter 8: Elevation Data
 Chapter 8: Elevation Data SADA permits user s to bring in elevation data into their analysis. The same types of grid file formats for importing gridded data discussed in the previous chapter apply to elevation
NEXTMap World 10 Digital Elevation Model
 NEXTMap Digital Elevation Model Intermap Technologies, Inc. 8310 South Valley Highway, Suite 400 Englewood, CO 80112 10012015 NEXTMap (top) provides an improvement in vertical accuracy and brings out greater
Local Elevation Surface Modeling using GPS Derived Point Clouds. John G. Whitman, Jr.
 Local Elevation Surface Modeling using GPS Derived Point Clouds WhitmanJ2@myfairpoint.net Study Area Overview Topographic Background NAIP with Roads and Streams Public DEM Models of Study Area National
Tutorial 18: 3D and Spatial Analyst - Creating a TIN and Visual Analysis
 Tutorial 18: 3D and Spatial Analyst - Creating a TIN and Visual Analysis Module content 18.1. Creating a TIN 18.2. Spatial Analyst Viewsheds, Slopes, Hillshades and Density. 18.1 Creating a TIN Sometimes
Alaska Department of Transportation Roads to Resources Project LiDAR & Imagery Quality Assurance Report Juneau Access South Corridor
 Alaska Department of Transportation Roads to Resources Project LiDAR & Imagery Quality Assurance Report Juneau Access South Corridor Written by Rick Guritz Alaska Satellite Facility Nov. 24, 2015 Contents
The 3D Analyst extension extends ArcGIS to support surface modeling and 3- dimensional visualization. 3D Shape Files
 NRM 435 Spring 2016 ArcGIS 3D Analyst Page#1 of 9 0B3D Analyst Extension The 3D Analyst extension extends ArcGIS to support surface modeling and 3- dimensional visualization. 3D Shape Files Analogous to
Review of Cartographic Data Types and Data Models
 Review of Cartographic Data Types and Data Models GIS Data Models Raster Versus Vector in GIS Analysis Fundamental element used to represent spatial features: Raster: pixel or grid cell. Vector: x,y coordinate
A GIS SAMPLING ASSISTANT PROGRAM FOR FOREST INVENTORY POINT/PLOT SCHEMES
 A GIS SAMPLING ASSISTANT PROGRAM FOR FOREST INVENTORY POINT/PLOT SCHEMES Donald J. Lipscomb, Research Specialist Department of Forestry and Natural Resources Clemson University, Clemson, S.C. 29634 Dr.
INTRODUCTION TO GIS WORKSHOP EXERCISE
 111 Mulford Hall, College of Natural Resources, UC Berkeley (510) 643-4539 INTRODUCTION TO GIS WORKSHOP EXERCISE This exercise is a survey of some GIS and spatial analysis tools for ecological and natural
Geometric Rectification of Remote Sensing Images
 Geometric Rectification of Remote Sensing Images Airborne TerrestriaL Applications Sensor (ATLAS) Nine flight paths were recorded over the city of Providence. 1 True color ATLAS image (bands 4, 2, 1 in
The GIS Spatial Data Model
 The GIS Spatial Data Model Introduction: Spatial data are what drive a GIS. Every piece of functionality that makes a GIS separate from another analytical environment is rooted in the spatially explicit
Exercise 1: Introduction to ILWIS with the Riskcity dataset
 Exercise 1: Introduction to ILWIS with the Riskcity dataset Expected time: 2.5 hour Data: data from subdirectory: CENN_DVD\ILWIS_ExerciseData\IntroRiskCity Objectives: After this exercise you will be able
Cell based GIS. Introduction to rasters
 Week 9 Cell based GIS Introduction to rasters topics of the week Spatial Problems Modeling Raster basics Application functions Analysis environment, the mask Application functions Spatial Analyst in ArcGIS
Mid-term exam. GIS and Forest Engineering Applications. Week 5. FE 257. GIS and Forest Engineering Applications. Week 5
 FE 257. GIS and Forest Engineering Applications Week 5 Week 5 Last week (Chapter 3): Acquiring, creating, and editing GIS s Examining Error Chapter 7 Buffering and other proximity operations Questions?
I. An Intro to ArcMap Version 9.3 and 10. 1) Arc Map is basically a build your own Google map
 Arc Map is basically a build your own Google map") I. An Intro to ArcMap Version 9.3 and 10 What is Arc Map? 1) Arc Map is basically a build your own Google map a. Display and manage geo-spatial data (maps, images, points that have a geographic location)
I. An Intro to ArcMap Version 9.3 and 10 What is Arc Map? 1) Arc Map is basically a build your own Google map a. Display and manage geo-spatial data (maps, images, points that have a geographic location)
Lesson 3: Introduction to Using QGIS
 Agricultural Nutrient Management Program Department of Environmental Science and Technology 0116 Symons Hall 7998 Regents Dr. College Park, MD 20742 TEL 301-405-1319 FAX 301-314-7375 www.extension.umd.edu/anmp
GIS IN ECOLOGY: MORE RASTER ANALYSES
 GIS IN ECOLOGY: MORE RASTER ANALYSES Contents Introduction... 2 More Raster Application Functions... 2 Data Sources... 3 Tasks... 4 Raster Recap... 4 Viewshed Determining Visibility... 5 Hydrology Modeling