Prepared for: Rocklin. Prepared by:
|
|
|
- Julian Hunt
- 5 years ago
- Views:
Transcription
1 APPENDIX L
2 Sierra Gateway Apartments Transportation Impact Analysis Report Prepared for: Rocklin Sierra Apartments II, LLC Prepared by:
3 SIERRA GATEWAY APARTMENTS TRANSPORTATION IMPACT ANALYSIS REPORT PREPARED FOR: Rocklin Sierra Apartments II, LLC Calabasas Road Calabasas, CA PREPARED BY: Omni-Means, Ltd. 943 Reserve Drive, Suite 100 Roseville, CA MARCH R1783TIA008.docx
4 TABLE OF CONTENTS Introduction... 1 Project Setting... 4 Transportation System... 4 Study Intersections... 4 Study Mainline and Ramp Segments... 5 Existing Traffic Volumes... 5 Alternative Transportation Modes... 6 Transit Services... 6 Pedestrian Facilities... 6 Bicycle Facilities... 6 Level of Service Methodologies and Guidelines... 7 General LOS Methodologies... 7 Mainline and Ramp LOS Methodologies... 7 Intersection LOS Methodologies... 7 City of Rocklin LOS Guidelines... 9 Caltrans LOS Guidelines... 9 Intersection Analysis... 9 Mainline and Ramp Analysis... 9 Target LOS Threshold... 9 Standards of Significance Significant Impact Technical Analysis Parameters Existing Conditions Intersection Operations Ramp Operations Sierra Gateway Apartments Transportation Impact Analysis Report The Ezralow Company, LLC Page i R1783TIA008.docx
5 Historical Collision Data Project Description Roadway Improvement Project Trip Generation Project Trip Distribution and Assignment Existing Plus Project Intersection Operations Ramp Operations Existing Plus Project with Outbound Access from Water Lily Lane Intersection Operations Short Term Conditions Approved/Pending Projects Approved/Pending Projects Trip Assignment and Distribution Short Term No Project Intersection Operation Short Term No Project Ramp Operations Short Term Plus Project Conditions Intersection Operations Ramp Operations Short Term Plus Project with Outbound Access from Water Lily Lane Intersection Intersection Operations Cumulative (Year 2030) Conditions Planned/Programmed Improvements Rocklin Road Widening Sierra College Boulevard Widening Rocklin Road/Sierra College Boulevard Intersections Modification Other Study Intersections Modification Sierra Gateway Apartments TIAR The Ezralow Company, LLC Page ii R1783TIA008.docx
6 Year 2030 No Project Traffic Volumes Intersection Operations Ramp Operations Year 2030 Plus Project Intersection Operations Sierra College Boulevard/Rocklin Road Intersection Sierra College Boulevard/Interstate 80 EB Ramps Intersection Sierra College Boulevard/Interstate 80 WB Ramps Intersection Rocklin Road Interchange Intersections Rocklin Road Interchange Improvement Alternatives Ramp Operations Year 2030 Plus Project with Outbound Access from Water Lily Lane Intersection Intersection Operations Sierra College Boulevard/Rocklin Road Intersection Sierra College Boulevard/Interstate 80 EB Ramps Intersection Sierra College Boulevard/Interstate 80 WB Ramps Intersection Rocklin Road Interchange Intersections Rocklin Road Interchange Improvement Alternatives Project Site Access - Focused Analysis Appendix LIST OF FIGURES Figure 1 Project Location and Vicinity Map... 3 Figure 2 Existing Intersection Lane Geometrics and Control Figure 3 Project Trip Distribution Figure 4 - Cumulative Lane Geometrics Sierra Gateway Apartments TIAR The Ezralow Company, LLC Page iii R1783TIA008.docx
7 LIST OF TABLES Table 1 Level of Service (LOS) Criteria For Mainline Segments... 7 Table 2 LOS Criteria For Intersections... 8 Table 3 Intersection LOS Threshold and Jurisdiction Table 4 Technical Analysis Parameters Table 6 Existing Ramp and Mainline Level of Service Table 7 Historical Collision Data at Study Intersections Table 8 Project Trip Generation Table 9 Existing Plus Project Intersection Level of Service Table 10 Existing Plus Project Ramp and Mainline Level of Service Table 11 Existing Plus Project with Outbound Access from Water Lily Lane Table 12 Approved-Pending Project Trips Table 13 Short Term No Project Intersection Level of Service Table 14 Short Term No Project Ramp and Mainline Level of Service Table 15 Short Term Plus Project Intersection Level of Service Table 16 Short Term Plus Project Ramp and Mainline Level of Service Table 17 Short Term Plus Project with Outbound Access from Water Lily Lane Intersection LOS Table 18 Year 2030 No Project Intersection Level of Service Table 19 Year 2030 No Project Ramp and Mainline Level of Service Table 20 Year 2030 Plus Project Intersection Level of Service Table 21 Year 2030 Plus Project Ramp and Mainline Level of Service Table 22 Year 2030 Plus Project with Outbound Access from Water Lily Lane Intersection LOS Table 23 Project Site Access Summary Table Sierra Gateway Apartments TIAR The Ezralow Company, LLC Page iv R1783TIA008.docx
8 APPENDIX Traffix LOS Worksheets Synchro LOS Worksheets HCS Worksheets Sierra Gateway Apartments TIAR The Ezralow Company, LLC Page v R1783TIA008.docx
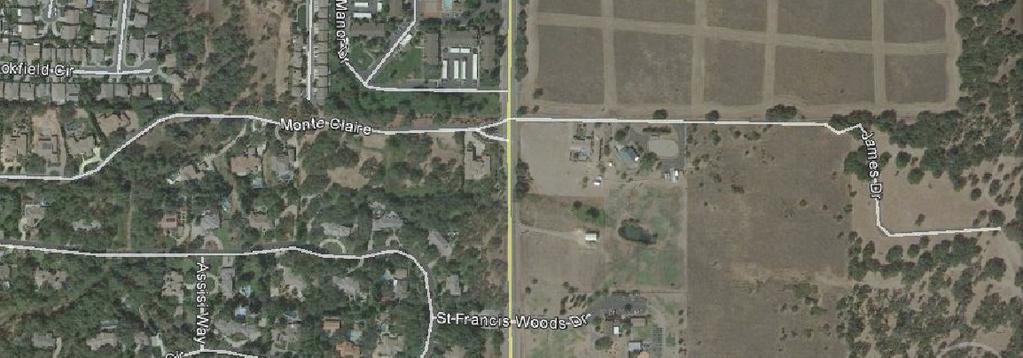
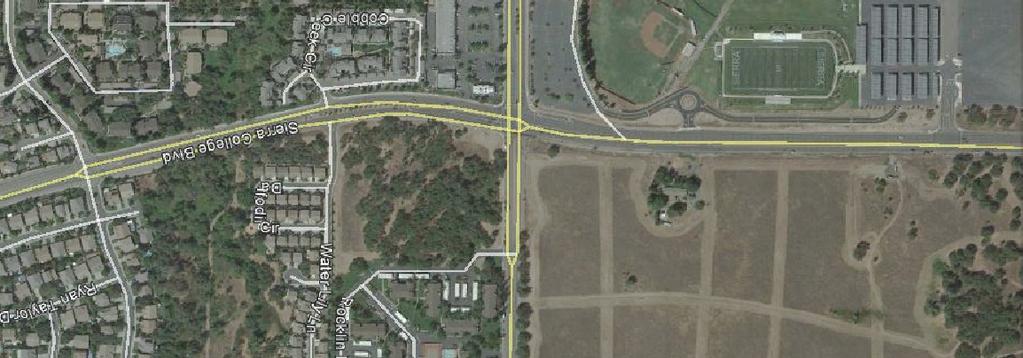
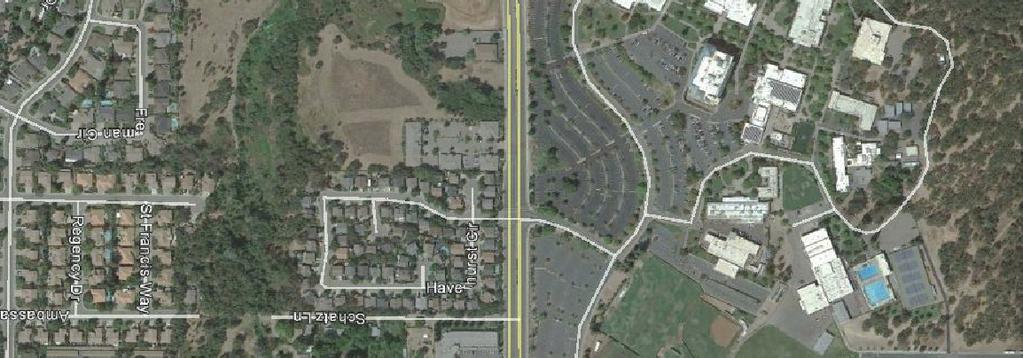
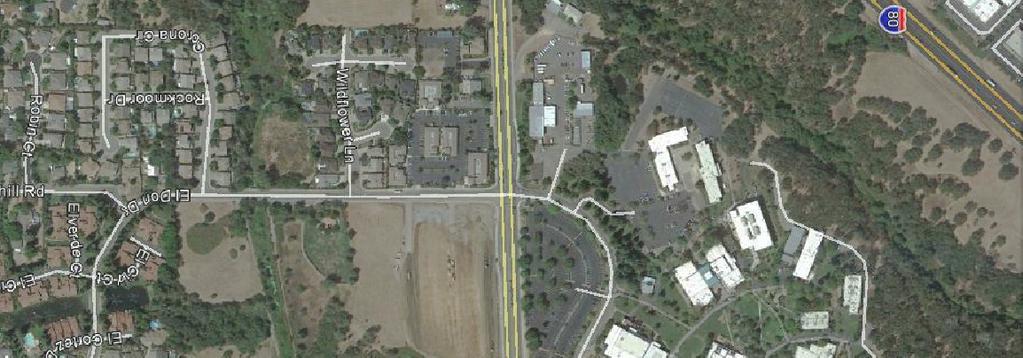
9 Introduction This report has been prepared to present the results of a traffic impact analysis performed by Omni-Means for the proposed Sierra Gateway Apartments (Project) in the City of Rocklin (City). The site is located on a vacant 9.83 acre parcel immediately southeast of the intersection of Rocklin Road and Sierra College Boulevard. The Project site is bounded by Rocklin Road to the north, Sierra College Boulevard to the west, existing residential development to the east, and single-family residences to the south. Based on a review of the submitted site plan, the Project proposes to develop 195 apartment dwelling units. Primary access to the proposed Project would be provided from Rocklin Road via the existing Rocklin Manor Drive. The adjacent residential development immediately east of the proposed Project currently has access to Rocklin Road from a driveway off of Rocklin Manor Drive. Secondary, exit only and emergency access will be provided to Sierra College Boulevard via Water Lily Lane along the southern edge of the Project site. Figure 1 shows the project location and vicinity map. This report includes a description of the existing transportation setting, including current AM and PM peak hour traffic operations at study intersections. Study intersections were selected in consultation with City of Rocklin staff. This report also includes analysis and discussion of the following items: Approved projects within the City of Rocklin, along with quantification of trip generation and distribution associated with those projects and their combined impacts on existing AM and PM peak hour intersection operations. Quantification of the trip generation and trip distribution associated with the proposed project and the resulting impacts on existing AM and PM peak hour intersection operations. The projected Cumulative (Year 2030) peak hour operations with and without the development of the proposed project. Potential improvements that are needed to mitigate project impacts and eliminate level of service deficiencies. The following transportation impact analysis scenarios are included in this report: 1. Existing Conditions 2. Existing Plus Project Conditions 3. Existing Plus Project with Outbound Access from Water Lily Lane Conditions 4. Short Term No Project (Existing + Approved Projects Scenario) Conditions 5. Short Term Plus Project (Existing + Approved Project Scenario + proposed Project) Conditions 6. Short Term Plus Project with Outbound Access from Water Lily Lane Conditions 7. Year 2030 No Project Conditions 8. Year 2030 Plus Project Conditions 9. Year 2030 Plus Project Conditions with Outbound Access from Water Lily Lane Existing conditions describes the existing transportation facilities serving the project site, and the traffic operations that currently exist for those facilities. Sierra Gateway Apartments Transportation Impact Analysis Report Page 1 The Ezralow Company, LLC R1783TIA008.docx
10 Existing Plus Project conditions analyze traffic impacts associated with the proposed Project are investigated in comparison to the Existing conditions scenario. This scenario assumes primary access to the proposed Project will be from Rocklin Road via Rocklin Manor Drive only, with emergency-only access to Sierra College Boulevard via Water Lily Lane. Existing Plus Project with Outbound Access from Water Lily Lane conditions are similar to Existing Plus Project conditions, but assume that outbound access from the propose Project will also be available to Sierra College Boulevard via Water Lily Lane. As with Existing Plus Project conditions, this scenario analyzes traffic impacts associated with the proposed Project in comparison to the Existing conditions scenario. Short Term conditions refer to future scenarios in which approved and/or pending development projects in the Project vicinity are assumed to be completed. The Short Term No Project scenario analyzes traffic operations following completion of approved projects only, with the exclusion of the proposed Project. The Short Term Plus Project scenario analyzes traffic operations following completion of approved projects with the addition of traffic generated by the proposed Project and investigates proposed Project impacts in comparison to the Short Term No Project scenario, assuming primary Project access is provided to Rocklin Road only via Rocklin Manor Drive. The Short Term Plus Project with Outbound Access from Water Lily Lane scenario allows outbound access from the Project to Sierra College Boulevard via Water Lily Lane and investigates proposed Project impacts in comparison to the Short Term No Project scenario. Year 2030 (Cumulative) conditions refer to future scenarios which assume full buildout of all remaining City of Rocklin vacant lands, consistent with the City's General Plan Land Use Element. Additionally, Year 2030 conditions assume construction of transportation infrastructure improvements consistent with the City's General Plan Circulation Element, specifically programmed improvements included in the City's Capital Improvement Program. The Year 2030 No Project scenario analyzes traffic operations assuming buildout of the City's General Plan with the exclusion of the proposed Project. The Year 2030 Plus Project scenario analyzes traffic operations assuming buildout of the City's General Plan in addition to the proposed Project and investigates proposed Project impacts in comparison to the Year 2030 No Project scenario, assuming primary project access is provided to Rocklin Road only via Rocklin Manor Drive. The Year 2030 Plus Project with Outbound Access from Water Lily Lane scenario allows outbound access from the Project to Sierra College Boulevard via Water Lily Lane and investigates proposed Project impacts in comparison to the Year 2030 No Project scenario. The methodologies used to develop traffic volumes for the above traffic scenarios are described in greater detail in the subsequent relevant sections of this report. Following analysis of each analysis scenario, a description of identified deficiencies is included and a determination of project impacts is made. Improvements to mitigate deficiencies and project impacts are included in the Mitigations section of this report. Sierra Gateway Apartments TIAR Page 2 The Ezralow Company, LLC R1783TIA008.docx
11
12 Project Setting The City of Rocklin is located in Placer County, California, covering approximately 19.5 square miles. The American Census Survey reports that in 2014, the population in Rocklin was estimated at 59,000. Transportation System Interstate 80 (I-80) is a high capacity major interstate freeway facility that traverses the study area generally in the southwest-northeast direction connecting major urban centers within and beyond the state of California. I-80 serves as a major home-to-work commuter route in the Davis-Sacramento-Auburn area, and is the major connector for Bay Area-Lake Tahoe-Reno recreation traffic. I-80 enters the City limits at the State Route 65 interchange and continues northeast where it exits the Rocklin City limits at the Brace Road overpass. I-80 through the Rocklin area is a six-lane freeway with two interchanges providing access to and from the Rocklin area. Rocklin Road is an east-west roadway that is classified within the City of Rocklin General Plan Circulation Element as a principal arterial between Pacific Street and Sierra College Boulevard, carrying large volumes of through traffic. From Pacific Street to Sierra College Boulevard, Rocklin Road is a four lane roadway with a two-way left turn lane. East of Sierra College Boulevard it traverses as a two-lane roadway entering the Town limits of Loomis. Rocklin Road has one of the two interchanges with I-80 within the City of Rocklin. Sierra College Boulevard is predominantly a north-south four- to six-lane roadway that is classified within the City of Rocklin General Plan Circulation Element as principal arterial, carrying large volumes of through traffic in the eastern portion of the planning area. It connects the City of Rocklin to the City of Roseville in the south and the Town of Loomis in the north. Sierra College Boulevard begins in the south at the Placer County/Sacramento County line as the northward extension of Hazel Avenue, continuing north through (or along the border of) different sections of unincorporated Placer County and the incorporated cities of Roseville and Rocklin, and the Town of Loomis, ending eventually at State Route 193 near the City of Lincoln. Sierra College Boulevard is the second of two interchanges with I-80 within the City of Rocklin. Rocklin Manor Drive is a two-lane semi-circular private driveway that provides primary access to Rocklin Road from the multi-family residential development immediately east of the proposed Project Site. Rocklin Manor Drive forms a stub south of its western intersection with Rocklin Road, where future access to the proposed Project is anticipated. Water Lily Lane is a two-lane east-west local street that provides primary access to Sierra College Boulevard from about 47 single family homes immediately south of the proposed Project site. Water Lily Lane is not a through street. Study Intersections The following list of critical study intersections were identified in coordination with City of Rocklin staff for analysis during weekday AM and PM peak hour conditions: 1. Sierra College Boulevard / Rocklin Road 2. Sierra College Boulevard / Water Lily Lane - Cobblecreek Circle Sierra Gateway Apartments TIAR Page 4 The Ezralow Company, LLC R1783TIA008.docx
13 3. Rocklin Road / Rocklin Manor Drive (west entrance) 4. Rocklin Road / I-80 WB Ramps 5. Rocklin Road / I-80 EB Ramps 6. Sierra College Boulevard / I-80 EB Ramps 7. Sierra College Boulevard / I-80 WB Ramps Study Mainline and Ramp Segments The following list of critical study freeway mainline segments and merge/diverge segments were identified in coordination with City of Rocklin and Caltrans staff for analysis during AM and PM peak hour conditions: 1. I-80 EB South of Rocklin Road 2. I-80 EB Off Ramp at Rocklin Road 3. I-80 EB On Ramp at Rocklin Road 4. I-80 WB Off Ramp at Rocklin Road 5. I-80 WB On Ramp at Rocklin Road 6. I-80 WB South of Rocklin Road 7. I-80 EB South of Sierra College Boulevard 8. I-80 EB Off Ramp at Sierra College Boulevard 9. I-80 EB Loop On Ramp at Sierra College Boulevard 10. I-80 EB On Ramp at Sierra College Boulevard 11. I-80 EB North of Sierra College Boulevard 12. I-80 WB North of Sierra College Boulevard 13. I-80 WB Off Ramp at Sierra College Boulevard 14. I-80 WB On Loop Ramp at Sierra College Boulevard 15. I-80 WB On Ramp at Sierra College Boulevard 16. I-80 WB South of Sierra College Boulevard Ramp traffic volumes were obtained from the existing intersection counts at the intersections of Rocklin Road & I-80 WB Ramps, Rocklin Road & I-80 EB Ramps, Sierra College Boulevard & I- 80 EB Ramps, and Sierra College Boulevard & I-80 WB Ramps. Mainline traffic volumes were obtained from the 2014 published Caltrans data for I-80 mainline segment. Existing Traffic Volumes Existing traffic counts were collected by Omni-Means on multiple days at the above study intersections, during both AM and PM peak hours. Existing AM and PM peak hour turning movement counts at the Sierra College Boulevard / Rocklin Road intersection were collected in October 2015 during a typical weekday while local schools were in session. Existing AM and PM peak hour turning movement counts at the Rocklin Road and Sierra College Boulevard interchanges were collected in May 2016 during a typical weekday while local schools were in session. AM peak hour is defined as the one-hour of peak traffic flow (which is the highest total volume count over four consecutive 15-minute count periods) counted between 7:00 AM and 9:00 AM on a typical weekday. The PM peak hour is defined as the one-hour of peak traffic flow counted between 4:00 PM and 6:00 PM on a typical weekday. Existing AM and PM peak hour traffic volumes at the study intersections identified above are attached in the Appendix. Sierra Gateway Apartments TIAR Page 5 The Ezralow Company, LLC R1783TIA008.docx
14 Alternative Transportation Modes Transit Services City of Rocklin is served by Placer County Transit Agency (PCTA) for the regional and interregional transportation. Lincoln Sierra College Route: It is a bus service that serves from Lincoln on 3rd & F street to Sierra College in Rocklin, six days a week. The bus stop near the project is in Sierra College on Rocklin Road. The bus schedule can be found on the Placer County Transit website. Auburn to Light Rail Route: It is a bus service that serves from Auburn Station/Nevada Street to Light Rail Watt/I-80, six days a week. The bus stop near the project is in Sierra College on Rocklin Road. The bus schedule can be found on the Placer County Transit website. Taylor Road Shuttle Route: It is a bus service that serves from Auburn Station/Nevada Street to Sierra College in Rocklin, six days a week. The bus stop near the project is in Sierra College on Rocklin Road. The bus schedule can be found on the Placer County Transit website. Pedestrian Facilities Rocklin Road currently has sidewalks along the southern portion of the roadway from Sierra College Boulevard east to the Rocklin City Limits and sidewalks along both portions of the roadway west of Sierra College Boulevard. Sierra College currently has sidewalks along the western portion of the roadway from Rocklin Road south to the Rocklin City Limits and sidewalks intermittently on the eastern portion of the roadway from the project site south to the Rocklin City Limits. Water Lily Lane, south of the proposed project site, has sidewalks along both portions of the roadway until the terminus. Bicycle Facilities The Placer County Transportation Planning Agency is the lead agency to coordinate planning efforts of local jurisdictions in providing a safe and efficient regional system of bicycle routes for commuter, school, and recreational use. Within the City of Rocklin, the study identifies existing bike facilities with classifications from the California Streets and Highways Code as follows: (a) Bike paths or shared use paths, also referred to as "Class I bikeways," which provide a completely separated right-of-way designated for the exclusive use of bicycles and pedestrians with cross-flows by motorists minimized. (b) Bike lanes, also referred to as "Class II bikeways," which provide a restricted right-of-way designated for the exclusive or semi-exclusive use of bicycles with through travel by motor vehicles or pedestrians prohibited, but with vehicle parking and cross-flows by pedestrians and motorists permitted. (c) Bike routes, also referred to as "Class III bikeways," which provide a right-ofway on street or off-street, designated by signs or permanent markings and shared with pedestrians and motorists. Sierra Gateway Apartments TIAR Page 6 The Ezralow Company, LLC R1783TIA008.docx
15 (d) Cycle tracks or separated bikeways, also referred to as "Class IV bikeways," which promote active transportation and provide a right-of-way designated exclusively for bicycle travel adjacent to a roadway and which are separated from vehicular traffic. Types of separation include, but are not limited to, grade separation, flexible posts, inflexible physical barriers, or on-street parking. In the vicinity of the project, a Class II bike lane currently exists along Sierra College Boulevard and Rocklin Road. Level of Service Methodologies and Guidelines General LOS Methodologies Intersection and ramp LOS have been calculated for all control types using the methods documented in the Transportation Research Board publication Highway Capacity Manual LOS determinations are presented on a letter grade scale from A to F, whereby LOS A represents free-flow conditions and LOS F represents over capacity conditions. Mainline and Ramp LOS Methodologies Mainline and ramp LOS is calculated using HCS 2010 software by McTrans. LOS has been calculated on a density basis in passenger cars per mile per lane (pc/mi/ln). Table 1 presents the LOS threshold for mainline and ramp segments in the study area. TABLE 1 LEVEL OF SERVICE (LOS) CRITERIA FOR MAINLINE SEGMENTS BASIC FREEWAY SEGMENTS RAMP MERGE AND DIVERGE AREAS LOS Density (pc/mi/ln) LOS Density (pc/mi/ln) A 0-11 A <=10 B > B > C > C > D > D > E >35-45 E > 35 F > 45 F Intersection LOS Methodologies Demand exceeds capacity Intersection LOS has been calculated for all City of Rocklin signalized study intersections using Circular 212 Planning methodology. LOS at signalized ramp terminals at Rocklin Road and Sierra College Boulevard have been calculated using methods documented in the Transportation Research Board (TRB) Publication Highway Capacity Manual (HCM), Fifth Edition, LOS at all unsignalized intersections has been determined using HCM 2010 methodology. For two-way stop-controlled (TWSC) intersections, the "worst-case" movement delays and LOS is reported, computed based on HCM Table 2 presents the LOS definitions for different types of intersection controls. Sierra Gateway Apartments TIAR Page 7 The Ezralow Company, LLC R1783TIA008.docx
16 TABLE 2 LOS CRITERIA FOR INTERSECTIONS Level of Service Type of Flow Delay Maneuverability A Stable Flow Very slight delay. Progression is very Turning movements are easily favorable, with most vehicles arriving during made, and nearly all drivers the green phase not stopping at all. find freedom of operation. Stopped Delay/Vehicle (sec) Signalized/ Unsignalized/ Roundabouts All-Way Stop < 10.0 < 10.0 B Stable Flow Good progression and/or short cycle lengths. More vehicles stop than for LOS A, causing higher levels of average delay. C Stable Flow Higher delays resulting from fair progression and/or longer cycle lengths. Individual cycle failures may begin to appear at this level. The number of vehicles stopping is significant, although many still pass through the intersection without stopping. D E Approaching Unstable Flow Unstable Flow The influence of congestion becomes more noticeable. Longer delays may result from some combination of unfavorable progression, long cycle lengths, or high volume-to-capacity ratios. Many vehicles stop, and the proportion of vehicles not stopping declines. Individual cycle failures are noticeable. Generally considered to be the limit of acceptable delay. Indicative of poor progression, long cycle lengths, and high volume-to-capacity ratios. Individual cycle failures are frequent occurrences. F Forced Flow Generally considered to be unacceptable to most drivers. Often occurs with over saturation. May also occur at high volume-tocapacity ratios. There are many individual cycle failures. Poor progression and long cycle lengths may also be major contributing factors. References: 2010 Highway Capacity Manual Vehicle platoons are formed. Many drivers begin to feel somewhat restricted within groups of vehicles. Back-ups may develop behind turning vehicles. Most drivers feel somewhat restricted Maneuverability is severely limited during short periods due to temporary back-ups. There are typically long queues of vehicles waiting upstream of the intersection. Jammed conditions. Back-ups from other locations restrict or prevent movement. Volumes may vary widely, depending principally on the downstream back-up conditions. >10 and < 20.0 >20 and < 35.0 >35 and < 55.0 >55 and < 80.0 >10 and < 15.0 >15 and < 25.0 >25 and < 35.0 >35 and < 50.0 > 80.0 > 50.0 Sierra Gateway Apartments TIAR Page 8 The Ezralow Company, LLC R1783TIA008.docx
17 City of Rocklin LOS Guidelines The City of Rocklin General Plan (October 2012) Circulation Element quotes the following: C-10 A. Maintain a minimum traffic Level of Service C for all signalized intersections during the p.m. peak hour on an average weekday, except in the circumstances described in C-10. B and C. below. B. Recognizing that some signalized intersections within the City serve and are impacted by development located in adjacent jurisdictions, and that these impacts are outside the control of the City, a development project which is determined to result in a Level of Service worse than C may be approved, if the approving body finds (1) the diminished level of service is an interim situation which will be alleviated by the implementation of planned improvements or (2) based on the specific circumstances described in Section C below, there are no feasible street improvements that will improve the Level of Service to C or better as set forward in the Action Plan for the Circulation Element. C. All development in another jurisdiction outside of Rocklin s control which creates traffic impacts in Rocklin should be required to construct all mitigation necessary in order to maintain a LOS C in Rocklin unless the mitigation is determined to be infeasible by the Rocklin City Council. The standard for determining the feasibility of the mitigation would be whether or not the improvements create unusual economic, legal, social, technological, physical, or other similar burdens and considerations. Caltrans LOS Guidelines Intersection Analysis The Caltrans published Guide for the Preparation of Traffic Impact Studies (dated December 2002) states the following: Caltrans endeavors to maintain a target LOS at the transition between LOS C and LOS D on State highway facilities, however, Caltrans acknowledges that this may not be always feasible and recommends that the lead agency consult with Caltrans to determine the appropriate target LOS. Mainline and Ramp Analysis The analysis evaluation criteria will be used to determine acceptable traffic operating conditions. According to the Interstate 80 and Capital City Freeway Corridor System Management Plan, Caltrans District 3, May 2009, Caltrans has identified level of service (LOS) F as the route concept LOS for I-80 within the study area. However, LOS E conditions are desired when feasible. Target LOS Threshold Consistent with the agencies policies, this study will consider LOS C as the standard acceptable threshold for all intersections in the jurisdiction of the City of Rocklin, LOS C as the standard acceptable threshold for all intersections in the jurisdiction of Caltrans, and LOS E for all mainline and ramp analysis. Sierra Gateway Apartments TIAR Page 9 The Ezralow Company, LLC R1783TIA008.docx
18 Table 3 presents the intersection, jurisdiction, and LOS threshold for each of the study intersection. TABLE 3 INTERSECTION LOS THRESHOLD AND JURISDICTION Intersection Jurisdiction LOS # 1 Sierra College Boulevard/Rocklin Road City of Rocklin C Sierra College Boulevard/Water Lily Lane - Cobblecreek 2 City of Rocklin C Circle 3 Rocklin Road/Rocklin Manor Drive (west entrance) City of Rocklin C 4 Rocklin Road/I-80 WB Ramps Caltrans C 5 Rocklin Road/I-80 EB Ramps Caltrans C 6 Sierra College Boulevard/I-80 EB Ramps Caltrans C 7 Sierra College Boulevard/I-80 WB Ramps Caltrans C Standards of Significance To measure whether transportation facilities operate acceptably, or are significantly impacted by the addition of project generated traffic, standards of significance policies were established for this study. Standards of significance policies establish level of service thresholds for acceptable/tolerable operations of transportation facilities, as well as the policies regarding what triggers a significant project impact. Significant Impact The project is considered to have a significant impact if any of the following criteria from Circular 212 Planning or HCM 2010 methodologies are met: Cause intersection operations to deteriorate to levels below the LOS C threshold (based on General Plan Policy C-10). If an intersection already operates below the LOS standard, an impact is considered significant if the proposed project would cause intersection operations to deteriorate by volume-to-capacity increases of at least 0.05, or average delay increases of at least 5 seconds for highway ramp intersections or unsignalized intersections Technical Analysis Parameters The Traffix 8.0 R1 (Dowling Associates), Synchro Version 9 (Trafficware) and Sim-Traffic software programs were used to quantify traffic operations throughout the network of study intersections. Peak hour factors (PHF) and heavy vehicle percentages (HV%) were obtained from the existing turning movement counts taken at the study intersections. Signal timings for the interchange intersections were provided by City. The PHF for freeway mainline segments is 0.92, and the HV% is 9% based on AADT data from Caltrans. Table 4 presents the technical analysis parameters used for this study. Sierra Gateway Apartments TIAR Page 10 The Ezralow Company, LLC R1783TIA008.docx
19 TABLE 4 TECHNICAL ANALYSIS PARAMETERS 1 Analysis Period - 15 Minutes Peah Hour Factor (PHF)- from counts for Existing conditions, 0.92 or higher for Year 2035 conditions. PHF 2 greater than 0.92 due to Existing counts showing PHF higher. 3 % Trucks: weekday peak hour analysis - from counts 4 Cycle Length - 80 sec min, 150 sec max (optimize signal timing) 5 Coordinated Cycle Length - obtained from City and Caltrans (optimize signal timing for Year 2035 conditions) 6 Total Lost Time Per Signal Phase - 4 seconds (24 sec max for 8-phase signal) 7 Pedestrian Speed ft/s and 10 mph for bicycles Existing Conditions Existing conditions analysis establishes the baseline traffic conditions. Existing conditions is the analysis scenario in which current operations is quantified at the study intersections. Intersection Operations For the Existing conditions analysis, no project-generated trips are added to the existing volumes at study intersection locations. This scenario analyzes the existing transportation setting at the study locations that have been previously identified under the existing roadway geometry, and quantifies the operations of study intersections based on delay, volume/capacity ratio (V/C) and LOS as defined in the Level of Service Methodologies and Policies section. Existing traffic operations have been quantified for the weekday AM and PM peak hour on the existing transportation system. Table 5 presents the results of the intersection LOS analysis, for both the AM peak hour and PM peak hour. TABLE 5 EXISTING INTERSECTION LEVEL OF SERVICE Control AM Peak Hour PM Peak Hour Target Delay or Delay or # Intersection Type 1,2 LOS V/C LOS Impact? V/C LOS Impact? 1 Sierra College Blvd/Rocklin Road Signal C 0.64 B C - 2 Sierra College Blvd/Water Lily Ln-Cobblecreek Circle TWSC C 14.0 B B - 3 Rocklin Road/Rocklin Manor Drive (West) TWSC C 13.3 B B - 4 Rocklin Road & I-80 WB Ramps Signal C 16.6 B D - 5 Rocklin Road & I-80 EB Ramps Signal C 26.9 C D - 6 Sierra College Blvd & I-80 EB Ramps Signal C 18.8 B C - 7 Sierra College Blvd & I-80 WB Ramps Signal C 22.7 C C - Notes: 1. Delay based on worst minor street approach for TWSC intersections, average of all approaches for Signal 2. Unsignalized and Sierra College interchange intersections analyzed using HCM methodologies instead of Circular 212. Rock lin Road interchange intersections analyzed using Sim-Traffic. 3. Bold text indicates exceedance of LOS standard. As shown in Table 5, the intersections of Rocklin Road/I-80 EB Ramps and Rocklin Road/I-80 WB Ramps currently operate at an unacceptable LOS in the PM peak hour. All other study intersections currently operate at acceptable LOS in both peak hours. Figure 2 presents the Existing intersection turning lane geometrics and traffic control for all study intersections. Sierra Gateway Apartments TIAR Page 11 The Ezralow Company, LLC R1783TIA008.docx
20
21 Ramp Operations Table 6 presents a summary of the Existing ramp merge, ramp diverge and freeway mainline operations. TABLE 6 EXISTING RAMP AND MAINLINE LEVEL OF SERVICE Target LOS Segment Type No. of Lanes AM Peak Hour PM Peak Hour Density Density Volume (pc/mi/ln) LOS Volume (pc/mi/ln) Interchange Location LOS I-80 at Rocklin Road I-80 EB South of Rocklin Road E Freeway 3 4, C 5, D I-80 EB Off Ramp E Diverge 1 1, C 1, D I-80 EB On Ramp E Merge B C I-80 WB Off Ramp E Diverge D C I-80 WB On Ramp E Merge C 1, C I-80 WB South of Rocklin Road E Freeway 3 4, D 4, C I-80 at Sierra College Boulevard I-80 EB South of Sierra College Boulevard E Freeway 3 2, B 4, C I-80 EB Off Ramp E Diverge C D I-80 EB On Ramp (Loop) E Merge B C I-80 EB On Ramp E Merge B D I-80 EB North of Sierra College Boulevard E Freeway 3 2, B 4, D I-80 WB North of Sierra College Boulevard E Freeway 3 4, D 3, C I-80 WB Off Ramp E Diverge C C I-80 WB On Ramp (Loop) E Merge C B I-80 WB On Ramp E Merge C C I-80 WB South of Sierra College Boulevard E Freeway 3 4, C 3, C As presented in Table 6, all mainline segments and ramps are currently operating at acceptable LOS. Historical Collision Data Historical collision data, as reported by Rocklin Police Department and other agencies, for a five year interval (January 2010 to December 2014) was obtained from the Statewide Integrated Traffic Records System (SWITRS). Table 7 provides the summary of the type of collision that occurred during the time period at the study intersections. TABLE 7 HISTORICAL COLLISION DATA AT STUDY INTERSECTIONS # Intersection 1 Sierra College Blvd/Rocklin Road Sierra College Blvd/Water Lily Ln Rocklin Road/Rocklin Manor Drive (West) Total Fatal Injury (Severe) Injury (Other Visible) Injury (Complaint of Pain) Property Damage Only As shown in Table 7, there were a total of 1 injury accident with other visible injuries, 8 injury accidents with complaint of pain, and 9 property damage only accidents. This would equate to less than 4 vehicle accidents per year. No accidents were recorded at the intersections of Sierra Sierra Gateway Apartments TIAR Page 13 The Ezralow Company, LLC R1783TIA008.docx
22 College Blvd/Water Lily Lane and Rocklin Road/Rocklin Manor Drive (West) where the project is projected to have access to and from the project site. Project Description The proposed project is located within the +/ acre parcel immediately southeast of the intersection of Rocklin Road/Sierra College Boulevard. Based on a review of the submitted site plan, the project is anticipated to construct an apartment complex with approximately 195 dwelling units. Access to the proposed project would be provided via two driveways. One driveway would be existing driveway (Rocklin Manor Drive) used by the residential development on the east along Rocklin Road. The second driveway will be on Water Lily Lane along Sierra College Boulevard. Within this report, the following two access scenarios are analyzed: Access on Water Lily Lane along Sierra College Boulevard will function as an emergency access only With outbound access from Water Lily Lane Roadway Improvement The project is responsible for creating a northbound right turn pocket on Sierra College Boulevard to Rocklin Road. Project Trip Generation Trip generation was developed using the Institute of Transportation Engineers Trip Generation Manual 9th Edition. Table 8 provides a summary of the land use, quantities, ITE land use code, and trip generation rates for AM and PM peak hours for the proposed project. TABLE 8 PROJECT TRIP GENERATION Daily Trip Unit 1 Rate/Unit 2 AM Peak Hour Trip Rate/Unit PM Peak Hour Trip Rate/Unit Land Use Category (ITE Code) Total In % Out % Total In % Out % Apartment (220) DU % 80% % 35% Quantity AM Peak Hour Trips PM Peak Hour Trips Daily Trips Project Name (Units) Total In Out Total In Out Rocklin Apartments 195 1, Net New Project Trips 1, Notes: 1. 1 k sf = 1,000 square feet DU = dwelling unit 2. Trip rates based on ITE Trip Generation Manual 9th edition average rates when equations are not mentioned As presented in Table 8, the proposed project is estimated to generate an additional 1,305 daily trips, 99 AM peak hour, and 125 PM peak hour trips. Of the 99 AM peak hour trips, 20 trips will be inbound and 79 trips will be outbound. Of the 125 PM peak hour, 81 trips will be inbound and 44 trips will be outbound. Project Trip Distribution and Assignment Trip distribution patterns from the project were estimated based on the knowledge of the existing traffic flow patterns, geographical location of the project site, area demographics, and locations of other similar destinations, etc. Sierra Gateway Apartments TIAR Page 14 The Ezralow Company, LLC R1783TIA008.docx
23 Figure 3 presents the projected directional trip distribution patterns for the proposed project generated trips. Existing Plus Project The Existing Plus Project condition is the analysis scenario in which traffic impacts associated with the proposed project are investigated in comparison to the Existing condition. Intersection Operations The Existing Plus Project condition was simulated by superimposing traffic generated by the proposed project onto Existing intersection volumes. This condition assumes access on Water Lily Lane along Sierra College Boulevard will function as an emergency access only. The resulting Existing Plus Project intersection traffic volumes are included in the Appendix. Table 9 presents a summary of the Existing Plus Project peak hour intersection LOS. TABLE 9 EXISTING PLUS PROJECT INTERSECTION LEVEL OF SERVICE Control AM Peak Hour Delay or V/C LOS Impact? PM Peak Hour Delay or V/C LOS Impact? # Intersection Type 1,2 1 Sierra College Blvd/Rocklin Road Signal C 0.65 B C - 2 Sierra College Blvd/Water Lily Ln-Cobblecreek Circle TWSC C 14.2 B B - 3 Rocklin Road/Rocklin Manor Drive (West) TWSC C 16.8 C B - 4 Rocklin Road & I-80 WB Ramps Signal C 17.4 B D No 5 Rocklin Road & I-80 EB Ramps Signal C 27.2 C D No 6 Sierra College Blvd & I-80 EB Ramps Signal C 20.1 C C - 7 Sierra College Blvd & I-80 WB Ramps Signal C 22.7 C C - Notes: 1. Delay based on worst minor street approach for TWSC intersections, average of all approaches for AWSC & Signal 2. Unsignalized and Sierra College interchange intersections analyzed using HCM methodologies instead of Circular 212. Rocklin Road interchange intersections analyzed using Sim-Traffic. 3. Bold text indicates exceedance of LOS standard. Target LOS As presented in Table 9, the intersections of Rocklin Road/I-80 EB Ramps and Rocklin Road/I- 80 WB Ramps are projected to operate at unacceptable LOS in the PM peak hour. The proposed project does not create a significant impact at the Rocklin Road/I-80 EB Ramps and Rocklin Road/I-80 WB Ramps as the increase in delay due to the project is less than 5 seconds at a signalized intersection that operates at unacceptable LOS in the no project condition. All other study intersections are projected to operate at acceptable LOS in both peak hours. Sierra Gateway Apartments TIAR Page 15 The Ezralow Company, LLC R1783TIA008.docx
24
25 Ramp Operations Table 10 provides a summary of the Existing Plus Project ramp merge, ramp diverge and freeway mainline operations. TABLE 10 EXISTING PLUS PROJECT RAMP AND MAINLINE LEVEL OF SERVICE Target LOS Segment Type No. of Lanes AM Peak Hour PM Peak Hour Density Density Volume (pc/mi/ln) LOS Volume (pc/mi/ln) Interchange Location LOS I-80 at Rocklin Road I-80 EB South of Rocklin Road E Freeway 3 4, C 5, D I-80 EB Off Ramp E Diverge 1 1, C 1, D I-80 EB On Ramp E Merge B C I-80 WB Off Ramp E Diverge D C I-80 WB On Ramp E Merge C 1, C I-80 WB South of Rocklin Road E Freeway 3 4, D 4, C I-80 at Sierra College Boulevard I-80 EB South of Sierra College Boulevard E Freeway 3 2, B 4, C I-80 EB Off Ramp E Diverge C D I-80 EB On Ramp (Loop) E Merge B C I-80 EB On Ramp E Merge B D I-80 EB North of Sierra College Boulevard E Freeway 3 2, B 4, D I-80 WB North of Sierra College Boulevard E Freeway 3 4, D 3, C I-80 WB Off Ramp E Diverge C C I-80 WB On Ramp (Loop) E Merge C B I-80 WB On Ramp E Merge C C I-80 WB South of Sierra College Boulevard E Freeway 3 4, C 3, C As presented in Table 10, all mainline segments and ramps are projected to operate at acceptable LOS under Existing Plus Project conditions. Existing Plus Project with Outbound Access from Water Lily Lane The Existing Plus Project with Outbound Access from Water Lily Lane condition is the analysis scenario in which traffic impacts associated with the proposed project are investigated in comparison to the Existing condition. Intersection Operations The Existing Plus Project with Outbound Access from Water Lily Lane condition was simulated by superimposing traffic generated by the proposed project onto Existing intersection volumes. This condition assumes outbound access from the project site to Water Lily Lane. The 15% outbound project traffic headed on eastbound Rocklin Road is not expected to use Water Lily Lane access due to the circuitous nature of the trip (head west on Water Lily Lane to northbound Sierra College Boulevard then eastbound Rocklin Road). The outbound trips on Water Lily Lane account for approximately 42% of the remaining 85% of outbound project traffic. This translates to 28 AM and 15 PM peak hour outbound project trips on Water Lily Lane. Sierra Gateway Apartments TIAR Page 17 The Ezralow Company, LLC R1783TIA008.docx
26 The resulting Existing Plus Project with Outbound Access from Water Lily Lane traffic volumes are included in the Appendix. Table 11 provides a summary of the Existing Plus Project with Outbound Access from Water Lily Lane peak hour intersection LOS. TABLE 11 EXISTING PLUS PROJECT WITH OUTBOUND ACCESS FROM WATER LILY LANE Control AM Peak Hour Delay or V/C LOS Impact? Delay or V/C LOS Impact? # Intersection Type 1,2 1 Sierra College Blvd/Rocklin Road Signal C 0.66 B C - 2 Sierra College Blvd/Water Lily Ln-Cobblecreek Circle TWSC C 14.9 B B - 3 Rocklin Road/Rocklin Manor Drive (West) TWSC C 15.9 C B - 4 Rocklin Road & I-80 WB Ramps Signal C 17.4 B D No 5 Rocklin Road & I-80 EB Ramps Signal C 27.2 C D No 6 Sierra College Blvd & I-80 EB Ramps Signal C 20.1 C C - 7 Sierra College Blvd & I-80 WB Ramps Signal C 22.7 C C - Notes: 1. Delay based on worst minor street approach for TWSC intersections, average of all approaches for AWSC & Signal 2. Unsignalized and Sierra College interchange intersections analyzed using HCM methodologies instead of Circular 212. Rock lin Road interchange intersections analyzed using Sim-Traffic. 3. Bold text indicates exceedance of LOS standard. Target LOS PM Peak Hour As presented in Table 11, the intersections of Rocklin Road/I-80 EB Ramps and Rocklin Road/I- 80 WB Ramps are projected to operate at unacceptable LOS in the PM peak hour. The proposed project does not create a significant impact at the Rocklin Road/I-80 EB Ramps and Rocklin Road/I-80 WB Ramps as the increase in delay due to the project is less than 5 seconds at a signalized intersection that operates at unacceptable LOS in the no project condition. All other study intersections are projected to operate at acceptable LOS in both peak hours. Short Term Conditions The Short Term condition is the analysis scenario in which project trips generated by approvedpending development and imminent roadway and intersection improvements are accounted for in the LOS quantifications. No roadway or intersection improvements have been assumed for the Short Term No Project condition. The project s obligation to create a right turn pocket from northbound Sierra College Boulevard to eastbound Rocklin Road is the only roadway and intersection improvement assumed in the Short Term Plus Project condition. Approved/Pending Projects The City of Rocklin has provided a list of projects within the vicinity of the proposed project that have been approved for construction. Vehicle trips for the approved project list were calculated based on appropriate trip generation rates from the ITE Trip General Manual (9th Edition). Table 12 provides the approved-pending project list, quantities, ITE land use code, and trip generation rates for AM and PM peak hours. Sierra Gateway Apartments TIAR Page 18 The Ezralow Company, LLC R1783TIA008.docx
27 TABLE 12 APPROVED-PENDING PROJECT TRIPS Daily Trip Rate/Unit 2 AM Peak Hour Trip Rate/Unit PM Peak Hour Trip Rate/Unit Land Use Category (ITE Code) Unit 1 Total In % Out % Total In % Out % Single Family Detached Housing (210) DU % 75% % 27% Shopping Center (820) KSF % 38% % 52% Quantity Daily AM Peak Hour Trips PM Peak Hour Trips Project Name 3 (Units) Trips Total In Out Total In Out Croftwood Unit 1 (210) 156 1, Rocklin 60 Residential (210) 179 1, Rocklin Meadows (210) Granite Bluff (210) Rocklin Commons (820) , , Rocklin Crossings (820) , , Center at Secret Ravine (820) 24 2, Net New Project Trips 34,071 1, ,058 1,531 1,527 Notes: 1. 1 KSF = 1,000 square feet DU = dwelling unit 2. Trip rates based on ITE Trip Generation Manual 9th edition average rates when equations are not mentioned It should be noted that the trips assumed in the Approved Plus Pending Project Trips table are conservative given that some of the projects in the table are now partly occupied (Croftwood Unit 1, Center at Secret Ravine, Rocklin Commons, and Rocklin Crossings) and the recent traffic counts will have picked up these trips. Approved/Pending Projects Trip Assignment and Distribution The following generalized trip distribution patterns assumed for the approved projects has been estimated based upon existing traffic flow patterns, geographical location of the project site and area demographics, etc. 40% trips using I-80 South west of Sierra College Blvd interchange 10% trips using I-80 North east of Sierra College Blvd interchange 20% trips using Sierra College Blvd north of I-80 interchange 6% trips using Sierra College Blvd south of Rocklin Road 10% trips using Rocklin Road west of Sierra College Blvd 4% trips using Rocklin Road east of Sierra College Blvd 3% trips using Granite Drive west of Sierra College Blvd 6% trips circulating internally between approved projects Short Term No Project Intersection Operation The Short Term No Project condition was simulated by superimposing new trips generated by the approved/pending projects over Existing base traffic volumes at the study intersections. The resulting Short Term No Project peak hour intersection traffic volumes are provided in the appendix. Short Term No Project intersection operations were quantified utilizing lane geometries and controls for the Short Term condition (same as Existing condition). Table 13 provides a summary of the Short Term No Project peak hour intersection LOS. Sierra Gateway Apartments TIAR Page 19 The Ezralow Company, LLC R1783TIA008.docx
28 TABLE 13 SHORT TERM NO PROJECT INTERSECTION LEVEL OF SERVICE Control AM Peak Hour Delay or V/C LOS Impact? Delay or V/C LOS Impact? # Intersection Type 1,2 1 Sierra College Blvd/Rocklin Road Signal C 0.69 B D - 2 Sierra College Blvd/Water Lily Ln-Cobblecreek Circle TWSC C 14.7 B C - 3 Rocklin Road/Rocklin Manor Drive (West) TWSC C 15.6 C B - 4 Rocklin Road & I-80 WB Ramps Signal C 18.1 B D - 5 Rocklin Road & I-80 EB Ramps Signal C 27.2 C E - 6 Sierra College Blvd & I-80 EB Ramps Signal C 21.5 C C - 7 Sierra College Blvd & I-80 WB Ramps Signal C 25.1 C C - Notes: 1. Delay based on worst minor street approach for TWSC intersections, average of all approaches for AWSC & Signal 2. Unsignalized and Sierra College interchange intersections analyzed using HCM methodologies instead of Circular 212. Rocklin Road interchange intersections analyzed using Sim-Traffic. 3. Bold text indicates exceedance of LOS standard. Target LOS PM Peak Hour As shown in Table 13, the intersections of Sierra College Boulevard/Rocklin Road, Rocklin Road/I-80 WB Ramps, and Rocklin Road/I-80 EB Ramps are projected to operate at unacceptable LOS in the PM peak hour. All other study intersections are projected to operate at acceptable LOS in both peak hours. Short Term No Project Ramp Operations Table 14 provides a summary of the Short Term No Project ramp merge, ramp diverge and freeway mainline operations. TABLE 14 SHORT TERM NO PROJECT RAMP AND MAINLINE LEVEL OF SERVICE Target LOS Segment Type No. of Lanes AM Peak Hour PM Peak Hour Density Density Volume (pc/mi/ln) LOS Volume (pc/mi/ln) Interchange Location LOS I-80 at Rocklin Road I-80 EB South of Rocklin Road E Freeway 3 4, C 5, D I-80 EB Off Ramp E Diverge 1 1, C 1, D I-80 EB On Ramp E Merge B C I-80 WB Off Ramp E Diverge D C I-80 WB On Ramp E Merge C 1, C I-80 WB South of Rocklin Road E Freeway 3 4, D 4, C I-80 at Sierra College Boulevard I-80 EB South of Sierra College Boulevard E Freeway 3 2, B 4, C I-80 EB Off Ramp E Diverge C D I-80 EB On Ramp (Loop) E Merge B C I-80 EB On Ramp E Merge B D I-80 EB North of Sierra College Boulevard E Freeway 3 2, B 4, D I-80 WB North of Sierra College Boulevard E Freeway 3 4, D 3, C I-80 WB Off Ramp E Diverge C C I-80 WB On Ramp (Loop) E Merge C B I-80 WB On Ramp E Merge C C I-80 WB South of Sierra College Boulevard E Freeway 3 4, C 3, C Sierra Gateway Apartments TIAR Page 20 The Ezralow Company, LLC R1783TIA008.docx
29 As shown in Table 14, all mainline segments and ramps are projected to operate at acceptable LOS under the Short Term No Project conditions. Short Term Plus Project Conditions The Short Term Plus Project condition is the analysis scenario in which traffic impacts associated with the proposed project are investigated in comparison to the Short Term No Project condition. With construction of the project, a northbound right turn pocket is analyzed as a project improvement at the intersection of Sierra College Boulevard/Rocklin Road. Intersection Operations Short Term Plus Project AM and PM intersection traffic operations were quantified by superimposing traffic generated by the proposed project onto Short Term No Project conditions. Table 15 provides a summary of the Short Term Plus Project peak hour intersection LOS. TABLE 15 SHORT TERM PLUS PROJECT INTERSECTION LEVEL OF SERVICE Control AM Peak Hour Delay or V/C LOS Impact? Delay or V/C LOS Impact? # Intersection Type 1,2 1 Sierra College Blvd/Rocklin Road Signal C 0.71 B D No 2 Sierra College Blvd/Water Lily Ln-Cobblecreek Circle TWSC C 14.8 B C - 3 Rocklin Road/Rocklin Manor Drive (West) TWSC C 17.8 C C - 4 Rocklin Road & I-80 WB Ramps Signal C 18.8 B D No 5 Rocklin Road & I-80 EB Ramps Signal C 28.5 C E No 6 Sierra College Blvd & I-80 EB Ramps Signal C 23.3 C C - 7 Sierra College Blvd & I-80 WB Ramps Signal C 25.1 C C - Notes: 1. Delay based on worst minor street approach for TWSC intersections, average of all approaches for AWSC & Signal 2. Unsignalized and Sierra College interchange intersections analyzed using HCM methodologies instead of Circular 212. Rocklin Road interchange intersections analyzed using Sim-Traffic. 3. Bold text indicates exceedance of LOS standard. Target LOS PM Peak Hour As shown in Table 15, the following study intersections are projected to operate at unacceptable LOS in the PM peak hour scenario of the Short Term Plus Project conditions: Sierra College Boulevard & Rocklin Road Rocklin Road & I-80 WB Ramps Rocklin Road & I-80 EB Ramps The proposed project does not create a significant impact at the intersection of Sierra College Boulevard/Rocklin Road as the V/C increase due to the project is less than 0.05 at a signalized intersection that operates at unacceptable LOS in the no project condition. The proposed project does not create a significant impact at the intersection of Rocklin Road/I- 80 WB Ramps as the increase in delay due to the project is less than 5 seconds at a signalized intersection that operates at unacceptable LOS in the no project condition. The proposed project does not create a significant impact at the intersection of Rocklin Road/I- 80 EB Ramps as the increase in delay due to the project is less than 5 seconds at a signalized intersection that operates at unacceptable LOS in the no project condition. Sierra Gateway Apartments TIAR Page 21 The Ezralow Company, LLC R1783TIA008.docx
30 All other study intersections are projected to operate at acceptable LOS in both peak hours. Ramp Operations Table 16 provides a summary of the Short Term Plus Project ramp merge, ramp diverge and freeway mainline operations. TABLE 16 SHORT TERM PLUS PROJECT RAMP AND MAINLINE LEVEL OF SERVICE Target LOS Segment Type No. of Lanes AM Peak Hour PM Peak Hour Density Density Volume (pc/mi/ln) LOS Volume (pc/mi/ln) Interchange Location LOS I-80 at Rocklin Road I-80 EB South of Rocklin Road E Freeway 3 4, C 5, D I-80 EB Off Ramp E Diverge 1 1, C 1, D I-80 EB On Ramp E Merge B C I-80 WB Off Ramp E Diverge D C I-80 WB On Ramp E Merge C 1, C I-80 WB South of Rocklin Road E Freeway 3 4, D 4, C I-80 at Sierra College Boulevard I-80 EB South of Sierra College Boulevard E Freeway 3 2, B 4, C I-80 EB Off Ramp E Diverge C D I-80 EB On Ramp (Loop) E Merge B C I-80 EB On Ramp E Merge B D I-80 EB North of Sierra College Boulevard E Freeway 3 2, B 4, D I-80 WB North of Sierra College Boulevard E Freeway 3 4, D 3, C I-80 WB Off Ramp E Diverge C C I-80 WB On Ramp (Loop) E Merge C B I-80 WB On Ramp E Merge C C I-80 WB South of Sierra College Boulevard E Freeway 3 4, C 3, C As presented in Table 16, all mainline segments and ramps are projected to operate at acceptable LOS under Short Term Plus Project conditions. Short Term Plus Project with Outbound Access from Water Lily Lane Intersection The Short Term Plus Project with Outbound Access from Water Lily Lane condition in which traffic impacts associated with the proposed project are investigated in comparison to the Short Term No Project condition. With construction of the project, a northbound right turn pocket is analyzed as a project improvement at the intersection of Sierra College Boulevard/Rocklin Road. Intersection Operations The Short Term Plus Project with Outbound Access from Water Lily Lane condition was simulated by superimposing traffic generated by the proposed project onto Short Term No Project intersection volumes. This scenario includes the outbound access from the project site to Water Lily Lane. The 15% outbound project traffic headed on eastbound Rocklin Road is not expected to use Water Lily Lane access due to the circuitous nature of the trip (head west on Sierra Gateway Apartments TIAR Page 22 The Ezralow Company, LLC R1783TIA008.docx
31 Water Lily Lane to northbound Sierra College Boulevard then eastbound Rocklin Road). The outbound trips on Water Lily Lane account for approximately 42% of the remaining 85% of outbound project traffic. This translates to 28 AM and 15 PM peak hour outbound project trips on Water Lily Lane. The resulting Short Term Plus Project with Outbound Access from Water Lily Lane traffic volumes are included in the Appendix. Table 17 provides a summary of the Short Term Plus Project with Outbound Access from Water Lily Lane peak hour intersection LOS. TABLE 17 SHORT TERM PLUS PROJECT WITH OUTBOUND ACCESS FROM WATER LILY LANE INTERSECTION LOS Control AM Peak Hour Delay or V/C LOS Impact? Delay or V/C LOS Impact? # Intersection Type 1,2 1 Sierra College Blvd/Rocklin Road Signal C 0.71 C E No 2 Sierra College Blvd/Water Lily Ln-Cobblecreek Circle TWSC C 15.6 C C - 3 Rocklin Road/Rocklin Manor Drive (West) TWSC C 16.9 C C - 4 Rocklin Road & I-80 WB Ramps Signal C 18.8 B D No 5 Rocklin Road & I-80 EB Ramps Signal C 28.5 C E No 6 Sierra College Blvd & I-80 EB Ramps Signal C 23.3 C C - 7 Sierra College Blvd & I-80 WB Ramps Signal C 25.1 C C - Notes: 1. Delay based on worst minor street approach for TWSC intersections, average of all approaches for AWSC & Signal 2. Unsignalized and Sierra College interchange intersections analyzed using HCM methodologies instead of Circular 212. Rocklin Road interchange intersections analyzed using Sim-Traffic. 3. Bold text indicates exceedance of LOS standard. Target LOS PM Peak Hour As shown in Table 17, the following study intersections are projected to operate at unacceptable level of service for the PM peak hour of the Short Term Plus Project conditions: Sierra College Boulevard & Rocklin Road Rocklin Road & I-80 WB Ramps Rocklin Road & I-80 EB Ramps The proposed project does not create a significant impact at the intersection of Sierra College Boulevard/Rocklin Road as the V/C increase due to the project is less than 0.05 at a signalized intersection that operates at unacceptable LOS in the no project condition. The proposed project does not create a significant impact at the intersection of Rocklin Road/I- 80 WB Ramps as the increase in delay due to the project is less than 5 seconds at a signalized intersection that operates at unacceptable LOS in the no project condition. The proposed project does not create a significant impact at the intersection of Rocklin Road/I- 80 EB Ramps as the increase in delay due to the project is less than 5 seconds at a signalized intersection that operates at unacceptable LOS in the no project condition. All other study intersections are projected to operate at acceptable LOS in both peak hours. The addition of project traffic is projected to extend the vehicle queues by one or two vehicles and is not considered to be significant at the Rocklin Road interchange intersections. Sierra Gateway Apartments TIAR Page 23 The Ezralow Company, LLC R1783TIA008.docx
32 Cumulative (Year 2030) Conditions The Cumulative condition is the scenario approximately 15 years in the future. For this study, the Cumulative condition corresponds to the build-out scenario of City of Rocklin and resulting growth in both population and traffic volumes. The build-out uses are consistent with the land uses assumed in City of Rocklin General Plan. The Cumulative year for analysis in this report is assumed to by the Year Year 2030 No Project condition assumes that the proposed project remains undeveloped notwithstanding all other General Plan land uses being developed elsewhere. Year 2030 Plus Project condition in which traffic impacts associated with the proposed project are investigated in comparison to the Year 2030 No Project condition. Planned/Programmed Improvements Rocklin Road Widening The City of Rocklin General Plan Circulation Element (October 2012) calls for Rocklin Road to maintain the existing two-way left turn lane from the Loomis Town limits to east of Sierra College Boulevard. The General Plan also states, Rocklin Road will be widened to six (6) lanes from east of Sierra College Boulevard and I-80 interchange to west of Granite Drive. Sierra College Boulevard Widening The City of Rocklin General Plan Circulation Element (October 2012) calls for Sierra College Boulevard to be widened to accommodate six lanes between Roseville City Limits and Taylor Road by Rocklin Road/Sierra College Boulevard Intersections Modification Based on discussions with the City and consistent with the traffic analysis performed for the City of Rocklin General Plan EIR, the following lane geometrics are assumed to be in place at the Rocklin Road/Sierra College Boulevard intersection under Year 2030 No Project and Year 2030 Plus Project conditions. Eastbound approach - One (1) free right lane Northbound approach - One (1) additional through lane. One additional receiving lane will also need to be added on southbound approach Other Study Intersections Modification All other study intersection that fall on Sierra College Boulevard will have three through lanes for northbound and southbound movements. Figure 4 shows the lane geometrics and control for Cumulative and Cumulative Plus Project conditions. Year 2030 No Project Traffic Volumes Year 2030 condition was developed using the City of Rocklin Travel Demand Model which is nested within the larger Placer County Travel Demand Model. The Placer County TDM not only includes Placer County, but also the Sacramento region. Therefore, the model captures the Sierra Gateway Apartments TIAR Page 24 The Ezralow Company, LLC R1783TIA008.docx
33 inter-regional travel demand and its impact within the City of Rocklin. The resulting Year 2030 No Project traffic volumes are presented in the Appendix. Intersection Operations Table 18 provides a summary of the Year 2030 No Project peak hour intersection LOS. TABLE 18 YEAR 2030 NO PROJECT INTERSECTION LEVEL OF SERVICE Control AM Peak Hour Delay or V/C LOS Impact? Delay or V/C LOS Impact? # Intersection Type 1,2 1 Sierra College Blvd/Rocklin Road Signal C 0.92 E E - 2 Sierra College Blvd/Water Lily Ln-Cobblecreek Circle TWSC C 18.6 C C - 3 Rocklin Road/Rocklin Manor Drive (West) TWSC C 14.1 B C - 4 Rocklin Road & I-80 WB Ramps Signal C 41.3 D E - 5 Rocklin Road & I-80 EB Ramps Signal C 66.8 E F - 6 Sierra College Blvd & I-80 EB Ramps Signal C 77.4 E C - 7 Sierra College Blvd & I-80 WB Ramps Signal C 39.4 D C - Notes: 1. Delay based on worst minor street approach for TWSC intersections, average of all approaches for AWSC & Signal 2. Unsignalized and Sierra College interchange intersections analyzed using HCM methodologies instead of Circular 212. Rocklin Road interchange intersections analyzed using Sim-Traffic. 3. Bold text indicates exceedance of LOS standard. Target LOS PM Peak Hour As shown in Table 18, all study intersections, except the intersections listed below, are projected to operate at or above the threshold LOS: Sierra College Boulevard/Rocklin Road - AM and PM peak hours Rocklin Road/Interstate 80 WB Ramps AM and PM peak hours Rocklin Road/Interstate 80 EB Ramps - AM and PM peak hours Sierra College Boulevard/Interstate 80 EB Ramps - AM peak hour Sierra College Boulevard/Interstate 80 WB Ramps - AM peak hour Sierra Gateway Apartments TIAR Page 25 The Ezralow Company, LLC R1783TIA008.docx
34 Ramp Operations Table 19 provides a summary of the Year 2030 No Project ramp merge, diverge and freeway mainline operations. TABLE 19 YEAR 2030 NO PROJECT RAMP AND MAINLINE LEVEL OF SERVICE Target LOS Segment Type No. of Lanes AM Peak Hour PM Peak Hour Density Density Volume (pc/mi/ln) LOS Volume (pc/mi/ln) Interchange Location LOS I-80 at Rocklin Road I-80 EB South of Rocklin Road E Freeway 3 5, E 6, E I-80 EB Off Ramp E Diverge 1 1, D 1, D I-80 EB On Ramp E Merge C D I-80 WB Off Ramp E Diverge E D I-80 WB On Ramp E Merge D 1, D I-80 WB South of Rocklin Road E Freeway 3 5, E 5, E I-80 at Sierra College Boulevard I-80 EB South of Sierra College Boulevard E Freeway 3 4, C 5, E I-80 EB Off Ramp E Diverge 1 1, D E I-80 EB On Ramp (Loop) E Merge B D I-80 EB On Ramp E Merge B D I-80 EB North of Sierra College Boulevard E Freeway 3 3, C 5, E I-80 WB North of Sierra College Boulevard E Freeway 3 6, E 4, D I-80 WB Off Ramp E Diverge 1 1, E D I-80 WB On Ramp (Loop) E Merge C C I-80 WB On Ramp E Merge D C I-80 WB South of Sierra College Boulevard E Freeway 3 5, D 4, D As presented in Table 19, all mainline segments and ramps are projected to operate at acceptable LOS under Year 2030 No Project condition. Sierra Gateway Apartments TIAR Page 26 The Ezralow Company, LLC R1783TIA008.docx
35
36 Year 2030 Plus Project Year 2030 Plus Project condition is the analysis scenario in which traffic impacts associated with the proposed project are investigated in comparison to the Year 2030 No Project condition. Intersection Operations Year 2030 Plus Project condition was simulated by superimposing traffic generated by the proposed project onto Year 2030 No Project intersection volumes. This condition assumes access on Water Lily Lane along Sierra College Boulevard will function as an emergency access only. The resulting Year 2030 Plus Project intersection traffic volumes are included in the Appendix. Table 20 provides a summary of the Year 2030 Plus Project peak hour intersection LOS. TABLE 20 YEAR 2030 PLUS PROJECT INTERSECTION LEVEL OF SERVICE Control AM Peak Hour Delay or V/C LOS Impact? Delay or V/C LOS Impact? # Intersection Type 1,2 1 Sierra College Blvd/Rocklin Road Signal C 0.93 E No 0.93 E No 2 Sierra College Blvd/Water Lily Ln-Cobblecreek Circle TWSC C 18.7 C C - 3 Rocklin Road/Rocklin Manor Drive (West) TWSC C 16.9 C C - 4 Rocklin Road & I-80 WB Ramps Signal C 42.4 D No 82.5 F Yes 5 Rocklin Road & I-80 EB Ramps Signal C 71.9 E No F Yes 6 Sierra College Blvd & I-80 EB Ramps Signal C 79.7 E No 31.0 C - 7 Sierra College Blvd & I-80 WB Ramps Signal C 39.5 D No 32.2 C - Notes: 1. Delay based on worst minor street approach for TWSC intersections, average of all approaches for AWSC & Signal 2. Unsignalized and Sierra College interchange intersections analyzed using HCM methodologies instead of Circular 212. Rocklin Road interchange intersections analyzed using Sim-Traffic. 3. Bold text indicates exceedance of LOS standard. Target LOS PM Peak Hour As shown in Table 20, all study intersections, except the intersections listed below, are projected to operate at or above the threshold LOS: Sierra College Boulevard/Rocklin Road - AM and PM peak hours Rocklin Road/Interstate 80 WB Ramps - AM and PM peak hours Rocklin Road/Interstate 80 EB Ramps - AM and PM peak hours Sierra College Boulevard/Interstate 80 EB Ramps - AM peak hour Sierra College Boulevard/Interstate 80 WB Ramps - AM peak hour Sierra College Boulevard/Rocklin Road Intersection The proposed project does not create a significant impact at the intersection of Sierra College Boulevard/Rocklin Road as the V/C increase due to the project is less than 0.05 at a signalized intersection that operates at unacceptable LOS in the no project condition. As noted previously, the GP EIR forecasted LOS E conditions at the intersection of Sierra College Boulevard/Rocklin Road in the Cumulative conditions (Table ). Page identifies a mitigation measure (eastbound free right turn lane and westbound right turn lane) and a southbound free right turn lane that would result in acceptable LOS operations at this Sierra Gateway Apartments TIAR Page 28 The Ezralow Company, LLC R1783TIA008.docx
37 intersection. The southbound free right turn lane is needed to mitigate the AM peak hour and was not identified in the GP EIR because the AM peak hour was not analyzed. Sierra College Boulevard/Interstate 80 EB Ramps Intersection The proposed project does not create a significant impact at the intersection of Sierra College Boulevard/I-80 EB Ramps as the increase in delay due to the project is less than 5 seconds at a signalized intersection that operates at unacceptable LOS in the no project condition. A potential improvement to bring the intersection to acceptable LOS C in both the AM and PM peak hours would be the construction of an eastbound free-right turn lane. Sierra College Boulevard/Interstate 80 WB Ramps Intersection The proposed project does not create a significant impact at the intersection of Sierra College Boulevard/I-80 WB Ramps as the increase in delay due to the project is less than 5 seconds at a signalized intersection that operates at unacceptable LOS in the no project condition. A potential improvement to bring the intersection to acceptable LOS C in both the AM and PM peak hours would be to convert the eastbound and westbound approaches to split phasing. Rocklin Road Interchange Intersections The proposed project creates a significant impact at the intersections of Rocklin Road/Interstate 80 WB Ramps and Rocklin Road/Interstate 80 EB Ramps as the delay increase due to the project is more than 5 seconds at a signalized intersection that operates at unacceptable LOS in the no project condition in the PM peak hour. In the PM peak hour, the project is expected to add 32 vehicles per hour (vph) to the Rocklin Road/Interstate 80 WB Ramps and 44 vehicles to the Rocklin Road/Interstate 80 EB Ramps. The addition of the project traffic results in an increase of 12 seconds of delay at the Rocklin Road/Interstate 80 WB Ramps intersection and an increase of 13 seconds delay at the Rocklin Road/Interstate 80 EB Ramps intersection. The GP EIR also forecasted unacceptable LOS conditions at the Rocklin Road interchange intersections in the cumulative conditions (Table ). The following is quoted from Pages and of the GP EIR: The City s decision to include highway interchange and ramp intersections in its CIP is consistent with the Caltrans policy that has encouraged local and private funding of state highway improvements for the past 20 years (Caltrans 2004, pg ). Caltrans notes that projects constructed on the state highway system that are sponsored by a city, county, local transportation authority, local transit agency, or private entity generally use local or private funding. Thus, the City s CIP, SPRTA, and Highway 65 Interchange Improvement fee programs are consistent with the Caltrans policy, which encourages local agencies to develop and implement local funding programs that supplement federal and state funding programs to meet their current and future transportation needs. The City s decision to include highway interchange and ramp intersections in its CIP is also consistent with the Caltrans policy that compels the local or private entities sponsoring state highway system projects to be responsible for the construction contract administration when such projects are financed with local and private funds (Caltrans 2004). Sierra Gateway Apartments TIAR Page 29 The Ezralow Company, LLC R1783TIA008.docx
38 However, while the City has policies and traffic impact fees currently in place that are expected to help reduce impacts to highway ramp intersections, the City does not have the complete jurisdiction, authority, or capability to fund implementation of improvements to highway ramp intersections. Since mitigation of this impact is outside of the City s control, the impact is considered to be significant and unavoidable. This is consistent with the findings of the GP EIR. There are several technically feasible alternatives for mitigating future, cumulative traffic impacts at the Rocklin Road/I-80 intersection so that it will operate at acceptable levels of service. These potential alternatives are discussed in the following section. Rocklin Road Interchange Improvement Alternatives Consistent with the City of Rocklin General Plan, the impact to the Rocklin Road Interchange is considered to be significant and unavoidable. Subsequent reports have presented alternatives for the Rocklin Road Interchange that would provide acceptable operations. The LOS worksheets are provided in the appendix of this report for the following alternatives: Alternative 1 - Flyover (Westbound Rocklin Road to WB Interstate 80) Alternative 2 - Roundabouts on Rocklin Road Alternative 3 - Replacement Diamond Alternative 1 would consist of a flyover structure from westbound Rocklin Road to Interstate 80. This would alleviate traffic congestion on westbound Rocklin Road and at the intersection of Rocklin Road/I-80 WB Ramps. This alternative would require additional right-of-way and modification of existing roadways, bridges, and ramps. This alternative would provide LOS C or better conditions at the intersection of Rocklin Road/I-80 WB Ramps and the intersection of Rocklin Road/I-80 EB Ramps. Alternative 2 would consist of multi-lane roundabouts at the intersections of Rocklin Road/I-80 WB Ramps, Rocklin Road/I-80 EB Ramps, and Rocklin Road/Aguilar Road. Roundabouts would allow uninterrupted flow of traffic and reduced queuing along Rocklin Road while providing access to freeway ramps. This alternative would require additional right-of-way, ramp widening, lengthening, and metering, and a shared-use path along Rocklin Road underneath the interstate. This alternative would provide LOS B at the intersection of Rocklin Road/I-80 WB Ramps and LOS B at the intersection of Rocklin Road/I-80 EB Ramps. Alternative 3 would consist of a replacement diamond for the undercrossing at I-80. This alternative would require additional right-of-way, lengthening of the freeway structure for additional lanes, and modification to the I-80 WB and EB Ramps. The mainline would be raised approximately one foot to meet current standard vertical clearance for the Rocklin Road undercrossing. This alternative would provide LOS C or better conditions at the intersections of Rocklin Road/I-80 WB Ramps and Rocklin Road/I-80 EB Ramps. The City and Caltrans are still in the planning stages of evaluating these alternatives. Unless and until a particular plan is developed and approved, this cumulative impact is assumed to be significant and unavoidable. It would not be feasible to require the present Project to mitigate this cumulative impact in light of the following considerations: (1) These intersections will operate at LOS F regardless of whether the Project is approved, and the Project only contributes a small percentage to the cumulative impact; (2) This intersection is outside of the control of both the City and the applicant; (3) The decision and planning of whether and how to Sierra Gateway Apartments TIAR Page 30 The Ezralow Company, LLC R1783TIA008.docx
39 improve the future operation of this intersection depends on future discussions and agreements between City and Caltrans. Ramp Operations Table 21 provides a summary of the Year 2030 Plus Project ramp merge, ramp diverge and freeway mainline operations. TABLE 21 YEAR 2030 PLUS PROJECT RAMP AND MAINLINE LEVEL OF SERVICE Target LOS Segment Type No. of Lanes AM Peak Hour PM Peak Hour Density Density Volume (pc/mi/ln) LOS Volume (pc/mi/ln) Interchange Location LOS I-80 at Rocklin Road I-80 EB South of Rocklin Road E Freeway 3 5, D 5, E I-80 EB Off Ramp E Diverge 1 1, D C I-80 EB On Ramp E Merge C D I-80 WB Off Ramp E Diverge E D I-80 WB On Ramp E Merge D 1, D I-80 WB South of Rocklin Road E Freeway 3 5, E 5, E I-80 at Sierra College Boulevard I-80 EB South of Sierra College Boulevard E Freeway 3 3, C 5, E I-80 EB Off Ramp E Diverge 1 1, D E I-80 EB On Ramp (Loop) E Merge B D I-80 EB On Ramp E Merge B D I-80 EB North of Sierra College Boulevard E Freeway 3 3, C 5, E I-80 WB North of Sierra College Boulevard E Freeway 3 6, E 4, D I-80 WB Off Ramp E Diverge 1 1, E D I-80 WB On Ramp (Loop) E Merge C C I-80 WB On Ramp E Merge D C I-80 WB South of Sierra College Boulevard E Freeway 3 5, D 4, D As presented in Table 21, all mainline segments and ramps are projected to operate at acceptable LOS under Year 2030 Plus Project condition. Year 2030 Plus Project with Outbound Access from Water Lily Lane Intersection The Year 2030 Plus Project with Outbound Access from Water Lily Lane condition in which traffic impacts associated with the proposed project are investigated in comparison to the Year 2030 No Project condition. Intersection Operations The Year 2030 Plus Project with Outbound Access from Water Lily Lane condition was simulated by superimposing traffic generated by the proposed project onto Year 2030 No Project intersection volumes. This scenario includes the outbound access from the project site to Water Lily Lane. The 15% outbound project traffic headed on eastbound Rocklin Road is not expected to use Water Lily Lane access due to the circuitous nature of the trip (head west on Water Lily Lane to northbound Sierra College Boulevard then eastbound Rocklin Road). The Sierra Gateway Apartments TIAR Page 31 The Ezralow Company, LLC R1783TIA008.docx
40 outbound trips on Water Lily Lane account for approximately 42% of the remaining 85% of outbound project traffic. This translates to 28 AM and 15 PM peak hour outbound project trips on Water Lily Lane. The resulting Year 2030 Plus Project with Outbound Access from Water Lily Lane traffic volumes are included in the Appendix. Table 22 provides a summary of the Year 2030 Plus Project with Outbound Access from Water Lily Lane peak hour intersection LOS. TABLE 22 YEAR 2030 PLUS PROJECT WITH OUTBOUND ACCESS FROM WATER LILY LANE INTERSECTION LOS Control AM Peak Hour Delay or V/C LOS Impact? Delay or V/C LOS Impact? # Intersection Type 1,2 1 Sierra College Blvd/Rocklin Road Signal C 0.93 E No 0.93 E No 2 Sierra College Blvd/Water Lily Ln-Cobblecreek Circle TWSC C 18.7 C C - 3 Rocklin Road/Rocklin Manor Drive (West) TWSC C 16.9 C C - 4 Rocklin Road & I-80 WB Ramps Signal C 42.4 D No 82.5 F Yes 5 Rocklin Road & I-80 EB Ramps Signal C 71.9 E No F Yes 6 Sierra College Blvd & I-80 EB Ramps Signal C 79.7 E No 31.0 C - 7 Sierra College Blvd & I-80 WB Ramps Signal C 39.5 D No 32.2 C - Notes: 1. Delay based on worst minor street approach for TWSC intersections, average of all approaches for AWSC & Signal 2. Unsignalized and Sierra College interchange intersections analyzed using HCM methodologies instead of Circular 212. Rocklin Road interchange intersections analyzed using Sim-Traffic. 3. Bold text indicates exceedance of LOS standard. Target LOS PM Peak Hour As shown in Table 22, all study intersection, except the intersections listed below, are projected to operate at or above the threshold LOS: Sierra College Boulevard/Rocklin Road - AM and PM peak hours Rocklin Road/Interstate 80 WB Ramps - AM and PM peak hours Rocklin Road/Interstate 80 EB Ramps - AM and PM peak hours Sierra College Boulevard/Interstate 80 EB Ramps - AM peak hour Sierra College Boulevard/Interstate 80 WB Ramps - AM peak hour Sierra College Boulevard/Rocklin Road Intersection The proposed project does not create a significant impact at the intersection of Sierra College Boulevard/Rocklin Road as the V/C increase due to the project is less than 0.05 at a signalized intersection that operates at unacceptable LOS in the no project condition. As noted previously, the GP EIR forecasted LOS E conditions at the intersection of Sierra College Boulevard/Rocklin Road in the Cumulative conditions (Table ). Page identifies a mitigation measure (eastbound free right turn lane and westbound right turn lane) and a southbound free right turn lane that would result in acceptable LOS operations at this intersection. The southbound free right turn lane is needed to mitigate the AM peak hour and was not identified in the GP EIR because the AM peak hour was not analyzed. Sierra College Boulevard/Interstate 80 EB Ramps Intersection The proposed project does not create a significant impact at the intersection of Sierra College Boulevard/Interstate 80 EB Ramps as the delay increase due to the project is less than 5 Sierra Gateway Apartments TIAR Page 32 The Ezralow Company, LLC R1783TIA008.docx
41 seconds at a signalized intersection that operates at unacceptable LOS in the no project condition. A potential improvement to bring the intersection to acceptable LOS C in both the AM and PM peak hours would be the construction of an eastbound free-right turn lane. Sierra College Boulevard/Interstate 80 WB Ramps Intersection The proposed project does not create a significant impact at the intersection of Sierra College Boulevard/Interstate 80 WB Ramps as the delay increase due to the project is less than 5 seconds at a signalized intersection that operates at unacceptable LOS in the no project condition. A potential improvement to bring the intersection to acceptable LOS C in both the AM and PM peak hours would be to convert the eastbound and westbound approaches to split phasing. Rocklin Road Interchange Intersections The proposed project does create a significant impact at the intersections of Rocklin Road/Interstate 80 WB Ramps and Rocklin Road/Interstate 80 EB Ramps as the delay increase due to the project is more than 5 seconds at a signalized intersection that operates at unacceptable LOS in the no project condition in the PM peak hour. In the PM peak hour, the project is expected to add 32 vehicles per hour (vph) to the Rocklin Road/Interstate 80 WB Ramps and 44 vehicles to the Rocklin Road/Interstate 80 EB Ramps. The addition of the project traffic results in an increase of 12 seconds of delay at the Rocklin Road/Interstate 80 WB Ramps intersection and an increase of 13 seconds delay at the Rocklin Road/Interstate 80 EB Ramps intersection. The GP EIR also forecasted unacceptable LOS conditions at the Rocklin Road interchange intersections in the cumulative conditions (Table ). The following is quoted from Pages and of the GP EIR: The City s decision to include highway interchange and ramp intersections in its CIP is consistent with the Caltrans policy that has encouraged local and private funding of state highway improvements for the past 20 years (Caltrans 2004, pg ). Caltrans notes that projects constructed on the state highway system that are sponsored by a city, county, local transportation authority, local transit agency, or private entity generally use local or private funding. Thus, the City s CIP, SPRTA, and Highway 65 Interchange Improvement fee programs are consistent with the Caltrans policy, which encourages local agencies to develop and implement local funding programs that supplement federal and state funding programs to meet their current and future transportation needs. The City s decision to include highway interchange and ramp intersections in its CIP is also consistent with the Caltrans policy that compels the local or private entities sponsoring state highway system projects to be responsible for the construction contract administration when such projects are financed with local and private funds (Caltrans 2004). However, while the City has policies and traffic impact fees currently in place that are expected to help reduce impacts to highway ramp intersections, the City does not have the complete Sierra Gateway Apartments TIAR Page 33 The Ezralow Company, LLC R1783TIA008.docx
42 jurisdiction, authority, or capability to fund implementation of improvements to highway ramp intersections. Since mitigation of this impact is outside of the City s control, the impact is considered to be significant and unavoidable. This is consistent with the findings of the GP EIR. Rocklin Road Interchange Improvement Alternatives. There are several technically feasible alternatives for mitigating future cumulative traffic impacts at the Rocklin Road/I-80 intersection so that it will operate at acceptable levels of service. These potential alternatives are discussed in the following section. Rocklin Road Interchange Improvement Alternatives Consistent with the City of Rocklin General Plan, the impact to the Rocklin Road Interchange is considered to be significant and unavoidable. Subsequent reports have presented alternatives for the Rocklin Road Interchange that would provide acceptable operations. The LOS worksheets are provided in the appendix of this report for the following alternatives: Alternative 1 - Flyover (Westbound Rocklin Road to WB Interstate 80) Alternative 2 - Roundabouts on Rocklin Road Alternative 3 - Replacement Diamond Alternative 1 would consist of a flyover structure from westbound Rocklin Road to Interstate 80. This would alleviate traffic congestion on westbound Rocklin Road and at the intersection of Rocklin Road/I-80 WB Ramps. This alternative would require additional right-of-way and modification of existing roadways, bridges, and ramps. This alternative would provide LOS C or better conditions at the intersection of Rocklin Road/I-80 WB Ramps and the intersection of Rocklin Road/I-80 EB Ramps. Alternative 2 would consist of multi-lane roundabouts at the intersections of Rocklin Road/I-80 WB Ramps, Rocklin Road/I-80 EB Ramps, and Rocklin Road/Aguilar Road. Roundabouts would allow uninterrupted flow of traffic and reduced queuing along Rocklin Road while providing access to freeway ramps. This alternative would require additional right-of-way, ramp widening, lengthening, and metering, and a shared-use path along Rocklin Road underneath the interstate. This alternative would provide LOS B at the intersection of Rocklin Road/I-80 WB Ramps and LOS B at the intersection of Rocklin Road/I-80 EB Ramps. Alternative 3 would consist of a replacement diamond for the undercrossing at I-80. This alternative would require additional right-of-way, lengthening of the freeway structure for additional lanes, and modification to the I-80 WB and EB Ramps. The mainline would be raised approximately one foot to meet current standard vertical clearance for the Rocklin Road undercrossing. This alternative would provide LOS C or better conditions at the intersections of Rocklin Road/I-80 WB Ramps and Rocklin Road/I-80 EB Ramps. The City and Caltrans are still in the planning stages of evaluating these alternatives. Unless and until a particular plan is developed and approved, this cumulative impact is assumed to be significant and unavoidable. It would not be feasible to require the present Project to mitigate this cumulative impact in light of the following considerations: (1) These intersections will operate at LOS F regardless of whether the Project is approved, and the Project only contributes a small percentage to the cumulative impact; (2) This intersection is outside of the control of both the City and the applicant; (3) The decision and planning of whether and how to improve the future operation of this intersection depends on future discussions and agreements between City and Caltrans. Sierra Gateway Apartments TIAR Page 34 The Ezralow Company, LLC R1783TIA008.docx
43 The proposed project is anticipated to pay both City and Regional Fees. Project Site Access - Focused Analysis Access to the proposed project would be provided via one driveway via the existing westernmost driveway at Rocklin Manor Drive shared with the residential development on the east along Rocklin Road. Table 23 shows the projected traffic volumes, delay, LOS, and queue lengths for Existing, Short Term, and Cumulative conditions, with and without the project. The queue lengths were determined assuming 25 feet per vehicle. Rocklin Rd at Rocklin Manor Drive/Project Access NB Approach Volume TABLE 23 PROJECT SITE ACCESS SUMMARY TABLE AM Peak Hour Delay Queue Available Delay Queue Available (vph) (sec/veh) LOS Length (ft) Storage Storage? (vph) (sec/veh) LOS Length (ft) Storage Storage? Existing Conditions B YES B YES Existing Plus Project Conditions C YES B YES Existing Plus Project Conditions with Outbound Access from Water Lily Lane C YES B YES Short Term No Project Conditions C YES B YES Short Term Plus Project Conditions C YES C YES Short Term Plus Project Conditions with Outbound Access from Water Lily Lane C YES C YES Cumulative No Project Conditions B YES C YES Cumulative Plus Project Conditions C YES C YES Cumulative Plus Project Conditions with Outbound Access from Water Lily Lane C YES C YES Note: 25 ft. assumed vehicle length for stacking and queues Is Queue within NB Approach Volume PM Peak Hour The vehicles using the project site access are predominantly associated with the proposed project. As shown in Table 23, the northbound site access at Rocklin Road and Rocklin Manor Drive will have acceptable LOS and queue lengths during the AM and PM peak periods under the Existing Plus Project, Short Term Plus Project and Cumulative Plus Project for both access scenario conditions. Is Queue within Sierra Gateway Apartments TIAR Page 35 The Ezralow Company, LLC R1783TIA008.docx
44 Appendix Traffix LOS Worksheets Synchro LOS Worksheets HCS Worksheets Sierra Gateway Apartments TIAR Page 36 The Ezralow Company, LLC R1783TIA007.docx
45 Traffix LOS Worksheets Sierra Gateway Apartments TIAR Page 37 The Ezralow Company, LLC R1783TIA007.docx
46 EX_am.TXT Intersection #1 Rocklin Road/ Sierra College Cycle (sec): 100 Critical Vol./Cap.(X): Loss Time (sec): 16 Average Delay (sec/veh): xxxxxx Optimal Cycle: 78 Level Of Service: B Street Name: Rocklin Road Sierra College Approach: North Bound South Bound East Bound West Bound Movement: L - T - R L - T - R L - T - R L - T - R Control: Protected Protected Protected Protected Rights: Include Include Include Include Min. Green: Y+R: Lanes: Volume Module: Base Vol: Growth Adj: Initial Bse: User Adj: PHF Adj: PHF Volume: Reduct Vol: Reduced Vol: PCE Adj: MLF Adj: FinalVolume: Saturation Flow Module: Sat/Lane: Adjustment: Lanes: Final Sat.: Capacity Analysis Module: Vol/Sat: Crit Volume: Crit Moves: **** **** **** **** Traffix (c) 2008 Dowling Assoc. Licensed to OMNI-MEANS, ROSEVILLE,CA EXAM Sun Nov 22, :59:45 Page Level Of Service Computation Report 2000 HCM Unsignalized Method (Base Volume Alternative) Intersection #2 Sierra College Blvd/Water Lily Lane Average Delay (sec/veh): 0.2 Worst Case Level Of Service: B[ 14.0] Page 3
47 EX_am.TXT Street Name: Sierra College Blvd Water Lily Lane Approach: North Bound South Bound East Bound West Bound Movement: L - T - R L - T - R L - T - R L - T - R Control: Uncontrolled Uncontrolled Stop Sign Stop Sign Rights: Include Include Include Include Lanes: Volume Module: Base Vol: Growth Adj: Initial Bse: User Adj: PHF Adj: PHF Volume: Reduct Vol: FinalVolume: Critical Gap Module: Critical Gp:xxxxx xxxx xxxxx xxxxx xxxx xxxxx xxxxx xxxxx xxxx 6.9 FollowUpTim:xxxxx xxxx xxxxx xxxxx xxxx xxxxx xxxxx xxxxx xxxx 3.3 Capacity Module: Cnflict Vol: xxxx xxxx xxxxx xxxx xxxx xxxxx xxxx xxxx xxxx 618 Potent Cap.: xxxx xxxx xxxxx xxxx xxxx xxxxx xxxx xxxx xxxx 437 Move Cap.: xxxx xxxx xxxxx xxxx xxxx xxxxx xxxx xxxx xxxx 437 Volume/Cap: xxxx xxxx xxxx xxxx xxxx xxxx xxxx xxxx xxxx 0.09 Level Of Service Module: 2Way95thQ: xxxx xxxx xxxxx xxxx xxxx xxxxx xxxx xxxx xxxxx xxxx xxxx 0.3 Control Del:xxxxx xxxx xxxxx xxxxx xxxx xxxxx xxxxx xxxx xxxxx xxxxx xxxx 14.0 LOS by Move: * * * * * * * * * * * B Movement: LT - LTR - RT LT - LTR - RT LT - LTR - RT LT - LTR - RT Shared Cap.: xxxx xxxx xxxxx xxxx xxxx xxxxx xxxx xxxx 0 xxxx xxxx xxxxx SharedQueue:xxxxx xxxx xxxxx xxxxx xxxx xxxxx xxxxx xxxx xxxxx xxxxx xxxx xxxxx Shrd ConDel:xxxxx xxxx xxxxx xxxxx xxxx xxxxx xxxxx xxxx xxxxx xxxxx xxxx xxxxx Shared LOS: * * * * * * * * * * * * ApproachDel: xxxxxx xxxxxx xxxxxx 14.0 ApproachLOS: * * * B Note: Queue reported is the number of cars per lane. Traffix (c) 2008 Dowling Assoc. Licensed to OMNI-MEANS, ROSEVILLE,CA EXAM Sun Nov 22, :59:45 Page Level Of Service Computation Report 2000 HCM Unsignalized Method (Base Volume Alternative) Intersection #3 Rocklin Road/ Rocklin Manor Dr Average Delay (sec/veh): 0.4 Worst Case Level Of Service: B[ 13.3] Street Name: Roklin Road Rocklin Manor Dr Approach: North Bound South Bound East Bound West Bound Page 4
48 EX_am.TXT Movement: L - T - R L - T - R L - T - R L - T - R Control: Stop Sign Stop Sign Uncontrolled Uncontrolled Rights: Include Include Include Include Lanes: Volume Module: Base Vol: Growth Adj: Initial Bse: User Adj: PHF Adj: PHF Volume: Reduct Vol: FinalVolume: Critical Gap Module: Critical Gp: 6.4 xxxx xxxxx xxxxx xxxx xxxxx xxxxx xxxx xxxxx 4.1 xxxx xxxxx FollowUpTim: 3.5 xxxx xxxxx xxxxx xxxx xxxxx xxxxx xxxx xxxxx 2.2 xxxx xxxxx Capacity Module: Cnflict Vol: 836 xxxx xxxxx xxxx xxxx xxxxx xxxx xxxx xxxxx 378 xxxx xxxxx Potent Cap.: 340 xxxx xxxxx xxxx xxxx xxxxx xxxx xxxx xxxxx 1192 xxxx xxxxx Move Cap.: 340 xxxx xxxxx xxxx xxxx xxxxx xxxx xxxx xxxxx 1192 xxxx xxxxx Total Cap: xxxxx xxxxx xxxx xxxx xxxxx xxxx xxxx xxxxx Volume/Cap: 0.05 xxxx xxxx xxxx xxxx xxxx xxxx xxxx xxxx 0.00 xxxx xxxx Level Of Service Module: 2Way95thQ: 0.2 xxxx xxxxx xxxx xxxx xxxxx xxxx xxxx xxxxx 0.0 xxxx xxxxx Control Del: 13.3 xxxx xxxxx xxxxx xxxx xxxxx xxxxx xxxx xxxxx 8.0 xxxx xxxxx LOS by Move: B * * * * * * * * A * * Movement: LT - LTR - RT LT - LTR - RT LT - LTR - RT LT - LTR - RT Shared Cap.: xxxx xxxx xxxxx xxxx xxxx xxxxx xxxx xxxx xxxxx xxxx xxxx xxxxx SharedQueue:xxxxx xxxx xxxxx xxxxx xxxx xxxxx xxxxx xxxx xxxxx xxxxx xxxx xxxxx Shrd ConDel:xxxxx xxxx xxxxx xxxxx xxxx xxxxx xxxxx xxxx xxxxx xxxxx xxxx xxxxx Shared LOS: * * * * * * * * * * * * ApproachDel: 13.3 xxxxxx xxxxxx xxxxxx ApproachLOS: B * * * Note: Queue reported is the number of cars per lane. Traffix (c) 2008 Dowling Assoc. Licensed to OMNI-MEANS, ROSEVILLE,CA Page 5
49 EX_pm.TXT Intersection #1 Rocklin Road/ Sierra College Cycle (sec): 100 Critical Vol./Cap.(X): Loss Time (sec): 16 Average Delay (sec/veh): xxxxxx Optimal Cycle: 128 Level Of Service: C Street Name: Rocklin Road Sierra College Approach: North Bound South Bound East Bound West Bound Movement: L - T - R L - T - R L - T - R L - T - R Control: Protected Protected Protected Protected Rights: Include Include Include Include Min. Green: Y+R: Lanes: Volume Module: Base Vol: Growth Adj: Initial Bse: User Adj: PHF Adj: PHF Volume: Reduct Vol: Reduced Vol: PCE Adj: MLF Adj: FinalVolume: Saturation Flow Module: Sat/Lane: Adjustment: Lanes: Final Sat.: Capacity Analysis Module: Vol/Sat: Crit Volume: Crit Moves: **** **** **** **** Traffix (c) 2008 Dowling Assoc. Licensed to OMNI-MEANS, ROSEVILLE,CA EXPM Sun Nov 22, :00:52 Page Level Of Service Computation Report 2000 HCM Unsignalized Method (Base Volume Alternative) Intersection #2 Sierra College Blvd/Water Lily Lane Average Delay (sec/veh): 0.1 Worst Case Level Of Service: B[ 14.3] Page 3
50 EX_pm.TXT Street Name: Sierra College Blvd Water Lily Lane Approach: North Bound South Bound East Bound West Bound Movement: L - T - R L - T - R L - T - R L - T - R Control: Uncontrolled Uncontrolled Stop Sign Stop Sign Rights: Include Include Include Include Lanes: Volume Module: Base Vol: Growth Adj: Initial Bse: User Adj: PHF Adj: PHF Volume: Reduct Vol: FinalVolume: Critical Gap Module: Critical Gp:xxxxx xxxx xxxxx xxxxx xxxx xxxxx xxxxx xxxxx xxxx 6.9 FollowUpTim:xxxxx xxxx xxxxx xxxxx xxxx xxxxx xxxxx xxxxx xxxx 3.3 Capacity Module: Cnflict Vol: xxxx xxxx xxxxx xxxx xxxx xxxxx xxxx xxxx xxxx 668 Potent Cap.: xxxx xxxx xxxxx xxxx xxxx xxxxx xxxx xxxx xxxx 406 Move Cap.: xxxx xxxx xxxxx xxxx xxxx xxxxx xxxx xxxx xxxx 406 Volume/Cap: xxxx xxxx xxxx xxxx xxxx xxxx xxxx xxxx xxxx 0.05 Level Of Service Module: 2Way95thQ: xxxx xxxx xxxxx xxxx xxxx xxxxx xxxx xxxx xxxxx xxxx xxxx 0.1 Control Del:xxxxx xxxx xxxxx xxxxx xxxx xxxxx xxxxx xxxx xxxxx xxxxx xxxx 14.3 LOS by Move: * * * * * * * * * * * B Movement: LT - LTR - RT LT - LTR - RT LT - LTR - RT LT - LTR - RT Shared Cap.: xxxx xxxx xxxxx xxxx xxxx xxxxx xxxx xxxx 0 xxxx xxxx xxxxx SharedQueue:xxxxx xxxx xxxxx xxxxx xxxx xxxxx xxxxx xxxx xxxxx xxxxx xxxx xxxxx Shrd ConDel:xxxxx xxxx xxxxx xxxxx xxxx xxxxx xxxxx xxxx xxxxx xxxxx xxxx xxxxx Shared LOS: * * * * * * * * * * * * ApproachDel: xxxxxx xxxxxx xxxxxx 14.3 ApproachLOS: * * * B Note: Queue reported is the number of cars per lane. Traffix (c) 2008 Dowling Assoc. Licensed to OMNI-MEANS, ROSEVILLE,CA EXPM Sun Nov 22, :00:52 Page Level Of Service Computation Report 2000 HCM Unsignalized Method (Base Volume Alternative) Intersection #3 Rocklin Road/ Rocklin Manor Dr Average Delay (sec/veh): 0.2 Worst Case Level Of Service: B[ 12.9] Street Name: Roklin Road Rocklin Manor Dr Approach: North Bound South Bound East Bound West Bound Page 4
51 EX_pm.TXT Movement: L - T - R L - T - R L - T - R L - T - R Control: Stop Sign Stop Sign Uncontrolled Uncontrolled Rights: Include Include Include Include Lanes: 0 0 1! Volume Module: Base Vol: Growth Adj: Initial Bse: User Adj: PHF Adj: PHF Volume: Reduct Vol: FinalVolume: Critical Gap Module: Critical Gp: xxxxx xxxx xxxxx xxxxx xxxx xxxxx xxxxx xxxx xxxxx FollowUpTim: xxxxx xxxx xxxxx xxxxx xxxx xxxxx xxxxx xxxx xxxxx Capacity Module: Cnflict Vol: xxxx xxxx xxxxx xxxx xxxx xxxxx xxxx xxxx xxxxx Potent Cap.: xxxx xxxx xxxxx xxxx xxxx xxxxx xxxx xxxx xxxxx Move Cap.: xxxx xxxx xxxxx xxxx xxxx xxxxx xxxx xxxx xxxxx Total Cap: xxxxx xxxxx xxxx xxxx xxxxx xxxx xxxx xxxxx Volume/Cap: xxxx xxxx xxxx xxxx xxxx xxxx xxxx xxxx xxxx Level Of Service Module: 2Way95thQ: xxxx xxxx xxxxx xxxx xxxx xxxxx xxxx xxxx xxxxx xxxx xxxx xxxxx Control Del:xxxxx xxxx xxxxx xxxxx xxxx xxxxx xxxxx xxxx xxxxx xxxxx xxxx xxxxx LOS by Move: * * * * * * * * * * * * Movement: LT - LTR - RT LT - LTR - RT LT - LTR - RT LT - LTR - RT Shared Cap.: xxxx 470 xxxxx xxxx xxxx xxxxx xxxx xxxx xxxxx xxxx xxxx xxxxx SharedQueue:xxxxx 0.1 xxxxx xxxxx xxxx xxxxx xxxxx xxxx xxxxx xxxxx xxxx xxxxx Shrd ConDel:xxxxx 12.9 xxxxx xxxxx xxxx xxxxx xxxxx xxxx xxxxx xxxxx xxxx xxxxx Shared LOS: * B * * * * * * * * * * ApproachDel: 12.9 xxxxxx xxxxxx xxxxxx ApproachLOS: B * * * Note: Queue reported is the number of cars per lane. Traffix (c) 2008 Dowling Assoc. Licensed to OMNI-MEANS, ROSEVILLE,CA Page 5
52 EXPP_AM.TXT Level Of Service Computation Report Circular 212 Planning Method (Future Volume Alternative) Intersection #1 Rocklin Road/ Sierra College Cycle (sec): 100 Critical Vol./Cap.(X): Loss Time (sec): 0 Average Delay (sec/veh): xxxxxx Optimal Cycle: 65 Level Of Service: B Street Name: Rocklin Road Sierra College Approach: North Bound South Bound East Bound West Bound Movement: L - T - R L - T - R L - T - R L - T - R Control: Protected Protected Protected Protected Rights: Include Include Include Include Min. Green: Y+R: Lanes: Volume Module: Base Vol: Growth Adj: Initial Bse: Added Vol: PasserByVol: Initial Fut: User Adj: PHF Adj: PHF Volume: Reduct Vol: Reduced Vol: PCE Adj: MLF Adj: FinalVolume: Saturation Flow Module: Sat/Lane: Adjustment: Lanes: Final Sat.: Capacity Analysis Module: Vol/Sat: Crit Volume: Crit Moves: **** **** **** **** Traffix (c) 2008 Dowling Assoc. Licensed to OMNI-MEANS, ROSEVILLE,CA EXPP AM Fri Dec 11, :23:07 Page Level Of Service Computation Report 2000 HCM Unsignalized Method (Future Volume Alternative) Page 4
53 EXPP_AM.TXT Intersection #2 Sierra College Blvd/Water Lily Lane Average Delay (sec/veh): 0.2 Worst Case Level Of Service: B[ 14.2] Street Name: Sierra College Blvd Water Lily Lane Approach: North Bound South Bound East Bound West Bound Movement: L - T - R L - T - R L - T - R L - T - R Control: Uncontrolled Uncontrolled Stop Sign Stop Sign Rights: Include Include Include Include Lanes: Volume Module: Base Vol: Growth Adj: Initial Bse: Added Vol: PasserByVol: Initial Fut: User Adj: PHF Adj: PHF Volume: Reduct Vol: FinalVolume: Critical Gap Module: Critical Gp:xxxxx xxxx xxxxx xxxxx xxxx xxxxx xxxxx xxxxx xxxx 6.9 FollowUpTim:xxxxx xxxx xxxxx xxxxx xxxx xxxxx xxxxx xxxxx xxxx 3.3 Capacity Module: Cnflict Vol: xxxx xxxx xxxxx xxxx xxxx xxxxx xxxx xxxx xxxx 625 Potent Cap.: xxxx xxxx xxxxx xxxx xxxx xxxxx xxxx xxxx xxxx 433 Move Cap.: xxxx xxxx xxxxx xxxx xxxx xxxxx xxxx xxxx xxxx 433 Volume/Cap: xxxx xxxx xxxx xxxx xxxx xxxx xxxx xxxx xxxx 0.09 Level Of Service Module: 2Way95thQ: xxxx xxxx xxxxx xxxx xxxx xxxxx xxxx xxxx xxxxx xxxx xxxx 0.3 Control Del:xxxxx xxxx xxxxx xxxxx xxxx xxxxx xxxxx xxxx xxxxx xxxxx xxxx 14.2 LOS by Move: * * * * * * * * * * * B Movement: LT - LTR - RT LT - LTR - RT LT - LTR - RT LT - LTR - RT Shared Cap.: xxxx xxxx xxxxx xxxx xxxx xxxxx xxxx xxxx 0 xxxx xxxx xxxxx SharedQueue:xxxxx xxxx xxxxx xxxxx xxxx xxxxx xxxxx xxxx xxxxx xxxxx xxxx xxxxx Shrd ConDel:xxxxx xxxx xxxxx xxxxx xxxx xxxxx xxxxx xxxx xxxxx xxxxx xxxx xxxxx Shared LOS: * * * * * * * * * * * * ApproachDel: xxxxxx xxxxxx xxxxxx 14.2 ApproachLOS: * * * B Note: Queue reported is the number of cars per lane. Traffix (c) 2008 Dowling Assoc. Licensed to OMNI-MEANS, ROSEVILLE,CA EXPP AM Fri Dec 11, :23:07 Page Level Of Service Computation Report 2000 HCM Unsignalized Method (Future Volume Alternative) Intersection #3 Rocklin Road/ Rocklin Manor Dr Average Delay (sec/veh): 1.3 Worst Case Level Of Service: C[ 16.8] Page 5
54 EXPP_AM.TXT Street Name: Roklin Road Rocklin Manor Dr Approach: North Bound South Bound East Bound West Bound Movement: L - T - R L - T - R L - T - R L - T - R Control: Stop Sign Stop Sign Uncontrolled Uncontrolled Rights: Include Include Include Include Lanes: 0 0 1! Volume Module: Base Vol: Growth Adj: Initial Bse: Added Vol: PasserByVol: Initial Fut: User Adj: PHF Adj: PHF Volume: Reduct Vol: FinalVolume: Critical Gap Module: Critical Gp: xxxxx xxxx xxxxx xxxxx xxxx xxxxx 4.1 xxxx xxxxx FollowUpTim: xxxxx xxxx xxxxx xxxxx xxxx xxxxx 2.2 xxxx xxxxx Capacity Module: Cnflict Vol: xxxx xxxx xxxxx xxxx xxxx xxxxx 553 xxxx xxxxx Potent Cap.: xxxx xxxx xxxxx xxxx xxxx xxxxx 1027 xxxx xxxxx Move Cap.: xxxx xxxx xxxxx xxxx xxxx xxxxx 1027 xxxx xxxxx Total Cap: xxxxx xxxxx xxxx xxxx xxxxx xxxx xxxx xxxxx Volume/Cap: xxxx xxxx xxxx xxxx xxxx xxxx 0.02 xxxx xxxx Level Of Service Module: 2Way95thQ: xxxx xxxx xxxxx xxxx xxxx xxxxx xxxx xxxx xxxxx 0.0 xxxx xxxxx Control Del:xxxxx xxxx xxxxx xxxxx xxxx xxxxx xxxxx xxxx xxxxx 8.6 xxxx xxxxx LOS by Move: * * * * * * * * * A * * Movement: LT - LTR - RT LT - LTR - RT LT - LTR - RT LT - LTR - RT Shared Cap.: xxxx 389 xxxxx xxxx xxxx xxxxx xxxx xxxx xxxxx xxxx xxxx xxxxx SharedQueue:xxxxx 0.8 xxxxx xxxxx xxxx xxxxx xxxxx xxxx xxxxx xxxxx xxxx xxxxx Shrd ConDel:xxxxx 16.8 xxxxx xxxxx xxxx xxxxx xxxxx xxxx xxxxx xxxxx xxxx xxxxx Shared LOS: * C * * * * * * * * * * ApproachDel: 16.8 xxxxxx xxxxxx xxxxxx ApproachLOS: C * * * Note: Queue reported is the number of cars per lane. Traffix (c) 2008 Dowling Assoc. Licensed to OMNI-MEANS, ROSEVILLE,CA Page 6
55 EXPP_PM.TXT Intersection #1 Rocklin Road/ Sierra College Cycle (sec): 100 Critical Vol./Cap.(X): Loss Time (sec): 0 Average Delay (sec/veh): xxxxxx Optimal Cycle: 103 Level Of Service: C Street Name: Rocklin Road Sierra College Approach: North Bound South Bound East Bound West Bound Movement: L - T - R L - T - R L - T - R L - T - R Control: Protected Protected Protected Protected Rights: Include Include Include Include Min. Green: Y+R: Lanes: Volume Module: Base Vol: Growth Adj: Initial Bse: Added Vol: PasserByVol: Initial Fut: User Adj: PHF Adj: PHF Volume: Reduct Vol: Reduced Vol: PCE Adj: MLF Adj: FinalVolume: Saturation Flow Module: Sat/Lane: Adjustment: Lanes: Final Sat.: Capacity Analysis Module: Vol/Sat: Crit Volume: Crit Moves: **** **** **** **** Traffix (c) 2008 Dowling Assoc. Licensed to OMNI-MEANS, ROSEVILLE,CA EXPP PM Fri Dec 11, :23:37 Page Level Of Service Computation Report 2000 HCM Unsignalized Method (Future Volume Alternative) Intersection #2 Sierra College Blvd/Water Lily Lane Page 4
56 EXPP_PM.TXT Average Delay (sec/veh): 0.1 Worst Case Level Of Service: B[ 14.4] Street Name: Sierra College Blvd Water Lily Lane Approach: North Bound South Bound East Bound West Bound Movement: L - T - R L - T - R L - T - R L - T - R Control: Uncontrolled Uncontrolled Stop Sign Stop Sign Rights: Include Include Include Include Lanes: Volume Module: Base Vol: Growth Adj: Initial Bse: Added Vol: PasserByVol: Initial Fut: User Adj: PHF Adj: PHF Volume: Reduct Vol: FinalVolume: Critical Gap Module: Critical Gp:xxxxx xxxx xxxxx xxxxx xxxx xxxxx xxxxx xxxxx xxxx 6.9 FollowUpTim:xxxxx xxxx xxxxx xxxxx xxxx xxxxx xxxxx xxxxx xxxx 3.3 Capacity Module: Cnflict Vol: xxxx xxxx xxxxx xxxx xxxx xxxxx xxxx xxxx xxxx 674 Potent Cap.: xxxx xxxx xxxxx xxxx xxxx xxxxx xxxx xxxx xxxx 402 Move Cap.: xxxx xxxx xxxxx xxxx xxxx xxxxx xxxx xxxx xxxx 402 Volume/Cap: xxxx xxxx xxxx xxxx xxxx xxxx xxxx xxxx xxxx 0.05 Level Of Service Module: 2Way95thQ: xxxx xxxx xxxxx xxxx xxxx xxxxx xxxx xxxx xxxxx xxxx xxxx 0.1 Control Del:xxxxx xxxx xxxxx xxxxx xxxx xxxxx xxxxx xxxx xxxxx xxxxx xxxx 14.4 LOS by Move: * * * * * * * * * * * B Movement: LT - LTR - RT LT - LTR - RT LT - LTR - RT LT - LTR - RT Shared Cap.: xxxx xxxx xxxxx xxxx xxxx xxxxx xxxx xxxx 0 xxxx xxxx xxxxx SharedQueue:xxxxx xxxx xxxxx xxxxx xxxx xxxxx xxxxx xxxx xxxxx xxxxx xxxx xxxxx Shrd ConDel:xxxxx xxxx xxxxx xxxxx xxxx xxxxx xxxxx xxxx xxxxx xxxxx xxxx xxxxx Shared LOS: * * * * * * * * * * * * ApproachDel: xxxxxx xxxxxx xxxxxx 14.4 ApproachLOS: * * * B Note: Queue reported is the number of cars per lane. Traffix (c) 2008 Dowling Assoc. Licensed to OMNI-MEANS, ROSEVILLE,CA EXPP PM Fri Dec 11, :23:37 Page Level Of Service Computation Report 2000 HCM Unsignalized Method (Future Volume Alternative) Intersection #3 Rocklin Road/ Rocklin Manor Dr Average Delay (sec/veh): 1.0 Worst Case Level Of Service: B[ 14.9] Street Name: Roklin Road Rocklin Manor Dr Page 5
57 EXPP_PM.TXT Approach: North Bound South Bound East Bound West Bound Movement: L - T - R L - T - R L - T - R L - T - R Control: Stop Sign Stop Sign Uncontrolled Uncontrolled Rights: Include Include Include Include Lanes: 0 0 1! Volume Module: Base Vol: Growth Adj: Initial Bse: Added Vol: PasserByVol: Initial Fut: User Adj: PHF Adj: PHF Volume: Reduct Vol: FinalVolume: Critical Gap Module: Critical Gp: xxxxx xxxx xxxxx xxxxx xxxx xxxxx 4.1 xxxx xxxxx FollowUpTim: xxxxx xxxx xxxxx xxxxx xxxx xxxxx 2.2 xxxx xxxxx Capacity Module: Cnflict Vol: xxxx xxxx xxxxx xxxx xxxx xxxxx 605 xxxx xxxxx Potent Cap.: xxxx xxxx xxxxx xxxx xxxx xxxxx 982 xxxx xxxxx Move Cap.: xxxx xxxx xxxxx xxxx xxxx xxxxx 982 xxxx xxxxx Total Cap: xxxxx xxxxx xxxx xxxx xxxxx xxxx xxxx xxxxx Volume/Cap: xxxx xxxx xxxx xxxx xxxx xxxx 0.01 xxxx xxxx Level Of Service Module: 2Way95thQ: xxxx xxxx xxxxx xxxx xxxx xxxxx xxxx xxxx xxxxx 0.0 xxxx xxxxx Control Del:xxxxx xxxx xxxxx xxxxx xxxx xxxxx xxxxx xxxx xxxxx 8.7 xxxx xxxxx LOS by Move: * * * * * * * * * A * * Movement: LT - LTR - RT LT - LTR - RT LT - LTR - RT LT - LTR - RT Shared Cap.: xxxx 429 xxxxx xxxx xxxx xxxxx xxxx xxxx xxxxx xxxx xxxx xxxxx SharedQueue:xxxxx 0.5 xxxxx xxxxx xxxx xxxxx xxxxx xxxx xxxxx xxxxx xxxx xxxxx Shrd ConDel:xxxxx 14.9 xxxxx xxxxx xxxx xxxxx xxxxx xxxx xxxxx xxxxx xxxx xxxxx Shared LOS: * B * * * * * * * * * * ApproachDel: 14.9 xxxxxx xxxxxx xxxxxx ApproachLOS: B * * * Note: Queue reported is the number of cars per lane. Traffix (c) 2008 Dowling Assoc. Licensed to OMNI-MEANS, ROSEVILLE,CA Page 6
58 With Outbound Acess to WaterLily lane EXPP_WO_AM.txt Level Of Service Computation Report Circular 212 Planning Method (Future Volume Alternative) Intersection #1 Rocklin Road/ Sierra College Cycle (sec): 100 Critical Vol./Cap.(X): Loss Time (sec): 16 Average Delay (sec/veh): xxxxxx Optimal Cycle: 82 Level Of Service: B Street Name: Rocklin Road Sierra College Approach: North Bound South Bound East Bound West Bound Movement: L - T - R L - T - R L - T - R L - T - R Control: Protected Protected Protected Protected Rights: Include Include Include Include Min. Green: Y+R: Lanes: Volume Module: Base Vol: Growth Adj: Initial Bse: Added Vol: PasserByVol: Initial Fut: User Adj: PHF Adj: PHF Volume: Reduct Vol: Reduced Vol: PCE Adj: MLF Adj: FinalVolume: Saturation Flow Module: Sat/Lane: Adjustment: Lanes: Final Sat.: Capacity Analysis Module: Vol/Sat: Crit Volume: Crit Moves: **** **** **** **** Traffix (c) 2008 Dowling Assoc. Licensed to OMNI-MEANS, ROSEVILLE,CA EXPP AM outbuond waterlillyfri Dec 11, :33:43 Page Level Of Service Computation Report 2000 HCM Unsignalized Method (Future Volume Alternative) Page 3
59 With Outbound Acess to WaterLily lane EXPP_WO_AM.txt Intersection #2 Sierra College Blvd/Water Lily Lane Average Delay (sec/veh): 0.4 Worst Case Level Of Service: B[ 14.9] Street Name: Sierra College Blvd Water Lily Lane Approach: North Bound South Bound East Bound West Bound Movement: L - T - R L - T - R L - T - R L - T - R Control: Uncontrolled Uncontrolled Stop Sign Stop Sign Rights: Include Include Include Include Lanes: Volume Module: Base Vol: Growth Adj: Initial Bse: Added Vol: PasserByVol: Initial Fut: User Adj: PHF Adj: PHF Volume: Reduct Vol: FinalVolume: Critical Gap Module: Critical Gp:xxxxx xxxx xxxxx xxxxx xxxx xxxxx xxxxx xxxxx xxxx 6.9 FollowUpTim:xxxxx xxxx xxxxx xxxxx xxxx xxxxx xxxxx xxxxx xxxx 3.3 Capacity Module: Cnflict Vol: xxxx xxxx xxxxx xxxx xxxx xxxxx xxxx xxxx xxxx 619 Potent Cap.: xxxx xxxx xxxxx xxxx xxxx xxxxx xxxx xxxx xxxx 436 Move Cap.: xxxx xxxx xxxxx xxxx xxxx xxxxx xxxx xxxx xxxx 436 Volume/Cap: xxxx xxxx xxxx xxxx xxxx xxxx xxxx xxxx xxxx 0.17 Level Of Service Module: 2Way95thQ: xxxx xxxx xxxxx xxxx xxxx xxxxx xxxx xxxx xxxxx xxxx xxxx 0.6 Control Del:xxxxx xxxx xxxxx xxxxx xxxx xxxxx xxxxx xxxx xxxxx xxxxx xxxx 14.9 LOS by Move: * * * * * * * * * * * B Movement: LT - LTR - RT LT - LTR - RT LT - LTR - RT LT - LTR - RT Shared Cap.: xxxx xxxx xxxxx xxxx xxxx xxxxx xxxx xxxx 0 xxxx xxxx xxxxx SharedQueue:xxxxx xxxx xxxxx xxxxx xxxx xxxxx xxxxx xxxx xxxxx xxxxx xxxx xxxxx Shrd ConDel:xxxxx xxxx xxxxx xxxxx xxxx xxxxx xxxxx xxxx xxxxx xxxxx xxxx xxxxx Shared LOS: * * * * * * * * * * * * ApproachDel: xxxxxx xxxxxx xxxxxx 14.9 ApproachLOS: * * * B Note: Queue reported is the number of cars per lane. Traffix (c) 2008 Dowling Assoc. Licensed to OMNI-MEANS, ROSEVILLE,CA EXPP AM outbuond waterlillyfri Dec 11, :33:43 Page Level Of Service Computation Report 2000 HCM Unsignalized Method (Future Volume Alternative) Intersection #3 Rocklin Road/ Rocklin Manor Dr Page 4
60 With Outbound Acess to WaterLily lane EXPP_WO_AM.txt Average Delay (sec/veh): 1.3 Worst Case Level Of Service: C[ 15.9] Street Name: Roklin Road Rocklin Manor Dr Approach: North Bound South Bound East Bound West Bound Movement: L - T - R L - T - R L - T - R L - T - R Control: Stop Sign Stop Sign Uncontrolled Uncontrolled Rights: Include Include Include Include Lanes: 0 0 1! Volume Module: Base Vol: Growth Adj: Initial Bse: Added Vol: PasserByVol: Initial Fut: User Adj: PHF Adj: PHF Volume: Reduct Vol: FinalVolume: Critical Gap Module: Critical Gp: xxxxx xxxx xxxxx xxxxx xxxx xxxxx 4.1 xxxx xxxxx FollowUpTim: xxxxx xxxx xxxxx xxxxx xxxx xxxxx 2.2 xxxx xxxxx Capacity Module: Cnflict Vol: xxxx xxxx xxxxx xxxx xxxx xxxxx 488 xxxx xxxxx Potent Cap.: xxxx xxxx xxxxx xxxx xxxx xxxxx 1086 xxxx xxxxx Move Cap.: xxxx xxxx xxxxx xxxx xxxx xxxxx 1086 xxxx xxxxx Total Cap: xxxxx xxxxx xxxx xxxx xxxxx xxxx xxxx xxxxx Volume/Cap: xxxx xxxx xxxx xxxx xxxx xxxx 0.00 xxxx xxxx Level Of Service Module: 2Way95thQ: xxxx xxxx xxxxx xxxx xxxx xxxxx xxxx xxxx xxxxx 0.0 xxxx xxxxx Control Del:xxxxx xxxx xxxxx xxxxx xxxx xxxxx xxxxx xxxx xxxxx 8.3 xxxx xxxxx LOS by Move: * * * * * * * * * A * * Movement: LT - LTR - RT LT - LTR - RT LT - LTR - RT LT - LTR - RT Shared Cap.: xxxx 421 xxxxx xxxx xxxx xxxxx xxxx xxxx xxxxx xxxx xxxx xxxxx SharedQueue:xxxxx 0.8 xxxxx xxxxx xxxx xxxxx xxxxx xxxx xxxxx xxxxx xxxx xxxxx Shrd ConDel:xxxxx 15.9 xxxxx xxxxx xxxx xxxxx xxxxx xxxx xxxxx xxxxx xxxx xxxxx Shared LOS: * C * * * * * * * * * * ApproachDel: 15.9 xxxxxx xxxxxx xxxxxx ApproachLOS: C * * * Note: Queue reported is the number of cars per lane. Traffix (c) 2008 Dowling Assoc. Licensed to OMNI-MEANS, ROSEVILLE,CA Page 5
61 With Outbound Acess to WaterLily lane EXPP_WO_PM.txt Level Of Service Computation Report Circular 212 Planning Method (Future Volume Alternative) Intersection #1 Rocklin Road/ Sierra College Cycle (sec): 100 Critical Vol./Cap.(X): Loss Time (sec): 16 Average Delay (sec/veh): xxxxxx Optimal Cycle: 129 Level Of Service: C Street Name: Rocklin Road Sierra College Approach: North Bound South Bound East Bound West Bound Movement: L - T - R L - T - R L - T - R L - T - R Control: Protected Protected Protected Protected Rights: Include Include Include Include Min. Green: Y+R: Lanes: Volume Module: Base Vol: Growth Adj: Initial Bse: Added Vol: PasserByVol: Initial Fut: User Adj: PHF Adj: PHF Volume: Reduct Vol: Reduced Vol: PCE Adj: MLF Adj: FinalVolume: Saturation Flow Module: Sat/Lane: Adjustment: Lanes: Final Sat.: Capacity Analysis Module: Vol/Sat: Crit Volume: Crit Moves: **** **** **** **** Traffix (c) 2008 Dowling Assoc. Licensed to OMNI-MEANS, ROSEVILLE,CA EXPP PM outbuond waterlillyfri Dec 11, :33:59 Page Level Of Service Computation Report 2000 HCM Unsignalized Method (Future Volume Alternative) Page 3
62 With Outbound Acess to WaterLily lane EXPP_WO_PM.txt Intersection #2 Sierra College Blvd/Water Lily Lane Average Delay (sec/veh): 0.2 Worst Case Level Of Service: B[ 14.8] Street Name: Sierra College Blvd Water Lily Lane Approach: North Bound South Bound East Bound West Bound Movement: L - T - R L - T - R L - T - R L - T - R Control: Uncontrolled Uncontrolled Stop Sign Stop Sign Rights: Include Include Include Include Lanes: Volume Module: Base Vol: Growth Adj: Initial Bse: Added Vol: PasserByVol: Initial Fut: User Adj: PHF Adj: PHF Volume: Reduct Vol: FinalVolume: Critical Gap Module: Critical Gp:xxxxx xxxx xxxxx xxxxx xxxx xxxxx xxxxx xxxxx xxxx 6.9 FollowUpTim:xxxxx xxxx xxxxx xxxxx xxxx xxxxx xxxxx xxxxx xxxx 3.3 Capacity Module: Cnflict Vol: xxxx xxxx xxxxx xxxx xxxx xxxxx xxxx xxxx xxxx 674 Potent Cap.: xxxx xxxx xxxxx xxxx xxxx xxxxx xxxx xxxx xxxx 402 Move Cap.: xxxx xxxx xxxxx xxxx xxxx xxxxx xxxx xxxx xxxx 402 Volume/Cap: xxxx xxxx xxxx xxxx xxxx xxxx xxxx xxxx xxxx 0.09 Level Of Service Module: 2Way95thQ: xxxx xxxx xxxxx xxxx xxxx xxxxx xxxx xxxx xxxxx xxxx xxxx 0.3 Control Del:xxxxx xxxx xxxxx xxxxx xxxx xxxxx xxxxx xxxx xxxxx xxxxx xxxx 14.8 LOS by Move: * * * * * * * * * * * B Movement: LT - LTR - RT LT - LTR - RT LT - LTR - RT LT - LTR - RT Shared Cap.: xxxx xxxx xxxxx xxxx xxxx xxxxx xxxx xxxx 0 xxxx xxxx xxxxx SharedQueue:xxxxx xxxx xxxxx xxxxx xxxx xxxxx xxxxx xxxx xxxxx xxxxx xxxx xxxxx Shrd ConDel:xxxxx xxxx xxxxx xxxxx xxxx xxxxx xxxxx xxxx xxxxx xxxxx xxxx xxxxx Shared LOS: * * * * * * * * * * * * ApproachDel: xxxxxx xxxxxx xxxxxx 14.8 ApproachLOS: * * * B Note: Queue reported is the number of cars per lane. Traffix (c) 2008 Dowling Assoc. Licensed to OMNI-MEANS, ROSEVILLE,CA EXPP PM outbuond waterlillyfri Dec 11, :33:59 Page Level Of Service Computation Report 2000 HCM Unsignalized Method (Future Volume Alternative) Intersection #3 Rocklin Road/ Rocklin Manor Dr Page 4
63 With Outbound Acess to WaterLily lane EXPP_WO_PM.txt Average Delay (sec/veh): 0.7 Worst Case Level Of Service: B[ 14.2] Street Name: Roklin Road Rocklin Manor Dr Approach: North Bound South Bound East Bound West Bound Movement: L - T - R L - T - R L - T - R L - T - R Control: Stop Sign Stop Sign Uncontrolled Uncontrolled Rights: Include Include Include Include Lanes: 0 0 1! Volume Module: Base Vol: Growth Adj: Initial Bse: Added Vol: PasserByVol: Initial Fut: User Adj: PHF Adj: PHF Volume: Reduct Vol: FinalVolume: Critical Gap Module: Critical Gp: xxxxx xxxx xxxxx xxxxx xxxx xxxxx 4.1 xxxx xxxxx FollowUpTim: xxxxx xxxx xxxxx xxxxx xxxx xxxxx 2.2 xxxx xxxxx Capacity Module: Cnflict Vol: xxxx xxxx xxxxx xxxx xxxx xxxxx 604 xxxx xxxxx Potent Cap.: xxxx xxxx xxxxx xxxx xxxx xxxxx 983 xxxx xxxxx Move Cap.: xxxx xxxx xxxxx xxxx xxxx xxxxx 983 xxxx xxxxx Total Cap: xxxxx xxxxx xxxx xxxx xxxxx xxxx xxxx xxxxx Volume/Cap: xxxx xxxx xxxx xxxx xxxx xxxx 0.01 xxxx xxxx Level Of Service Module: 2Way95thQ: xxxx xxxx xxxxx xxxx xxxx xxxxx xxxx xxxx xxxxx 0.0 xxxx xxxxx Control Del:xxxxx xxxx xxxxx xxxxx xxxx xxxxx xxxxx xxxx xxxxx 8.7 xxxx xxxxx LOS by Move: * * * * * * * * * A * * Movement: LT - LTR - RT LT - LTR - RT LT - LTR - RT LT - LTR - RT Shared Cap.: xxxx 439 xxxxx xxxx xxxx xxxxx xxxx xxxx xxxxx xxxx xxxx xxxxx SharedQueue:xxxxx 0.4 xxxxx xxxxx xxxx xxxxx xxxxx xxxx xxxxx xxxxx xxxx xxxxx Shrd ConDel:xxxxx 14.2 xxxxx xxxxx xxxx xxxxx xxxxx xxxx xxxxx xxxxx xxxx xxxxx Shared LOS: * B * * * * * * * * * * ApproachDel: 14.2 xxxxxx xxxxxx xxxxxx ApproachLOS: B * * * Note: Queue reported is the number of cars per lane. Traffix (c) 2008 Dowling Assoc. Licensed to OMNI-MEANS, ROSEVILLE,CA Page 5
64 STNP AM Wed Sep 7, :56:01 Page Scenario Report Scenario: STNP AM Command: Default Command Volume: STNP AM Geometry: Default Geometry Impact Fee: Default Impact Fee Trip Generation: AM Trip Distribution: STPP Paths: Default Path Routes: Default Route Configuration: Default Configuration STNP AM Wed Sep 7, :56:01 Page Level Of Service Computation Report Circular 212 Planning Method (Base Volume Alternative) Intersection #1 Rocklin Road/ Sierra College Cycle (sec): 100 Critical Vol./Cap.(X): Loss Time (sec): 16 Average Delay (sec/veh): xxxxxx Optimal Cycle: 92 Level Of Service: B Street Name: Rocklin Road Sierra College Approach: North Bound South Bound East Bound West Bound Movement: L - T - R L - T - R L - T - R L - T - R Control: Protected Protected Protected Protected Rights: Include Include Include Include Min. Green: Y+R: Lanes: Volume Module: Base Vol: Growth Adj: Initial Bse: User Adj: PHF Adj: PHF Volume: Reduct Vol: Reduced Vol: PCE Adj: MLF Adj: FinalVolume: Saturation Flow Module: Sat/Lane: Adjustment: Lanes: Final Sat.: Capacity Analysis Module: Vol/Sat: Crit Volume: Crit Moves: **** **** **** **** Traffix (c) 2008 Dowling Assoc. Licensed to OMNI-MEANS, ROSEVILLE,CA Traffix (c) 2008 Dowling Assoc. Licensed to OMNI-MEANS, ROSEVILLE,CA
65 STNP AM Wed Sep 7, :56:01 Page Level Of Service Computation Report 2000 HCM Unsignalized Method (Base Volume Alternative) Intersection #2 Sierra College Blvd/Water Lily Lane Average Delay (sec/veh): 0.2 Worst Case Level Of Service: B[ 14.7] Street Name: Sierra College Blvd Water Lily Lane Approach: North Bound South Bound East Bound West Bound Movement: L - T - R L - T - R L - T - R L - T - R Control: Uncontrolled Uncontrolled Stop Sign Stop Sign Rights: Include Include Include Include Lanes: Volume Module: Base Vol: Growth Adj: Initial Bse: User Adj: PHF Adj: PHF Volume: Reduct Vol: FinalVolume: Critical Gap Module: Critical Gp:xxxxx xxxx xxxxx xxxxx xxxx xxxxx xxxxx xxxxx xxxx 6.9 FollowUpTim:xxxxx xxxx xxxxx xxxxx xxxx xxxxx xxxxx xxxxx xxxx 3.3 Capacity Module: Cnflict Vol: xxxx xxxx xxxxx xxxx xxxx xxxxx xxxx xxxx xxxx 657 Potent Cap.: xxxx xxxx xxxxx xxxx xxxx xxxxx xxxx xxxx xxxx 412 Move Cap.: xxxx xxxx xxxxx xxxx xxxx xxxxx xxxx xxxx xxxx 412 Volume/Cap: xxxx xxxx xxxx xxxx xxxx xxxx xxxx xxxx xxxx 0.10 Level Of Service Module: 2Way95thQ: xxxx xxxx xxxxx xxxx xxxx xxxxx xxxx xxxx xxxxx xxxx xxxx 0.3 Control Del:xxxxx xxxx xxxxx xxxxx xxxx xxxxx xxxxx xxxx xxxxx xxxxx xxxx 14.7 LOS by Move: * * * * * * * * * * * B Movement: LT - LTR - RT LT - LTR - RT LT - LTR - RT LT - LTR - RT Shared Cap.: xxxx xxxx xxxxx xxxx xxxx xxxxx xxxx xxxx 0 xxxx xxxx xxxxx SharedQueue:xxxxx xxxx xxxxx xxxxx xxxx xxxxx xxxxx xxxx xxxxx xxxxx xxxx xxxxx Shrd ConDel:xxxxx xxxx xxxxx xxxxx xxxx xxxxx xxxxx xxxx xxxxx xxxxx xxxx xxxxx Shared LOS: * * * * * * * * * * * * ApproachDel: xxxxxx xxxxxx xxxxxx 14.7 ApproachLOS: * * * B Note: Queue reported is the number of cars per lane. STNP AM Wed Sep 7, :56:01 Page Level Of Service Computation Report 2000 HCM Unsignalized Method (Base Volume Alternative) Intersection #3 Rocklin Road/ Rocklin Manor Dr Average Delay (sec/veh): 0.4 Worst Case Level Of Service: C[ 15.6] Street Name: Roklin Road Rocklin Manor Dr Approach: North Bound South Bound East Bound West Bound Movement: L - T - R L - T - R L - T - R L - T - R Control: Stop Sign Stop Sign Uncontrolled Uncontrolled Rights: Include Include Include Include Lanes: Volume Module: Base Vol: Growth Adj: Initial Bse: User Adj: PHF Adj: PHF Volume: Reduct Vol: FinalVolume: Critical Gap Module: Critical Gp: 6.4 xxxx xxxxx xxxxx xxxx xxxxx xxxxx xxxx xxxxx 4.1 xxxx xxxxx FollowUpTim: 3.5 xxxx xxxxx xxxxx xxxx xxxxx xxxxx xxxx xxxxx 2.2 xxxx xxxxx Capacity Module: Cnflict Vol: 1120 xxxx xxxxx xxxx xxxx xxxxx xxxx xxxx xxxxx 510 xxxx xxxxx Potent Cap.: 230 xxxx xxxxx xxxx xxxx xxxxx xxxx xxxx xxxxx 1066 xxxx xxxxx Move Cap.: 230 xxxx xxxxx xxxx xxxx xxxxx xxxx xxxx xxxxx 1066 xxxx xxxxx Total Cap: xxxxx xxxxx xxxx xxxx xxxxx xxxx xxxx xxxxx Volume/Cap: 0.08 xxxx xxxx xxxx xxxx xxxx xxxx xxxx xxxx 0.00 xxxx xxxx Level Of Service Module: 2Way95thQ: 0.3 xxxx xxxxx xxxx xxxx xxxxx xxxx xxxx xxxxx 0.0 xxxx xxxxx Control Del: 15.6 xxxx xxxxx xxxxx xxxx xxxxx xxxxx xxxx xxxxx 8.4 xxxx xxxxx LOS by Move: C * * * * * * * * A * * Movement: LT - LTR - RT LT - LTR - RT LT - LTR - RT LT - LTR - RT Shared Cap.: xxxx xxxx xxxxx xxxx xxxx xxxxx xxxx xxxx xxxxx xxxx xxxx xxxxx SharedQueue:xxxxx xxxx xxxxx xxxxx xxxx xxxxx xxxxx xxxx xxxxx xxxxx xxxx xxxxx Shrd ConDel:xxxxx xxxx xxxxx xxxxx xxxx xxxxx xxxxx xxxx xxxxx xxxxx xxxx xxxxx Shared LOS: * * * * * * * * * * * * ApproachDel: 15.6 xxxxxx xxxxxx xxxxxx ApproachLOS: C * * * Note: Queue reported is the number of cars per lane. Traffix (c) 2008 Dowling Assoc. Licensed to OMNI-MEANS, ROSEVILLE,CA Traffix (c) 2008 Dowling Assoc. Licensed to OMNI-MEANS, ROSEVILLE,CA
66 STNP PM Wed Sep 7, :56:25 Page Scenario Report Scenario: STNP PM Command: Default Command Volume: STNP PM Geometry: Default Geometry Impact Fee: Default Impact Fee Trip Generation: PM Trip Distribution: STPP Paths: Default Path Routes: Default Route Configuration: Default Configuration STNP PM Wed Sep 7, :56:25 Page Level Of Service Computation Report Circular 212 Planning Method (Base Volume Alternative) Intersection #1 Rocklin Road/ Sierra College Cycle (sec): 100 Critical Vol./Cap.(X): Loss Time (sec): 16 Average Delay (sec/veh): xxxxxx Optimal Cycle: 180 Level Of Service: D Street Name: Rocklin Road Sierra College Approach: North Bound South Bound East Bound West Bound Movement: L - T - R L - T - R L - T - R L - T - R Control: Protected Protected Protected Protected Rights: Include Include Include Include Min. Green: Y+R: Lanes: Volume Module: Base Vol: Growth Adj: Initial Bse: User Adj: PHF Adj: PHF Volume: Reduct Vol: Reduced Vol: PCE Adj: MLF Adj: FinalVolume: Saturation Flow Module: Sat/Lane: Adjustment: Lanes: Final Sat.: Capacity Analysis Module: Vol/Sat: Crit Volume: Crit Moves: **** **** **** **** Traffix (c) 2008 Dowling Assoc. Licensed to OMNI-MEANS, ROSEVILLE,CA Traffix (c) 2008 Dowling Assoc. Licensed to OMNI-MEANS, ROSEVILLE,CA
67 STNP PM Wed Sep 7, :56:25 Page Level Of Service Computation Report 2000 HCM Unsignalized Method (Base Volume Alternative) Intersection #2 Sierra College Blvd/Water Lily Lane Average Delay (sec/veh): 0.1 Worst Case Level Of Service: C[ 15.9] Street Name: Sierra College Blvd Water Lily Lane Approach: North Bound South Bound East Bound West Bound Movement: L - T - R L - T - R L - T - R L - T - R Control: Uncontrolled Uncontrolled Stop Sign Stop Sign Rights: Include Include Include Include Lanes: Volume Module: Base Vol: Growth Adj: Initial Bse: User Adj: PHF Adj: PHF Volume: Reduct Vol: FinalVolume: Critical Gap Module: Critical Gp:xxxxx xxxx xxxxx xxxxx xxxx xxxxx xxxxx xxxxx xxxx 6.9 FollowUpTim:xxxxx xxxx xxxxx xxxxx xxxx xxxxx xxxxx xxxxx xxxx 3.3 Capacity Module: Cnflict Vol: xxxx xxxx xxxxx xxxx xxxx xxxxx xxxx xxxx xxxx 769 Potent Cap.: xxxx xxxx xxxxx xxxx xxxx xxxxx xxxx xxxx xxxx 348 Move Cap.: xxxx xxxx xxxxx xxxx xxxx xxxxx xxxx xxxx xxxx 348 Volume/Cap: xxxx xxxx xxxx xxxx xxxx xxxx xxxx xxxx xxxx 0.05 Level Of Service Module: 2Way95thQ: xxxx xxxx xxxxx xxxx xxxx xxxxx xxxx xxxx xxxxx xxxx xxxx 0.2 Control Del:xxxxx xxxx xxxxx xxxxx xxxx xxxxx xxxxx xxxx xxxxx xxxxx xxxx 15.9 LOS by Move: * * * * * * * * * * * C Movement: LT - LTR - RT LT - LTR - RT LT - LTR - RT LT - LTR - RT Shared Cap.: xxxx xxxx xxxxx xxxx xxxx xxxxx xxxx xxxx 0 xxxx xxxx xxxxx SharedQueue:xxxxx xxxx xxxxx xxxxx xxxx xxxxx xxxxx xxxx xxxxx xxxxx xxxx xxxxx Shrd ConDel:xxxxx xxxx xxxxx xxxxx xxxx xxxxx xxxxx xxxx xxxxx xxxxx xxxx xxxxx Shared LOS: * * * * * * * * * * * * ApproachDel: xxxxxx xxxxxx xxxxxx 15.9 ApproachLOS: * * * C Note: Queue reported is the number of cars per lane. STNP PM Wed Sep 7, :56:25 Page Level Of Service Computation Report 2000 HCM Unsignalized Method (Base Volume Alternative) Intersection #3 Rocklin Road/ Rocklin Manor Dr Average Delay (sec/veh): 0.2 Worst Case Level Of Service: B[ 14.6] Street Name: Roklin Road Rocklin Manor Dr Approach: North Bound South Bound East Bound West Bound Movement: L - T - R L - T - R L - T - R L - T - R Control: Stop Sign Stop Sign Uncontrolled Uncontrolled Rights: Include Include Include Include Lanes: 0 0 1! Volume Module: Base Vol: Growth Adj: Initial Bse: User Adj: PHF Adj: PHF Volume: Reduct Vol: FinalVolume: Critical Gap Module: Critical Gp: xxxxx xxxx xxxxx xxxxx xxxx xxxxx xxxxx xxxx xxxxx FollowUpTim: xxxxx xxxx xxxxx xxxxx xxxx xxxxx xxxxx xxxx xxxxx Capacity Module: Cnflict Vol: xxxx xxxx xxxxx xxxx xxxx xxxxx xxxx xxxx xxxxx Potent Cap.: xxxx xxxx xxxxx xxxx xxxx xxxxx xxxx xxxx xxxxx Move Cap.: xxxx xxxx xxxxx xxxx xxxx xxxxx xxxx xxxx xxxxx Total Cap: xxxxx xxxxx xxxx xxxx xxxxx xxxx xxxx xxxxx Volume/Cap: xxxx xxxx xxxx xxxx xxxx xxxx xxxx xxxx xxxx Level Of Service Module: 2Way95thQ: xxxx xxxx xxxxx xxxx xxxx xxxxx xxxx xxxx xxxxx xxxx xxxx xxxxx Control Del:xxxxx xxxx xxxxx xxxxx xxxx xxxxx xxxxx xxxx xxxxx xxxxx xxxx xxxxx LOS by Move: * * * * * * * * * * * * Movement: LT - LTR - RT LT - LTR - RT LT - LTR - RT LT - LTR - RT Shared Cap.: xxxx 390 xxxxx xxxx xxxx xxxxx xxxx xxxx xxxxx xxxx xxxx xxxxx SharedQueue:xxxxx 0.1 xxxxx xxxxx xxxx xxxxx xxxxx xxxx xxxxx xxxxx xxxx xxxxx Shrd ConDel:xxxxx 14.6 xxxxx xxxxx xxxx xxxxx xxxxx xxxx xxxxx xxxxx xxxx xxxxx Shared LOS: * B * * * * * * * * * * ApproachDel: 14.6 xxxxxx xxxxxx xxxxxx ApproachLOS: B * * * Note: Queue reported is the number of cars per lane. Traffix (c) 2008 Dowling Assoc. Licensed to OMNI-MEANS, ROSEVILLE,CA Traffix (c) 2008 Dowling Assoc. Licensed to OMNI-MEANS, ROSEVILLE,CA
68 SHORT TERM PLUS PROJECT AM STNP AM Wed Sep 7, :18:57 Page Scenario Report Scenario: STNP AM Command: Volume: Geometry: Impact Fee: Trip Generation: Trip Distribution: Paths: Routes: Configuration: Default Command STNP AM Default Geometry Default Impact Fee AM STPP Default Path Default Route Default Configuration STNP AM Wed Sep 7, :18:57 Page Level Of Service Computation Report Circular 212 Planning Method (Future Volume Alternative) Intersection #1 Rocklin Road/ Sierra College Cycle (sec): 100 Critical Vol./Cap.(X): Loss Time (sec): 0 Average Delay (sec/veh): xxxxxx Optimal Cycle: 77 Level Of Service: C Street Name: Rocklin Road Sierra College Approach: North Bound South Bound East Bound West Bound Movement: L - T - R L - T - R L - T - R L - T - R Control: Protected Protected Protected Protected Rights: Include Include Include Include Min. Green: Y+R: Lanes: Volume Module: Base Vol: Growth Adj: Initial Bse: Added Vol: PasserByVol: Initial Fut: User Adj: PHF Adj: PHF Volume: Reduct Vol: Reduced Vol: PCE Adj: MLF Adj: FinalVolume: Saturation Flow Module: Sat/Lane: Adjustment: Lanes: Final Sat.: Capacity Analysis Module: Vol/Sat: Crit Volume: Crit Moves: **** **** **** **** Traffix (c) 2008 Dowling Assoc. Licensed to OMNI-MEANS, ROSEVILLE,CA Traffix (c) 2008 Dowling Assoc. Licensed to OMNI-MEANS, ROSEVILLE,CA
69 SHORT TERM PLUS PROJECT AM STNP AM Wed Sep 7, :18:57 Page Level Of Service Computation Report 2000 HCM Unsignalized Method (Future Volume Alternative) Intersection #2 Sierra College Blvd/Water Lily Lane Average Delay (sec/veh): 0.2 Worst Case Level Of Service: B[ 14.8] Street Name: Sierra College Blvd Water Lily Lane Approach: North Bound South Bound East Bound West Bound Movement: L - T - R L - T - R L - T - R L - T - R Control: Uncontrolled Uncontrolled Stop Sign Stop Sign Rights: Include Include Include Include Lanes: Volume Module: Base Vol: Growth Adj: Initial Bse: Added Vol: PasserByVol: Initial Fut: User Adj: PHF Adj: PHF Volume: Reduct Vol: FinalVolume: Critical Gap Module: Critical Gp:xxxxx xxxx xxxxx xxxxx xxxx xxxxx xxxxx xxxxx xxxx 6.9 FollowUpTim:xxxxx xxxx xxxxx xxxxx xxxx xxxxx xxxxx xxxxx xxxx 3.3 Capacity Module: Cnflict Vol: xxxx xxxx xxxxx xxxx xxxx xxxxx xxxx xxxx xxxx 664 Potent Cap.: xxxx xxxx xxxxx xxxx xxxx xxxxx xxxx xxxx xxxx 408 Move Cap.: xxxx xxxx xxxxx xxxx xxxx xxxxx xxxx xxxx xxxx 408 Volume/Cap: xxxx xxxx xxxx xxxx xxxx xxxx xxxx xxxx xxxx 0.10 Level Of Service Module: 2Way95thQ: xxxx xxxx xxxxx xxxx xxxx xxxxx xxxx xxxx xxxxx xxxx xxxx 0.3 Control Del:xxxxx xxxx xxxxx xxxxx xxxx xxxxx xxxxx xxxx xxxxx xxxxx xxxx 14.8 LOS by Move: * * * * * * * * * * * B Movement: LT - LTR - RT LT - LTR - RT LT - LTR - RT LT - LTR - RT Shared Cap.: xxxx xxxx xxxxx xxxx xxxx xxxxx xxxx xxxx 0 xxxx xxxx xxxxx SharedQueue:xxxxx xxxx xxxxx xxxxx xxxx xxxxx xxxxx xxxx xxxxx xxxxx xxxx xxxxx Shrd ConDel:xxxxx xxxx xxxxx xxxxx xxxx xxxxx xxxxx xxxx xxxxx xxxxx xxxx xxxxx Shared LOS: * * * * * * * * * * * * ApproachDel: xxxxxx xxxxxx xxxxxx 14.8 ApproachLOS: * * * B Note: Queue reported is the number of cars per lane. SHORT TERM PLUS PROJECT AM STNP AM Wed Sep 7, :18:57 Page Level Of Service Computation Report 2000 HCM Unsignalized Method (Future Volume Alternative) Intersection #3 Rocklin Road/ Rocklin Manor Dr Average Delay (sec/veh): 1.3 Worst Case Level Of Service: C[ 17.8] Street Name: Roklin Road Rocklin Manor Dr Approach: North Bound South Bound East Bound West Bound Movement: L - T - R L - T - R L - T - R L - T - R Control: Stop Sign Stop Sign Uncontrolled Uncontrolled Rights: Include Include Include Include Lanes: 0 0 1! Volume Module: Base Vol: Growth Adj: Initial Bse: Added Vol: PasserByVol: Initial Fut: User Adj: PHF Adj: PHF Volume: Reduct Vol: FinalVolume: Critical Gap Module: Critical Gp: xxxxx xxxx xxxxx xxxxx xxxx xxxxx 4.1 xxxx xxxxx FollowUpTim: xxxxx xxxx xxxxx xxxxx xxxx xxxxx 2.2 xxxx xxxxx Capacity Module: Cnflict Vol: xxxx xxxx xxxxx xxxx xxxx xxxxx 596 xxxx xxxxx Potent Cap.: xxxx xxxx xxxxx xxxx xxxx xxxxx 990 xxxx xxxxx Move Cap.: xxxx xxxx xxxxx xxxx xxxx xxxxx 990 xxxx xxxxx Total Cap: xxxxx xxxxx xxxx xxxx xxxxx xxxx xxxx xxxxx Volume/Cap: xxxx xxxx xxxx xxxx xxxx xxxx 0.02 xxxx xxxx Level Of Service Module: 2Way95thQ: xxxx xxxx xxxxx xxxx xxxx xxxxx xxxx xxxx xxxxx 0.0 xxxx xxxxx Control Del:xxxxx xxxx xxxxx xxxxx xxxx xxxxx xxxxx xxxx xxxxx 8.7 xxxx xxxxx LOS by Move: * * * * * * * * * A * * Movement: LT - LTR - RT LT - LTR - RT LT - LTR - RT LT - LTR - RT Shared Cap.: xxxx 364 xxxxx xxxx xxxx xxxxx xxxx xxxx xxxxx xxxx xxxx xxxxx SharedQueue:xxxxx 0.9 xxxxx xxxxx xxxx xxxxx xxxxx xxxx xxxxx xxxxx xxxx xxxxx Shrd ConDel:xxxxx 17.8 xxxxx xxxxx xxxx xxxxx xxxxx xxxx xxxxx xxxxx xxxx xxxxx Shared LOS: * C * * * * * * * * * * ApproachDel: 17.8 xxxxxx xxxxxx xxxxxx ApproachLOS: C * * * Note: Queue reported is the number of cars per lane. Traffix (c) 2008 Dowling Assoc. Licensed to OMNI-MEANS, ROSEVILLE,CA Traffix (c) 2008 Dowling Assoc. Licensed to OMNI-MEANS, ROSEVILLE,CA
70 SHORT TERM PLUS PROJECT PM STNP PM Wed Sep 7, :22:29 Page Scenario Report Scenario: STNP PM Command: Volume: Geometry: Impact Fee: Trip Generation: Trip Distribution: Paths: Routes: Configuration: Default Command STNP PM Default Geometry Default Impact Fee AM STPP Default Path Default Route Default Configuration STNP PM Wed Sep 7, :22:29 Page Level Of Service Computation Report Circular 212 Planning Method (Future Volume Alternative) Intersection #1 Rocklin Road/ Sierra College Cycle (sec): 100 Critical Vol./Cap.(X): Loss Time (sec): 0 Average Delay (sec/veh): xxxxxx Optimal Cycle: 180 Level Of Service: D Street Name: Rocklin Road Sierra College Approach: North Bound South Bound East Bound West Bound Movement: L - T - R L - T - R L - T - R L - T - R Control: Protected Protected Protected Protected Rights: Include Include Include Include Min. Green: Y+R: Lanes: Volume Module: Base Vol: Growth Adj: Initial Bse: Added Vol: PasserByVol: Initial Fut: User Adj: PHF Adj: PHF Volume: Reduct Vol: Reduced Vol: PCE Adj: MLF Adj: FinalVolume: Saturation Flow Module: Sat/Lane: Adjustment: Lanes: Final Sat.: Capacity Analysis Module: Vol/Sat: Crit Volume: Crit Moves: **** **** **** **** Traffix (c) 2008 Dowling Assoc. Licensed to OMNI-MEANS, ROSEVILLE,CA Traffix (c) 2008 Dowling Assoc. Licensed to OMNI-MEANS, ROSEVILLE,CA
71 SHORT TERM PLUS PROJECT PM SHORT TERM PLUS PROJECT PM STNP PM Wed Sep 7, :22:29 Page Level Of Service Computation Report 2000 HCM Unsignalized Method (Future Volume Alternative) Intersection #2 Sierra College Blvd/Water Lily Lane Average Delay (sec/veh): 0.1 Worst Case Level Of Service: C[ 16.1] Street Name: Sierra College Blvd Water Lily Lane Approach: North Bound South Bound East Bound West Bound Movement: L - T - R L - T - R L - T - R L - T - R Control: Uncontrolled Uncontrolled Stop Sign Stop Sign Rights: Include Include Include Include Lanes: Volume Module: Base Vol: Growth Adj: Initial Bse: Added Vol: PasserByVol: Initial Fut: User Adj: PHF Adj: PHF Volume: Reduct Vol: FinalVolume: Critical Gap Module: Critical Gp:xxxxx xxxx xxxxx xxxxx xxxx xxxxx xxxxx xxxxx xxxx 6.9 FollowUpTim:xxxxx xxxx xxxxx xxxxx xxxx xxxxx xxxxx xxxxx xxxx 3.3 Capacity Module: Cnflict Vol: xxxx xxxx xxxxx xxxx xxxx xxxxx xxxx xxxx xxxx 776 Potent Cap.: xxxx xxxx xxxxx xxxx xxxx xxxxx xxxx xxxx xxxx 344 Move Cap.: xxxx xxxx xxxxx xxxx xxxx xxxxx xxxx xxxx xxxx 344 Volume/Cap: xxxx xxxx xxxx xxxx xxxx xxxx xxxx xxxx xxxx 0.05 Level Of Service Module: 2Way95thQ: xxxx xxxx xxxxx xxxx xxxx xxxxx xxxx xxxx xxxxx xxxx xxxx 0.2 Control Del:xxxxx xxxx xxxxx xxxxx xxxx xxxxx xxxxx xxxx xxxxx xxxxx xxxx 16.1 LOS by Move: * * * * * * * * * * * C Movement: LT - LTR - RT LT - LTR - RT LT - LTR - RT LT - LTR - RT Shared Cap.: xxxx xxxx xxxxx xxxx xxxx xxxxx xxxx xxxx 0 xxxx xxxx xxxxx SharedQueue:xxxxx xxxx xxxxx xxxxx xxxx xxxxx xxxxx xxxx xxxxx xxxxx xxxx xxxxx Shrd ConDel:xxxxx xxxx xxxxx xxxxx xxxx xxxxx xxxxx xxxx xxxxx xxxxx xxxx xxxxx Shared LOS: * * * * * * * * * * * * ApproachDel: xxxxxx xxxxxx xxxxxx 16.1 ApproachLOS: * * * C Note: Queue reported is the number of cars per lane. STNP PM Wed Sep 7, :22:29 Page Level Of Service Computation Report 2000 HCM Unsignalized Method (Future Volume Alternative) Intersection #3 Rocklin Road/ Rocklin Manor Dr Average Delay (sec/veh): 0.9 Worst Case Level Of Service: C[ 16.1] Street Name: Roklin Road Rocklin Manor Dr Approach: North Bound South Bound East Bound West Bound Movement: L - T - R L - T - R L - T - R L - T - R Control: Stop Sign Stop Sign Uncontrolled Uncontrolled Rights: Include Include Include Include Lanes: 0 0 1! Volume Module: Base Vol: Growth Adj: Initial Bse: Added Vol: PasserByVol: Initial Fut: User Adj: PHF Adj: PHF Volume: Reduct Vol: FinalVolume: Critical Gap Module: Critical Gp: xxxxx xxxx xxxxx xxxxx xxxx xxxxx 4.1 xxxx xxxxx FollowUpTim: xxxxx xxxx xxxxx xxxxx xxxx xxxxx 2.2 xxxx xxxxx Capacity Module: Cnflict Vol: xxxx xxxx xxxxx xxxx xxxx xxxxx 673 xxxx xxxxx Potent Cap.: xxxx xxxx xxxxx xxxx xxxx xxxxx 927 xxxx xxxxx Move Cap.: xxxx xxxx xxxxx xxxx xxxx xxxxx 927 xxxx xxxxx Total Cap: xxxxx xxxxx xxxx xxxx xxxxx xxxx xxxx xxxxx Volume/Cap: xxxx xxxx xxxx xxxx xxxx xxxx 0.01 xxxx xxxx Level Of Service Module: 2Way95thQ: xxxx xxxx xxxxx xxxx xxxx xxxxx xxxx xxxx xxxxx 0.0 xxxx xxxxx Control Del:xxxxx xxxx xxxxx xxxxx xxxx xxxxx xxxxx xxxx xxxxx 8.9 xxxx xxxxx LOS by Move: * * * * * * * * * A * * Movement: LT - LTR - RT LT - LTR - RT LT - LTR - RT LT - LTR - RT Shared Cap.: xxxx 384 xxxxx xxxx xxxx xxxxx xxxx xxxx xxxxx xxxx xxxx xxxxx SharedQueue:xxxxx 0.5 xxxxx xxxxx xxxx xxxxx xxxxx xxxx xxxxx xxxxx xxxx xxxxx Shrd ConDel:xxxxx 16.1 xxxxx xxxxx xxxx xxxxx xxxxx xxxx xxxxx xxxxx xxxx xxxxx Shared LOS: * C * * * * * * * * * * ApproachDel: 16.1 xxxxxx xxxxxx xxxxxx ApproachLOS: C * * * Note: Queue reported is the number of cars per lane. Traffix (c) 2008 Dowling Assoc. Licensed to OMNI-MEANS, ROSEVILLE,CA Traffix (c) 2008 Dowling Assoc. Licensed to OMNI-MEANS, ROSEVILLE,CA
72 SHORT TERM PLUS PROJECT AM WITH WATERLILY ACCESS STNP AM Wed Sep 7, :55:26 Page Scenario Report Scenario: STNP AM Command: Default Command Volume: STNP AM Geometry: Default Geometry Impact Fee: Default Impact Fee Trip Generation: AM Trip Distribution: STPP Paths: Default Path Routes: Default Route Configuration: Default Configuration STNP AM Wed Sep 7, :55:26 Page Level Of Service Computation Report Circular 212 Planning Method (Future Volume Alternative) Intersection #1 Rocklin Road/ Sierra College Cycle (sec): 100 Critical Vol./Cap.(X): Loss Time (sec): 16 Average Delay (sec/veh): xxxxxx Optimal Cycle: 98 Level Of Service: C Street Name: Rocklin Road Sierra College Approach: North Bound South Bound East Bound West Bound Movement: L - T - R L - T - R L - T - R L - T - R Control: Protected Protected Protected Protected Rights: Include Include Include Include Min. Green: Y+R: Lanes: Volume Module: Base Vol: Growth Adj: Initial Bse: Added Vol: PasserByVol: Initial Fut: User Adj: PHF Adj: PHF Volume: Reduct Vol: Reduced Vol: PCE Adj: MLF Adj: FinalVolume: Saturation Flow Module: Sat/Lane: Adjustment: Lanes: Final Sat.: Capacity Analysis Module: Vol/Sat: Crit Volume: Crit Moves: **** **** **** **** Traffix (c) 2008 Dowling Assoc. Licensed to OMNI-MEANS, ROSEVILLE,CA Traffix (c) 2008 Dowling Assoc. Licensed to OMNI-MEANS, ROSEVILLE,CA
73 SHORT TERM PLUS PROJECT AM WITH WATERLILY ACCESS SHORT TERM PLUS PROJECT AM WITH WATERLILY ACCESS STNP AM Wed Sep 7, :55:26 Page Level Of Service Computation Report 2000 HCM Unsignalized Method (Future Volume Alternative) Intersection #2 Sierra College Blvd/Water Lily Lane Average Delay (sec/veh): 0.4 Worst Case Level Of Service: C[ 15.6] Street Name: Sierra College Blvd Water Lily Lane Approach: North Bound South Bound East Bound West Bound Movement: L - T - R L - T - R L - T - R L - T - R Control: Uncontrolled Uncontrolled Stop Sign Stop Sign Rights: Include Include Include Include Lanes: Volume Module: Base Vol: Growth Adj: Initial Bse: Added Vol: PasserByVol: Initial Fut: User Adj: PHF Adj: PHF Volume: Reduct Vol: FinalVolume: Critical Gap Module: Critical Gp:xxxxx xxxx xxxxx xxxxx xxxx xxxxx xxxxx xxxxx xxxx 6.9 FollowUpTim:xxxxx xxxx xxxxx xxxxx xxxx xxxxx xxxxx xxxxx xxxx 3.3 Capacity Module: Cnflict Vol: xxxx xxxx xxxxx xxxx xxxx xxxxx xxxx xxxx xxxx 658 Potent Cap.: xxxx xxxx xxxxx xxxx xxxx xxxxx xxxx xxxx xxxx 411 Move Cap.: xxxx xxxx xxxxx xxxx xxxx xxxxx xxxx xxxx xxxx 411 Volume/Cap: xxxx xxxx xxxx xxxx xxxx xxxx xxxx xxxx xxxx 0.18 Level Of Service Module: 2Way95thQ: xxxx xxxx xxxxx xxxx xxxx xxxxx xxxx xxxx xxxxx xxxx xxxx 0.6 Control Del:xxxxx xxxx xxxxx xxxxx xxxx xxxxx xxxxx xxxx xxxxx xxxxx xxxx 15.6 LOS by Move: * * * * * * * * * * * C Movement: LT - LTR - RT LT - LTR - RT LT - LTR - RT LT - LTR - RT Shared Cap.: xxxx xxxx xxxxx xxxx xxxx xxxxx xxxx xxxx 0 xxxx xxxx xxxxx SharedQueue:xxxxx xxxx xxxxx xxxxx xxxx xxxxx xxxxx xxxx xxxxx xxxxx xxxx xxxxx Shrd ConDel:xxxxx xxxx xxxxx xxxxx xxxx xxxxx xxxxx xxxx xxxxx xxxxx xxxx xxxxx Shared LOS: * * * * * * * * * * * * ApproachDel: xxxxxx xxxxxx xxxxxx 15.6 ApproachLOS: * * * C Note: Queue reported is the number of cars per lane. STNP AM Wed Sep 7, :55:26 Page Level Of Service Computation Report 2000 HCM Unsignalized Method (Future Volume Alternative) Intersection #3 Rocklin Road/ Rocklin Manor Dr Average Delay (sec/veh): 1.3 Worst Case Level Of Service: C[ 16.9] Street Name: Roklin Road Rocklin Manor Dr Approach: North Bound South Bound East Bound West Bound Movement: L - T - R L - T - R L - T - R L - T - R Control: Stop Sign Stop Sign Uncontrolled Uncontrolled Rights: Include Include Include Include Lanes: 0 0 1! Volume Module: Base Vol: Growth Adj: Initial Bse: Added Vol: PasserByVol: Initial Fut: User Adj: PHF Adj: PHF Volume: Reduct Vol: FinalVolume: Critical Gap Module: Critical Gp: xxxxx xxxx xxxxx xxxxx xxxx xxxxx 4.1 xxxx xxxxx FollowUpTim: xxxxx xxxx xxxxx xxxxx xxxx xxxxx 2.2 xxxx xxxxx Capacity Module: Cnflict Vol: xxxx xxxx xxxxx xxxx xxxx xxxxx 531 xxxx xxxxx Potent Cap.: xxxx xxxx xxxxx xxxx xxxx xxxxx 1047 xxxx xxxxx Move Cap.: xxxx xxxx xxxxx xxxx xxxx xxxxx 1047 xxxx xxxxx Total Cap: xxxxx xxxxx xxxx xxxx xxxxx xxxx xxxx xxxxx Volume/Cap: xxxx xxxx xxxx xxxx xxxx xxxx 0.00 xxxx xxxx Level Of Service Module: 2Way95thQ: xxxx xxxx xxxxx xxxx xxxx xxxxx xxxx xxxx xxxxx 0.0 xxxx xxxxx Control Del:xxxxx xxxx xxxxx xxxxx xxxx xxxxx xxxxx xxxx xxxxx 8.5 xxxx xxxxx LOS by Move: * * * * * * * * * A * * Movement: LT - LTR - RT LT - LTR - RT LT - LTR - RT LT - LTR - RT Shared Cap.: xxxx 395 xxxxx xxxx xxxx xxxxx xxxx xxxx xxxxx xxxx xxxx xxxxx SharedQueue:xxxxx 0.9 xxxxx xxxxx xxxx xxxxx xxxxx xxxx xxxxx xxxxx xxxx xxxxx Shrd ConDel:xxxxx 16.9 xxxxx xxxxx xxxx xxxxx xxxxx xxxx xxxxx xxxxx xxxx xxxxx Shared LOS: * C * * * * * * * * * * ApproachDel: 16.9 xxxxxx xxxxxx xxxxxx ApproachLOS: C * * * Note: Queue reported is the number of cars per lane. Traffix (c) 2008 Dowling Assoc. Licensed to OMNI-MEANS, ROSEVILLE,CA Traffix (c) 2008 Dowling Assoc. Licensed to OMNI-MEANS, ROSEVILLE,CA
74 SHORT TERM PLUS PROJECT PM WITH WATERLILY ACCESS STNP PM Wed Sep 7, :56:49 Page Scenario Report Scenario: STNP PM Command: Default Command Volume: STNP PM Geometry: Default Geometry Impact Fee: Default Impact Fee Trip Generation: PM Trip Distribution: STPP Paths: Default Path Routes: Default Route Configuration: Default Configuration STNP PM Wed Sep 7, :56:50 Page Level Of Service Computation Report Circular 212 Planning Method (Future Volume Alternative) Intersection #1 Rocklin Road/ Sierra College Cycle (sec): 100 Critical Vol./Cap.(X): Loss Time (sec): 16 Average Delay (sec/veh): xxxxxx Optimal Cycle: 180 Level Of Service: E Street Name: Rocklin Road Sierra College Approach: North Bound South Bound East Bound West Bound Movement: L - T - R L - T - R L - T - R L - T - R Control: Protected Protected Protected Protected Rights: Include Include Include Include Min. Green: Y+R: Lanes: Volume Module: Base Vol: Growth Adj: Initial Bse: Added Vol: PasserByVol: Initial Fut: User Adj: PHF Adj: PHF Volume: Reduct Vol: Reduced Vol: PCE Adj: MLF Adj: FinalVolume: Saturation Flow Module: Sat/Lane: Adjustment: Lanes: Final Sat.: Capacity Analysis Module: Vol/Sat: Crit Volume: Crit Moves: **** **** **** **** Traffix (c) 2008 Dowling Assoc. Licensed to OMNI-MEANS, ROSEVILLE,CA Traffix (c) 2008 Dowling Assoc. Licensed to OMNI-MEANS, ROSEVILLE,CA
75 SHORT TERM PLUS PROJECT PM WITH WATERLILY ACCESS SHORT TERM PLUS PROJECT PM WITH WATERLILY ACCESS STNP PM Wed Sep 7, :56:50 Page Level Of Service Computation Report 2000 HCM Unsignalized Method (Future Volume Alternative) Intersection #2 Sierra College Blvd/Water Lily Lane Average Delay (sec/veh): 0.2 Worst Case Level Of Service: C[ 16.7] Street Name: Sierra College Blvd Water Lily Lane Approach: North Bound South Bound East Bound West Bound Movement: L - T - R L - T - R L - T - R L - T - R Control: Uncontrolled Uncontrolled Stop Sign Stop Sign Rights: Include Include Include Include Lanes: Volume Module: Base Vol: Growth Adj: Initial Bse: Added Vol: PasserByVol: Initial Fut: User Adj: PHF Adj: PHF Volume: Reduct Vol: FinalVolume: Critical Gap Module: Critical Gp:xxxxx xxxx xxxxx xxxxx xxxx xxxxx xxxxx xxxxx xxxx 6.9 FollowUpTim:xxxxx xxxx xxxxx xxxxx xxxx xxxxx xxxxx xxxxx xxxx 3.3 Capacity Module: Cnflict Vol: xxxx xxxx xxxxx xxxx xxxx xxxxx xxxx xxxx xxxx 776 Potent Cap.: xxxx xxxx xxxxx xxxx xxxx xxxxx xxxx xxxx xxxx 344 Move Cap.: xxxx xxxx xxxxx xxxx xxxx xxxxx xxxx xxxx xxxx 344 Volume/Cap: xxxx xxxx xxxx xxxx xxxx xxxx xxxx xxxx xxxx 0.10 Level Of Service Module: 2Way95thQ: xxxx xxxx xxxxx xxxx xxxx xxxxx xxxx xxxx xxxxx xxxx xxxx 0.3 Control Del:xxxxx xxxx xxxxx xxxxx xxxx xxxxx xxxxx xxxx xxxxx xxxxx xxxx 16.7 LOS by Move: * * * * * * * * * * * C Movement: LT - LTR - RT LT - LTR - RT LT - LTR - RT LT - LTR - RT Shared Cap.: xxxx xxxx xxxxx xxxx xxxx xxxxx xxxx xxxx 0 xxxx xxxx xxxxx SharedQueue:xxxxx xxxx xxxxx xxxxx xxxx xxxxx xxxxx xxxx xxxxx xxxxx xxxx xxxxx Shrd ConDel:xxxxx xxxx xxxxx xxxxx xxxx xxxxx xxxxx xxxx xxxxx xxxxx xxxx xxxxx Shared LOS: * * * * * * * * * * * * ApproachDel: xxxxxx xxxxxx xxxxxx 16.7 ApproachLOS: * * * C Note: Queue reported is the number of cars per lane. STNP PM Wed Sep 7, :56:50 Page Level Of Service Computation Report 2000 HCM Unsignalized Method (Future Volume Alternative) Intersection #3 Rocklin Road/ Rocklin Manor Dr Average Delay (sec/veh): 0.6 Worst Case Level Of Service: C[ 15.3] Street Name: Roklin Road Rocklin Manor Dr Approach: North Bound South Bound East Bound West Bound Movement: L - T - R L - T - R L - T - R L - T - R Control: Stop Sign Stop Sign Uncontrolled Uncontrolled Rights: Include Include Include Include Lanes: 0 0 1! Volume Module: Base Vol: Growth Adj: Initial Bse: Added Vol: PasserByVol: Initial Fut: User Adj: PHF Adj: PHF Volume: Reduct Vol: FinalVolume: Critical Gap Module: Critical Gp: xxxxx xxxx xxxxx xxxxx xxxx xxxxx 4.1 xxxx xxxxx FollowUpTim: xxxxx xxxx xxxxx xxxxx xxxx xxxxx 2.2 xxxx xxxxx Capacity Module: Cnflict Vol: xxxx xxxx xxxxx xxxx xxxx xxxxx 672 xxxx xxxxx Potent Cap.: xxxx xxxx xxxxx xxxx xxxx xxxxx 928 xxxx xxxxx Move Cap.: xxxx xxxx xxxxx xxxx xxxx xxxxx 928 xxxx xxxxx Total Cap: xxxxx xxxxx xxxx xxxx xxxxx xxxx xxxx xxxxx Volume/Cap: xxxx xxxx xxxx xxxx xxxx xxxx 0.01 xxxx xxxx Level Of Service Module: 2Way95thQ: xxxx xxxx xxxxx xxxx xxxx xxxxx xxxx xxxx xxxxx 0.0 xxxx xxxxx Control Del:xxxxx xxxx xxxxx xxxxx xxxx xxxxx xxxxx xxxx xxxxx 8.9 xxxx xxxxx LOS by Move: * * * * * * * * * A * * Movement: LT - LTR - RT LT - LTR - RT LT - LTR - RT LT - LTR - RT Shared Cap.: xxxx 394 xxxxx xxxx xxxx xxxxx xxxx xxxx xxxxx xxxx xxxx xxxxx SharedQueue:xxxxx 0.4 xxxxx xxxxx xxxx xxxxx xxxxx xxxx xxxxx xxxxx xxxx xxxxx Shrd ConDel:xxxxx 15.3 xxxxx xxxxx xxxx xxxxx xxxxx xxxx xxxxx xxxxx xxxx xxxxx Shared LOS: * C * * * * * * * * * * ApproachDel: 15.3 xxxxxx xxxxxx xxxxxx ApproachLOS: C * * * Note: Queue reported is the number of cars per lane. Traffix (c) 2008 Dowling Assoc. Licensed to OMNI-MEANS, ROSEVILLE,CA Traffix (c) 2008 Dowling Assoc. Licensed to OMNI-MEANS, ROSEVILLE,CA
76 CNP_AM.txt Level Of Service Computation Report Circular 212 Planning Method (Base Volume Alternative) Intersection #1 Rocklin Road/ Sierra College Cycle (sec): 180 Critical Vol./Cap.(X): Loss Time (sec): 0 Average Delay (sec/veh): xxxxxx Optimal Cycle: 180 Level Of Service: E Street Name: Rocklin Road Sierra College Approach: North Bound South Bound East Bound West Bound Movement: L - T - R L - T - R L - T - R L - T - R Control: Protected Protected Protected Protected Rights: Include Include Ovl Include Min. Green: Y+R: Lanes: Volume Module: Base Vol: Growth Adj: Initial Bse: User Adj: PHF Adj: PHF Volume: Reduct Vol: Reduced Vol: PCE Adj: MLF Adj: FinalVolume: Saturation Flow Module: Sat/Lane: Adjustment: Lanes: Final Sat.: Capacity Analysis Module: Vol/Sat: Crit Volume: Crit Moves: **** **** **** **** Traffix (c) 2008 Dowling Assoc. Licensed to OMNI-MEANS, ROSEVILLE,CA CUMNP AM Mon Nov 23, :16:15 Page Level Of Service Computation Report 2000 HCM Unsignalized Method (Base Volume Alternative) Page 3
77 CNP_AM.txt Intersection #2 Sierra College Blvd/Water Lily Lane Average Delay (sec/veh): 0.3 Worst Case Level Of Service: C[ 18.6] Street Name: Sierra College Blvd Water Lily Lane Approach: North Bound South Bound East Bound West Bound Movement: L - T - R L - T - R L - T - R L - T - R Control: Uncontrolled Uncontrolled Stop Sign Stop Sign Rights: Include Include Include Include Lanes: Volume Module: Base Vol: Growth Adj: Initial Bse: User Adj: PHF Adj: PHF Volume: Reduct Vol: FinalVolume: Critical Gap Module: Critical Gp:xxxxx xxxx xxxxx xxxxx xxxx xxxxx xxxxx xxxxx xxxx 6.9 FollowUpTim:xxxxx xxxx xxxxx xxxxx xxxx xxxxx xxxxx xxxxx xxxx 3.3 Capacity Module: Cnflict Vol: xxxx xxxx xxxxx xxxx xxxx xxxxx xxxx xxxx xxxx 802 Potent Cap.: xxxx xxxx xxxxx xxxx xxxx xxxxx xxxx xxxx xxxx 331 Move Cap.: xxxx xxxx xxxxx xxxx xxxx xxxxx xxxx xxxx xxxx 331 Volume/Cap: xxxx xxxx xxxx xxxx xxxx xxxx xxxx xxxx xxxx 0.21 Level Of Service Module: 2Way95thQ: xxxx xxxx xxxxx xxxx xxxx xxxxx xxxx xxxx xxxxx xxxx xxxx 0.8 Control Del:xxxxx xxxx xxxxx xxxxx xxxx xxxxx xxxxx xxxx xxxxx xxxxx xxxx 18.6 LOS by Move: * * * * * * * * * * * C Movement: LT - LTR - RT LT - LTR - RT LT - LTR - RT LT - LTR - RT Shared Cap.: xxxx xxxx xxxxx xxxx xxxx xxxxx xxxx xxxx 0 xxxx xxxx xxxxx SharedQueue:xxxxx xxxx xxxxx xxxxx xxxx xxxxx xxxxx xxxx xxxxx xxxxx xxxx xxxxx Shrd ConDel:xxxxx xxxx xxxxx xxxxx xxxx xxxxx xxxxx xxxx xxxxx xxxxx xxxx xxxxx Shared LOS: * * * * * * * * * * * * ApproachDel: xxxxxx xxxxxx xxxxxx 18.6 ApproachLOS: * * * C Note: Queue reported is the number of cars per lane. Traffix (c) 2008 Dowling Assoc. Licensed to OMNI-MEANS, ROSEVILLE,CA CUMNP AM Mon Nov 23, :16:16 Page Level Of Service Computation Report 2000 HCM Unsignalized Method (Base Volume Alternative) Intersection #3 Rocklin Road/ Rocklin Manor Dr Average Delay (sec/veh): 0.7 Worst Case Level Of Service: B[ 14.1] Page 4
78 CNP_AM.txt Street Name: Roklin Road Rocklin Manor Dr Approach: North Bound South Bound East Bound West Bound Movement: L - T - R L - T - R L - T - R L - T - R Control: Stop Sign Stop Sign Uncontrolled Uncontrolled Rights: Include Include Include Include Lanes: 0 0 1! Volume Module: Base Vol: Growth Adj: Initial Bse: User Adj: PHF Adj: PHF Volume: Reduct Vol: FinalVolume: Critical Gap Module: Critical Gp: xxxxx xxxx xxxxx xxxxx xxxx xxxxx 4.1 xxxx xxxxx FollowUpTim: xxxxx xxxx xxxxx xxxxx xxxx xxxxx 2.2 xxxx xxxxx Capacity Module: Cnflict Vol: xxxx xxxx xxxxx xxxx xxxx xxxxx 595 xxxx xxxxx Potent Cap.: xxxx xxxx xxxxx xxxx xxxx xxxxx 991 xxxx xxxxx Move Cap.: xxxx xxxx xxxxx xxxx xxxx xxxxx 991 xxxx xxxxx Total Cap: xxxxx xxxxx xxxx xxxx xxxxx xxxx xxxx xxxxx Volume/Cap: xxxx xxxx xxxx xxxx xxxx xxxx 0.01 xxxx xxxx Level Of Service Module: 2Way95thQ: xxxx xxxx xxxxx xxxx xxxx xxxxx xxxx xxxx xxxxx 0.0 xxxx xxxxx Control Del:xxxxx xxxx xxxxx xxxxx xxxx xxxxx xxxxx xxxx xxxxx 8.7 xxxx xxxxx LOS by Move: * * * * * * * * * A * * Movement: LT - LTR - RT LT - LTR - RT LT - LTR - RT LT - LTR - RT Shared Cap.: xxxx 444 xxxxx xxxx xxxx xxxxx xxxx xxxx xxxxx xxxx xxxx xxxxx SharedQueue:xxxxx 0.4 xxxxx xxxxx xxxx xxxxx xxxxx xxxx xxxxx xxxxx xxxx xxxxx Shrd ConDel:xxxxx 14.1 xxxxx xxxxx xxxx xxxxx xxxxx xxxx xxxxx xxxxx xxxx xxxxx Shared LOS: * B * * * * * * * * * * ApproachDel: 14.1 xxxxxx xxxxxx xxxxxx ApproachLOS: B * * * Note: Queue reported is the number of cars per lane. Traffix (c) 2008 Dowling Assoc. Licensed to OMNI-MEANS, ROSEVILLE,CA Page 5
79 CNP_PM.txt Level Of Service Computation Report Circular 212 Planning Method (Base Volume Alternative) Intersection #1 Rocklin Road/ Sierra College Cycle (sec): 180 Critical Vol./Cap.(X): Loss Time (sec): 0 Average Delay (sec/veh): xxxxxx Optimal Cycle: 180 Level Of Service: E Street Name: Rocklin Road Sierra College Approach: North Bound South Bound East Bound West Bound Movement: L - T - R L - T - R L - T - R L - T - R Control: Protected Protected Protected Protected Rights: Include Include Ovl Include Min. Green: Y+R: Lanes: Volume Module: Base Vol: Growth Adj: Initial Bse: User Adj: PHF Adj: PHF Volume: Reduct Vol: Reduced Vol: PCE Adj: MLF Adj: FinalVolume: Saturation Flow Module: Sat/Lane: Adjustment: Lanes: Final Sat.: Capacity Analysis Module: Vol/Sat: Crit Volume: Crit Moves: **** **** **** **** Traffix (c) 2008 Dowling Assoc. Licensed to OMNI-MEANS, ROSEVILLE,CA CUMNP PM Mon Nov 23, :29:48 Page Level Of Service Computation Report 2000 HCM Unsignalized Method (Base Volume Alternative) Page 3
80 CNP_PM.txt Intersection #2 Sierra College Blvd/Water Lily Lane Average Delay (sec/veh): 0.2 Worst Case Level Of Service: C[ 17.4] Street Name: Sierra College Blvd Water Lily Lane Approach: North Bound South Bound East Bound West Bound Movement: L - T - R L - T - R L - T - R L - T - R Control: Uncontrolled Uncontrolled Stop Sign Stop Sign Rights: Include Include Include Include Lanes: Volume Module: Base Vol: Growth Adj: Initial Bse: User Adj: PHF Adj: PHF Volume: Reduct Vol: FinalVolume: Critical Gap Module: Critical Gp:xxxxx xxxx xxxxx xxxxx xxxx xxxxx xxxxx xxxxx xxxx 6.9 FollowUpTim:xxxxx xxxx xxxxx xxxxx xxxx xxxxx xxxxx xxxxx xxxx 3.3 Capacity Module: Cnflict Vol: xxxx xxxx xxxxx xxxx xxxx xxxxx xxxx xxxx xxxx 796 Potent Cap.: xxxx xxxx xxxxx xxxx xxxx xxxxx xxxx xxxx xxxx 334 Move Cap.: xxxx xxxx xxxxx xxxx xxxx xxxxx xxxx xxxx xxxx 334 Volume/Cap: xxxx xxxx xxxx xxxx xxxx xxxx xxxx xxxx xxxx 0.13 Level Of Service Module: 2Way95thQ: xxxx xxxx xxxxx xxxx xxxx xxxxx xxxx xxxx xxxxx xxxx xxxx 0.5 Control Del:xxxxx xxxx xxxxx xxxxx xxxx xxxxx xxxxx xxxx xxxxx xxxxx xxxx 17.4 LOS by Move: * * * * * * * * * * * C Movement: LT - LTR - RT LT - LTR - RT LT - LTR - RT LT - LTR - RT Shared Cap.: xxxx xxxx xxxxx xxxx xxxx xxxxx xxxx xxxx 0 xxxx xxxx xxxxx SharedQueue:xxxxx xxxx xxxxx xxxxx xxxx xxxxx xxxxx xxxx xxxxx xxxxx xxxx xxxxx Shrd ConDel:xxxxx xxxx xxxxx xxxxx xxxx xxxxx xxxxx xxxx xxxxx xxxxx xxxx xxxxx Shared LOS: * * * * * * * * * * * * ApproachDel: xxxxxx xxxxxx xxxxxx 17.4 ApproachLOS: * * * C Note: Queue reported is the number of cars per lane. Traffix (c) 2008 Dowling Assoc. Licensed to OMNI-MEANS, ROSEVILLE,CA CUMNP PM Mon Nov 23, :29:49 Page Level Of Service Computation Report 2000 HCM Unsignalized Method (Base Volume Alternative) Intersection #3 Rocklin Road/ Rocklin Manor Dr Average Delay (sec/veh): 0.6 Worst Case Level Of Service: C[ 16.5] Page 4
81 CNP_PM.txt Street Name: Roklin Road Rocklin Manor Dr Approach: North Bound South Bound East Bound West Bound Movement: L - T - R L - T - R L - T - R L - T - R Control: Stop Sign Stop Sign Uncontrolled Uncontrolled Rights: Include Include Include Include Lanes: 0 0 1! Volume Module: Base Vol: Growth Adj: Initial Bse: User Adj: PHF Adj: PHF Volume: Reduct Vol: FinalVolume: Critical Gap Module: Critical Gp: xxxxx xxxx xxxxx xxxxx xxxx xxxxx 4.1 xxxx xxxxx FollowUpTim: xxxxx xxxx xxxxx xxxxx xxxx xxxxx 2.2 xxxx xxxxx Capacity Module: Cnflict Vol: xxxx xxxx xxxxx xxxx xxxx xxxxx 876 xxxx xxxxx Potent Cap.: xxxx xxxx xxxxx xxxx xxxx xxxxx 779 xxxx xxxxx Move Cap.: xxxx xxxx xxxxx xxxx xxxx xxxxx 779 xxxx xxxxx Total Cap: xxxxx xxxxx xxxx xxxx xxxxx xxxx xxxx xxxxx Volume/Cap: xxxx xxxx xxxx xxxx xxxx xxxx 0.01 xxxx xxxx Level Of Service Module: 2Way95thQ: xxxx xxxx xxxxx xxxx xxxx xxxxx xxxx xxxx xxxxx 0.0 xxxx xxxxx Control Del:xxxxx xxxx xxxxx xxxxx xxxx xxxxx xxxxx xxxx xxxxx 9.7 xxxx xxxxx LOS by Move: * * * * * * * * * A * * Movement: LT - LTR - RT LT - LTR - RT LT - LTR - RT LT - LTR - RT Shared Cap.: xxxx 352 xxxxx xxxx xxxx xxxxx xxxx xxxx xxxxx xxxx xxxx xxxxx SharedQueue:xxxxx 0.4 xxxxx xxxxx xxxx xxxxx xxxxx xxxx xxxxx xxxxx xxxx xxxxx Shrd ConDel:xxxxx 16.5 xxxxx xxxxx xxxx xxxxx xxxxx xxxx xxxxx xxxxx xxxx xxxxx Shared LOS: * C * * * * * * * * * * ApproachDel: 16.5 xxxxxx xxxxxx xxxxxx ApproachLOS: C * * * Note: Queue reported is the number of cars per lane. Traffix (c) 2008 Dowling Assoc. Licensed to OMNI-MEANS, ROSEVILLE,CA Page 5
82 CPP_AM.txt Level Of Service Computation Report Circular 212 Planning Method (Base Volume Alternative) Intersection #1 Rocklin Road/ Sierra College Cycle (sec): 180 Critical Vol./Cap.(X): Loss Time (sec): 0 Average Delay (sec/veh): xxxxxx Optimal Cycle: 180 Level Of Service: E Street Name: Rocklin Road Sierra College Approach: North Bound South Bound East Bound West Bound Movement: L - T - R L - T - R L - T - R L - T - R Control: Protected Protected Protected Protected Rights: Include Include Ovl Include Min. Green: Y+R: Lanes: Volume Module: Base Vol: Growth Adj: Initial Bse: User Adj: PHF Adj: PHF Volume: Reduct Vol: Reduced Vol: PCE Adj: MLF Adj: FinalVolume: Saturation Flow Module: Sat/Lane: Adjustment: Lanes: Final Sat.: Capacity Analysis Module: Vol/Sat: Crit Volume: Crit Moves: **** **** **** **** Traffix (c) 2008 Dowling Assoc. Licensed to OMNI-MEANS, ROSEVILLE,CA CUMPP AM Mon Nov 23, :14:55 Page Level Of Service Computation Report 2000 HCM Unsignalized Method (Base Volume Alternative) Page 3
83 CPP_AM.txt Intersection #2 Sierra College Blvd/Water Lily Lane Average Delay (sec/veh): 0.3 Worst Case Level Of Service: C[ 18.7] Street Name: Sierra College Blvd Water Lily Lane Approach: North Bound South Bound East Bound West Bound Movement: L - T - R L - T - R L - T - R L - T - R Control: Uncontrolled Uncontrolled Stop Sign Stop Sign Rights: Include Include Include Include Lanes: Volume Module: Base Vol: Growth Adj: Initial Bse: User Adj: PHF Adj: PHF Volume: Reduct Vol: FinalVolume: Critical Gap Module: Critical Gp:xxxxx xxxx xxxxx xxxxx xxxx xxxxx xxxxx xxxxx xxxx 6.9 FollowUpTim:xxxxx xxxx xxxxx xxxxx xxxx xxxxx xxxxx xxxxx xxxx 3.3 Capacity Module: Cnflict Vol: xxxx xxxx xxxxx xxxx xxxx xxxxx xxxx xxxx xxxx 803 Potent Cap.: xxxx xxxx xxxxx xxxx xxxx xxxxx xxxx xxxx xxxx 331 Move Cap.: xxxx xxxx xxxxx xxxx xxxx xxxxx xxxx xxxx xxxx 331 Volume/Cap: xxxx xxxx xxxx xxxx xxxx xxxx xxxx xxxx xxxx 0.21 Level Of Service Module: 2Way95thQ: xxxx xxxx xxxxx xxxx xxxx xxxxx xxxx xxxx xxxxx xxxx xxxx 0.8 Control Del:xxxxx xxxx xxxxx xxxxx xxxx xxxxx xxxxx xxxx xxxxx xxxxx xxxx 18.7 LOS by Move: * * * * * * * * * * * C Movement: LT - LTR - RT LT - LTR - RT LT - LTR - RT LT - LTR - RT Shared Cap.: xxxx xxxx xxxxx xxxx xxxx xxxxx xxxx xxxx 0 xxxx xxxx xxxxx SharedQueue:xxxxx xxxx xxxxx xxxxx xxxx xxxxx xxxxx xxxx xxxxx xxxxx xxxx xxxxx Shrd ConDel:xxxxx xxxx xxxxx xxxxx xxxx xxxxx xxxxx xxxx xxxxx xxxxx xxxx xxxxx Shared LOS: * * * * * * * * * * * * ApproachDel: xxxxxx xxxxxx xxxxxx 18.7 ApproachLOS: * * * C Note: Queue reported is the number of cars per lane. Traffix (c) 2008 Dowling Assoc. Licensed to OMNI-MEANS, ROSEVILLE,CA CUMPP AM Mon Nov 23, :14:55 Page Level Of Service Computation Report 2000 HCM Unsignalized Method (Base Volume Alternative) Intersection #3 Rocklin Road/ Rocklin Manor Dr Average Delay (sec/veh): 1.8 Worst Case Level Of Service: C[ 16.9] Page 4
84 CPP_AM.txt Street Name: Roklin Road Rocklin Manor Dr Approach: North Bound South Bound East Bound West Bound Movement: L - T - R L - T - R L - T - R L - T - R Control: Stop Sign Stop Sign Uncontrolled Uncontrolled Rights: Include Include Include Include Lanes: 0 0 1! Volume Module: Base Vol: Growth Adj: Initial Bse: User Adj: PHF Adj: PHF Volume: Reduct Vol: FinalVolume: Critical Gap Module: Critical Gp: xxxxx xxxx xxxxx xxxxx xxxx xxxxx 4.1 xxxx xxxxx FollowUpTim: xxxxx xxxx xxxxx xxxxx xxxx xxxxx 2.2 xxxx xxxxx Capacity Module: Cnflict Vol: xxxx xxxx xxxxx xxxx xxxx xxxxx 613 xxxx xxxxx Potent Cap.: xxxx xxxx xxxxx xxxx xxxx xxxxx 976 xxxx xxxxx Move Cap.: xxxx xxxx xxxxx xxxx xxxx xxxxx 976 xxxx xxxxx Total Cap: xxxxx xxxxx xxxx xxxx xxxxx xxxx xxxx xxxxx Volume/Cap: xxxx xxxx xxxx xxxx xxxx xxxx 0.01 xxxx xxxx Level Of Service Module: 2Way95thQ: xxxx xxxx xxxxx xxxx xxxx xxxxx xxxx xxxx xxxxx 0.0 xxxx xxxxx Control Del:xxxxx xxxx xxxxx xxxxx xxxx xxxxx xxxxx xxxx xxxxx 8.7 xxxx xxxxx LOS by Move: * * * * * * * * * A * * Movement: LT - LTR - RT LT - LTR - RT LT - LTR - RT LT - LTR - RT Shared Cap.: xxxx 432 xxxxx xxxx xxxx xxxxx xxxx xxxx xxxxx xxxx xxxx xxxxx SharedQueue:xxxxx 1.3 xxxxx xxxxx xxxx xxxxx xxxxx xxxx xxxxx xxxxx xxxx xxxxx Shrd ConDel:xxxxx 16.9 xxxxx xxxxx xxxx xxxxx xxxxx xxxx xxxxx xxxxx xxxx xxxxx Shared LOS: * C * * * * * * * * * * ApproachDel: 16.9 xxxxxx xxxxxx xxxxxx ApproachLOS: C * * * Note: Queue reported is the number of cars per lane. Traffix (c) 2008 Dowling Assoc. Licensed to OMNI-MEANS, ROSEVILLE,CA Page 5
85 CPP_PM.txt Level Of Service Computation Report Circular 212 Planning Method (Base Volume Alternative) Intersection #1 Rocklin Road/ Sierra College Cycle (sec): 180 Critical Vol./Cap.(X): Loss Time (sec): 0 Average Delay (sec/veh): xxxxxx Optimal Cycle: 180 Level Of Service: E Street Name: Rocklin Road Sierra College Approach: North Bound South Bound East Bound West Bound Movement: L - T - R L - T - R L - T - R L - T - R Control: Protected Protected Protected Protected Rights: Include Include Ovl Include Min. Green: Y+R: Lanes: Volume Module: Base Vol: Growth Adj: Initial Bse: User Adj: PHF Adj: PHF Volume: Reduct Vol: Reduced Vol: PCE Adj: MLF Adj: FinalVolume: Saturation Flow Module: Sat/Lane: Adjustment: Lanes: Final Sat.: Capacity Analysis Module: Vol/Sat: Crit Volume: Crit Moves: **** **** **** **** Traffix (c) 2008 Dowling Assoc. Licensed to OMNI-MEANS, ROSEVILLE,CA CUMPP PM Mon Nov 23, :22:55 Page Level Of Service Computation Report 2000 HCM Unsignalized Method (Base Volume Alternative) Page 3
86 CPP_PM.txt Intersection #2 Sierra College Blvd/Water Lily Lane Average Delay (sec/veh): 0.2 Worst Case Level Of Service: C[ 17.5] Street Name: Sierra College Blvd Water Lily Lane Approach: North Bound South Bound East Bound West Bound Movement: L - T - R L - T - R L - T - R L - T - R Control: Uncontrolled Uncontrolled Stop Sign Stop Sign Rights: Include Include Include Include Lanes: Volume Module: Base Vol: Growth Adj: Initial Bse: User Adj: PHF Adj: PHF Volume: Reduct Vol: FinalVolume: Critical Gap Module: Critical Gp:xxxxx xxxx xxxxx xxxxx xxxx xxxxx xxxxx xxxxx xxxx 6.9 FollowUpTim:xxxxx xxxx xxxxx xxxxx xxxx xxxxx xxxxx xxxxx xxxx 3.3 Capacity Module: Cnflict Vol: xxxx xxxx xxxxx xxxx xxxx xxxxx xxxx xxxx xxxx 800 Potent Cap.: xxxx xxxx xxxxx xxxx xxxx xxxxx xxxx xxxx xxxx 332 Move Cap.: xxxx xxxx xxxxx xxxx xxxx xxxxx xxxx xxxx xxxx 332 Volume/Cap: xxxx xxxx xxxx xxxx xxxx xxxx xxxx xxxx xxxx 0.14 Level Of Service Module: 2Way95thQ: xxxx xxxx xxxxx xxxx xxxx xxxxx xxxx xxxx xxxxx xxxx xxxx 0.5 Control Del:xxxxx xxxx xxxxx xxxxx xxxx xxxxx xxxxx xxxx xxxxx xxxxx xxxx 17.5 LOS by Move: * * * * * * * * * * * C Movement: LT - LTR - RT LT - LTR - RT LT - LTR - RT LT - LTR - RT Shared Cap.: xxxx xxxx xxxxx xxxx xxxx xxxxx xxxx xxxx 0 xxxx xxxx xxxxx SharedQueue:xxxxx xxxx xxxxx xxxxx xxxx xxxxx xxxxx xxxx xxxxx xxxxx xxxx xxxxx Shrd ConDel:xxxxx xxxx xxxxx xxxxx xxxx xxxxx xxxxx xxxx xxxxx xxxxx xxxx xxxxx Shared LOS: * * * * * * * * * * * * ApproachDel: xxxxxx xxxxxx xxxxxx 17.5 ApproachLOS: * * * C Note: Queue reported is the number of cars per lane. Traffix (c) 2008 Dowling Assoc. Licensed to OMNI-MEANS, ROSEVILLE,CA CUMPP PM Mon Nov 23, :22:55 Page Level Of Service Computation Report 2000 HCM Unsignalized Method (Base Volume Alternative) Intersection #3 Rocklin Road/ Rocklin Manor Dr Average Delay (sec/veh): 1.3 Worst Case Level Of Service: C[ 19.9] Page 4
87 CPP_PM.txt Street Name: Roklin Road Rocklin Manor Dr Approach: North Bound South Bound East Bound West Bound Movement: L - T - R L - T - R L - T - R L - T - R Control: Stop Sign Stop Sign Uncontrolled Uncontrolled Rights: Include Include Include Include Lanes: 0 0 1! Volume Module: Base Vol: Growth Adj: Initial Bse: User Adj: PHF Adj: PHF Volume: Reduct Vol: FinalVolume: Critical Gap Module: Critical Gp: xxxxx xxxx xxxxx xxxxx xxxx xxxxx 4.1 xxxx xxxxx FollowUpTim: xxxxx xxxx xxxxx xxxxx xxxx xxxxx 2.2 xxxx xxxxx Capacity Module: Cnflict Vol: xxxx xxxx xxxxx xxxx xxxx xxxxx 946 xxxx xxxxx Potent Cap.: xxxx xxxx xxxxx xxxx xxxx xxxxx 734 xxxx xxxxx Move Cap.: xxxx xxxx xxxxx xxxx xxxx xxxxx 734 xxxx xxxxx Total Cap: xxxxx xxxxx xxxx xxxx xxxxx xxxx xxxx xxxxx Volume/Cap: xxxx xxxx xxxx xxxx xxxx xxxx 0.03 xxxx xxxx Level Of Service Module: 2Way95thQ: xxxx xxxx xxxxx xxxx xxxx xxxxx xxxx xxxx xxxxx 0.1 xxxx xxxxx Control Del:xxxxx xxxx xxxxx xxxxx xxxx xxxxx xxxxx xxxx xxxxx 10.1 xxxx xxxxx LOS by Move: * * * * * * * * * B * * Movement: LT - LTR - RT LT - LTR - RT LT - LTR - RT LT - LTR - RT Shared Cap.: xxxx 325 xxxxx xxxx xxxx xxxxx xxxx xxxx xxxxx xxxx xxxx xxxxx SharedQueue:xxxxx 1.0 xxxxx xxxxx xxxx xxxxx xxxxx xxxx xxxxx xxxxx xxxx xxxxx Shrd ConDel:xxxxx 19.9 xxxxx xxxxx xxxx xxxxx xxxxx xxxx xxxxx xxxxx xxxx xxxxx Shared LOS: * C * * * * * * * * * * ApproachDel: 19.9 xxxxxx xxxxxx xxxxxx ApproachLOS: C * * * Note: Queue reported is the number of cars per lane. Traffix (c) 2008 Dowling Assoc. Licensed to OMNI-MEANS, ROSEVILLE,CA Page 5
88 CUMULATIVE PLUS PROJECT AM WITH WATERLILY ACCESS CPP_WO_AM.txt Level Of Service Computation Report Circular 212 Planning Method (Future Volume Alternative) Intersection #1 Rocklin Road/ Sierra College Cycle (sec): 100 Critical Vol./Cap.(X): Loss Time (sec): 16 Average Delay (sec/veh): xxxxxx Optimal Cycle: 180 Level Of Service: E Street Name: Rocklin Road Sierra College Approach: North Bound South Bound East Bound West Bound Movement: L - T - R L - T - R L - T - R L - T - R Control: Protected Protected Protected Protected Rights: Include Include Ovl Include Min. Green: Y+R: Lanes: Volume Module: Base Vol: Growth Adj: Initial Bse: Added Vol: PasserByVol: Initial Fut: User Adj: PHF Adj: PHF Volume: Reduct Vol: Reduced Vol: PCE Adj: MLF Adj: FinalVolume: Saturation Flow Module: Sat/Lane: Adjustment: Lanes: Final Sat.: Capacity Analysis Module: Vol/Sat: Crit Volume: Crit Moves: **** **** **** **** Traffix (c) 2008 Dowling Assoc. Licensed to OMNI-MEANS, ROSEVILLE,CA CNP AM Mon Nov 23, :53:04 Page Level Of Service Computation Report 2000 HCM Unsignalized Method (Future Volume Alternative) Page 3
89 CUMULATIVE PLUS PROJECT AM WITH WATERLILY ACCESS CPP_WO_AM.txt Intersection #2 Sierra College Blvd/Water Lily Lane Average Delay (sec/veh): 0.4 Worst Case Level Of Service: C[ 20.3] Street Name: Sierra College Blvd Water Lily Lane Approach: North Bound South Bound East Bound West Bound Movement: L - T - R L - T - R L - T - R L - T - R Control: Uncontrolled Uncontrolled Stop Sign Stop Sign Rights: Include Include Include Include Lanes: Volume Module: Base Vol: Growth Adj: Initial Bse: Added Vol: PasserByVol: Initial Fut: User Adj: PHF Adj: PHF Volume: Reduct Vol: FinalVolume: Critical Gap Module: Critical Gp:xxxxx xxxx xxxxx xxxxx xxxx xxxxx xxxxx xxxxx xxxx 6.9 FollowUpTim:xxxxx xxxx xxxxx xxxxx xxxx xxxxx xxxxx xxxxx xxxx 3.3 Capacity Module: Cnflict Vol: xxxx xxxx xxxxx xxxx xxxx xxxxx xxxx xxxx xxxx 803 Potent Cap.: xxxx xxxx xxxxx xxxx xxxx xxxxx xxxx xxxx xxxx 331 Move Cap.: xxxx xxxx xxxxx xxxx xxxx xxxxx xxxx xxxx xxxx 331 Volume/Cap: xxxx xxxx xxxx xxxx xxxx xxxx xxxx xxxx xxxx 0.29 Level Of Service Module: 2Way95thQ: xxxx xxxx xxxxx xxxx xxxx xxxxx xxxx xxxx xxxxx xxxx xxxx 1.2 Control Del:xxxxx xxxx xxxxx xxxxx xxxx xxxxx xxxxx xxxx xxxxx xxxxx xxxx 20.3 LOS by Move: * * * * * * * * * * * C Movement: LT - LTR - RT LT - LTR - RT LT - LTR - RT LT - LTR - RT Shared Cap.: xxxx xxxx xxxxx xxxx xxxx xxxxx xxxx xxxx 0 xxxx xxxx xxxxx SharedQueue:xxxxx xxxx xxxxx xxxxx xxxx xxxxx xxxxx xxxx xxxxx xxxxx xxxx xxxxx Shrd ConDel:xxxxx xxxx xxxxx xxxxx xxxx xxxxx xxxxx xxxx xxxxx xxxxx xxxx xxxxx Shared LOS: * * * * * * * * * * * * ApproachDel: xxxxxx xxxxxx xxxxxx 20.3 ApproachLOS: * * * C Note: Queue reported is the number of cars per lane. Traffix (c) 2008 Dowling Assoc. Licensed to OMNI-MEANS, ROSEVILLE,CA CNP AM Mon Nov 23, :53:04 Page Level Of Service Computation Report 2000 HCM Unsignalized Method (Future Volume Alternative) Intersection #3 Rocklin Road/ Rocklin Manor Dr Average Delay (sec/veh): 1.4 Worst Case Level Of Service: C[ 15.6] Page 4
90 CUMULATIVE PLUS PROJECT AM WITH WATERLILY ACCESS CPP_WO_AM.txt Street Name: Roklin Road Rocklin Manor Dr Approach: North Bound South Bound East Bound West Bound Movement: L - T - R L - T - R L - T - R L - T - R Control: Stop Sign Stop Sign Uncontrolled Uncontrolled Rights: Include Include Include Include Lanes: 0 0 1! Volume Module: Base Vol: Growth Adj: Initial Bse: Added Vol: PasserByVol: Initial Fut: User Adj: PHF Adj: PHF Volume: Reduct Vol: FinalVolume: Critical Gap Module: Critical Gp: xxxxx xxxx xxxxx xxxxx xxxx xxxxx 4.1 xxxx xxxxx FollowUpTim: xxxxx xxxx xxxxx xxxxx xxxx xxxxx 2.2 xxxx xxxxx Capacity Module: Cnflict Vol: xxxx xxxx xxxxx xxxx xxxx xxxxx 612 xxxx xxxxx Potent Cap.: xxxx xxxx xxxxx xxxx xxxx xxxxx 977 xxxx xxxxx Move Cap.: xxxx xxxx xxxxx xxxx xxxx xxxxx 977 xxxx xxxxx Total Cap: xxxxx xxxxx xxxx xxxx xxxxx xxxx xxxx xxxxx Volume/Cap: xxxx xxxx xxxx xxxx xxxx xxxx 0.01 xxxx xxxx Level Of Service Module: 2Way95thQ: xxxx xxxx xxxxx xxxx xxxx xxxxx xxxx xxxx xxxxx 0.0 xxxx xxxxx Control Del:xxxxx xxxx xxxxx xxxxx xxxx xxxxx xxxxx xxxx xxxxx 8.7 xxxx xxxxx LOS by Move: * * * * * * * * * A * * Movement: LT - LTR - RT LT - LTR - RT LT - LTR - RT LT - LTR - RT Shared Cap.: xxxx 441 xxxxx xxxx xxxx xxxxx xxxx xxxx xxxxx xxxx xxxx xxxxx SharedQueue:xxxxx 0.9 xxxxx xxxxx xxxx xxxxx xxxxx xxxx xxxxx xxxxx xxxx xxxxx Shrd ConDel:xxxxx 15.6 xxxxx xxxxx xxxx xxxxx xxxxx xxxx xxxxx xxxxx xxxx xxxxx Shared LOS: * C * * * * * * * * * * ApproachDel: 15.6 xxxxxx xxxxxx xxxxxx ApproachLOS: C * * * Note: Queue reported is the number of cars per lane. Traffix (c) 2008 Dowling Assoc. Licensed to OMNI-MEANS, ROSEVILLE,CA Page 5
91 CUMULATIVE PLUS PROJECT PM WITH WATERLILY ACCESS CPP_WO_PM.txt Level Of Service Computation Report Circular 212 Planning Method (Future Volume Alternative) Intersection #1 Rocklin Road/ Sierra College Cycle (sec): 100 Critical Vol./Cap.(X): Loss Time (sec): 16 Average Delay (sec/veh): xxxxxx Optimal Cycle: 180 Level Of Service: E Street Name: Rocklin Road Sierra College Approach: North Bound South Bound East Bound West Bound Movement: L - T - R L - T - R L - T - R L - T - R Control: Protected Protected Protected Protected Rights: Include Include Ovl Include Min. Green: Y+R: Lanes: Volume Module: Base Vol: Growth Adj: Initial Bse: Added Vol: PasserByVol: Initial Fut: User Adj: PHF Adj: PHF Volume: Reduct Vol: Reduced Vol: PCE Adj: MLF Adj: FinalVolume: Saturation Flow Module: Sat/Lane: Adjustment: Lanes: Final Sat.: Capacity Analysis Module: Vol/Sat: Crit Volume: Crit Moves: **** **** **** **** Traffix (c) 2008 Dowling Assoc. Licensed to OMNI-MEANS, ROSEVILLE,CA CNP PM Mon Nov 23, :54:07 Page Level Of Service Computation Report 2000 HCM Unsignalized Method (Future Volume Alternative) Page 3
92 CUMULATIVE PLUS PROJECT PM WITH WATERLILY ACCESS CPP_WO_PM.txt Intersection #2 Sierra College Blvd/Water Lily Lane Average Delay (sec/veh): 0.2 Worst Case Level Of Service: C[ 18.2] Street Name: Sierra College Blvd Water Lily Lane Approach: North Bound South Bound East Bound West Bound Movement: L - T - R L - T - R L - T - R L - T - R Control: Uncontrolled Uncontrolled Stop Sign Stop Sign Rights: Include Include Include Include Lanes: Volume Module: Base Vol: Growth Adj: Initial Bse: Added Vol: PasserByVol: Initial Fut: User Adj: PHF Adj: PHF Volume: Reduct Vol: FinalVolume: Critical Gap Module: Critical Gp:xxxxx xxxx xxxxx xxxxx xxxx xxxxx xxxxx xxxxx xxxx 6.9 FollowUpTim:xxxxx xxxx xxxxx xxxxx xxxx xxxxx xxxxx xxxxx xxxx 3.3 Capacity Module: Cnflict Vol: xxxx xxxx xxxxx xxxx xxxx xxxxx xxxx xxxx xxxx 800 Potent Cap.: xxxx xxxx xxxxx xxxx xxxx xxxxx xxxx xxxx xxxx 332 Move Cap.: xxxx xxxx xxxxx xxxx xxxx xxxxx xxxx xxxx xxxx 332 Volume/Cap: xxxx xxxx xxxx xxxx xxxx xxxx xxxx xxxx xxxx 0.18 Level Of Service Module: 2Way95thQ: xxxx xxxx xxxxx xxxx xxxx xxxxx xxxx xxxx xxxxx xxxx xxxx 0.6 Control Del:xxxxx xxxx xxxxx xxxxx xxxx xxxxx xxxxx xxxx xxxxx xxxxx xxxx 18.2 LOS by Move: * * * * * * * * * * * C Movement: LT - LTR - RT LT - LTR - RT LT - LTR - RT LT - LTR - RT Shared Cap.: xxxx xxxx xxxxx xxxx xxxx xxxxx xxxx xxxx 0 xxxx xxxx xxxxx SharedQueue:xxxxx xxxx xxxxx xxxxx xxxx xxxxx xxxxx xxxx xxxxx xxxxx xxxx xxxxx Shrd ConDel:xxxxx xxxx xxxxx xxxxx xxxx xxxxx xxxxx xxxx xxxxx xxxxx xxxx xxxxx Shared LOS: * * * * * * * * * * * * ApproachDel: xxxxxx xxxxxx xxxxxx 18.2 ApproachLOS: * * * C Note: Queue reported is the number of cars per lane. Traffix (c) 2008 Dowling Assoc. Licensed to OMNI-MEANS, ROSEVILLE,CA CNP PM Mon Nov 23, :54:07 Page Level Of Service Computation Report 2000 HCM Unsignalized Method (Future Volume Alternative) Intersection #3 Rocklin Road/ Rocklin Manor Dr Average Delay (sec/veh): 1.0 Worst Case Level Of Service: C[ 18.6] Page 4
93 CUMULATIVE PLUS PROJECT PM WITH WATERLILY ACCESS CPP_WO_PM.txt Street Name: Roklin Road Rocklin Manor Dr Approach: North Bound South Bound East Bound West Bound Movement: L - T - R L - T - R L - T - R L - T - R Control: Stop Sign Stop Sign Uncontrolled Uncontrolled Rights: Include Include Include Include Lanes: 0 0 1! Volume Module: Base Vol: Growth Adj: Initial Bse: Added Vol: PasserByVol: Initial Fut: User Adj: PHF Adj: PHF Volume: Reduct Vol: FinalVolume: Critical Gap Module: Critical Gp: xxxxx xxxx xxxxx xxxxx xxxx xxxxx 4.1 xxxx xxxxx FollowUpTim: xxxxx xxxx xxxxx xxxxx xxxx xxxxx 2.2 xxxx xxxxx Capacity Module: Cnflict Vol: xxxx xxxx xxxxx xxxx xxxx xxxxx 945 xxxx xxxxx Potent Cap.: xxxx xxxx xxxxx xxxx xxxx xxxxx 734 xxxx xxxxx Move Cap.: xxxx xxxx xxxxx xxxx xxxx xxxxx 734 xxxx xxxxx Total Cap: xxxxx xxxxx xxxx xxxx xxxxx xxxx xxxx xxxxx Volume/Cap: xxxx xxxx xxxx xxxx xxxx xxxx 0.03 xxxx xxxx Level Of Service Module: 2Way95thQ: xxxx xxxx xxxxx xxxx xxxx xxxxx xxxx xxxx xxxxx 0.1 xxxx xxxxx Control Del:xxxxx xxxx xxxxx xxxxx xxxx xxxxx xxxxx xxxx xxxxx 10.1 xxxx xxxxx LOS by Move: * * * * * * * * * B * * Movement: LT - LTR - RT LT - LTR - RT LT - LTR - RT LT - LTR - RT Shared Cap.: xxxx 333 xxxxx xxxx xxxx xxxxx xxxx xxxx xxxxx xxxx xxxx xxxxx SharedQueue:xxxxx 0.8 xxxxx xxxxx xxxx xxxxx xxxxx xxxx xxxxx xxxxx xxxx xxxxx Shrd ConDel:xxxxx 18.6 xxxxx xxxxx xxxx xxxxx xxxxx xxxx xxxxx xxxxx xxxx xxxxx Shared LOS: * C * * * * * * * * * * ApproachDel: 18.6 xxxxxx xxxxxx xxxxxx ApproachLOS: C * * * Note: Queue reported is the number of cars per lane. Traffix (c) 2008 Dowling Assoc. Licensed to OMNI-MEANS, ROSEVILLE,CA Page 5
94 Synchro LOS Worksheets Sierra Gateway Apartments TIAR Page 38 The Ezralow Company, LLC R1783TIA007.docx
95 SimTraffic Performance Report AM Existing Conditions - City Timings 10/17/2016 4: I-80 WB On Ramp/I-80 WB Off Ramp & Rocklin Rd Performance by approach Approach EB WB SB All Denied Delay (hr) Denied Del/Veh (s) Total Delay (hr) Total Del/Veh (s) Vehicles Entered Vehicles Exited Hourly Exit Rate Input Volume % of Volume : I-80 EB Off Ramp/I-80 EB On Ramp & Rocklin Rd Performance by approach Approach EB WB NB All Denied Delay (hr) Denied Del/Veh (s) Total Delay (hr) Total Del/Veh (s) Vehicles Entered Vehicles Exited Hourly Exit Rate Input Volume % of Volume Total Network Performance Denied Delay (hr) 3.8 Denied Del/Veh (s) 3.1 Total Delay (hr) 42.8 Total Del/Veh (s) 35.2 Vehicles Entered 4381 Vehicles Exited 4319 Hourly Exit Rate 3455 Input Volume 8999 % of Volume 38 Sierra Gateway Apartments SimTraffic Report Page 3
96 HCM Signalized Intersection Capacity Analysis Existing Conditions 6: Sierra College Blvd & I-80 EB Ramps/Crossing Dr AM Peak Hour Movement EBL2 EBT EBR WBL WBR WBR2 NBT NBR NBR2 SBL SBT SBR Lane Configurations Traffic Volume (vph) Future Volume (vph) Ideal Flow (vphpl) Total Lost time (s) Lane Util. Factor Frt Flt Protected Satd. Flow (prot) Flt Permitted Satd. Flow (perm) Peak-hour factor, PHF Adj. Flow (vph) RTOR Reduction (vph) Lane Group Flow (vph) Heavy Vehicles (%) 4% 4% 4% 4% 4% 4% 4% 4% 4% 4% 4% 4% Turn Type Prot NA Perm Prot pt+ov Free NA Perm Perm Prot NA Perm Protected Phases Permitted Phases 4 Free Actuated Green, G (s) Effective Green, g (s) Actuated g/c Ratio Clearance Time (s) Vehicle Extension (s) Lane Grp Cap (vph) v/s Ratio Prot c c c0.32 v/s Ratio Perm c v/c Ratio Uniform Delay, d Progression Factor Incremental Delay, d Delay (s) Level of Service C C C C C A B C B C B A Approach Delay (s) Approach LOS C C B Intersection Summary HCM 2000 Control Delay 18.8 HCM 2000 Level of Service B HCM 2000 Volume to Capacity ratio 0.60 Actuated Cycle Length (s) 73.8 Sum of lost time (s) 17.6 Intersection Capacity Utilization 53.3% ICU Level of Service A Analysis Period (min) 15 c Critical Lane Group Sierra Gateway Apartments Synchro 9 Report Page 3
97 HCM Signalized Intersection Capacity Analysis Existing Conditions 7: Sierra College Blvd & Commons Dr/I-80 WB Ramps AM Peak Hour Movement EBL EBR EBR2 WBL2 WBT WBR NBL NBT NBR SBT SBR SBR2 Lane Configurations Traffic Volume (vph) Future Volume (vph) Ideal Flow (vphpl) Total Lost time (s) Lane Util. Factor Frt Flt Protected Satd. Flow (prot) Flt Permitted Satd. Flow (perm) Peak-hour factor, PHF Adj. Flow (vph) RTOR Reduction (vph) Lane Group Flow (vph) Heavy Vehicles (%) 4% 4% 4% 4% 4% 4% 4% 4% 4% 4% 4% 4% Turn Type Prot pt+ov Prot NA Perm Prot NA Perm NA Perm Perm Protected Phases Permitted Phases Actuated Green, G (s) Effective Green, g (s) Actuated g/c Ratio Clearance Time (s) Vehicle Extension (s) Lane Grp Cap (vph) v/s Ratio Prot c0.21 c0.08 c c0.24 v/s Ratio Perm v/c Ratio Uniform Delay, d Progression Factor Incremental Delay, d Delay (s) Level of Service F C C B B D B B C C B Approach Delay (s) Approach LOS C B C Intersection Summary HCM 2000 Control Delay 22.7 HCM 2000 Level of Service C HCM 2000 Volume to Capacity ratio 0.67 Actuated Cycle Length (s) 80.8 Sum of lost time (s) 18.8 Intersection Capacity Utilization 53.3% ICU Level of Service A Analysis Period (min) 15 c Critical Lane Group Sierra Gateway Apartments Synchro 9 Report Page 4
98 SimTraffic Performance Report Existing Conditions 10/7/2016 4: I-80 WB On Ramp/I-80 WB Off Ramp & Rocklin Rd Performance by movement Movement EBT EBR WBL WBT SBL SBR All Denied Delay (hr) Denied Del/Veh (s) Total Delay (hr) Total Del/Veh (s) Vehicles Entered Vehicles Exited Hourly Exit Rate Input Volume % of Volume : I-80 EB Off Ramp/I-80 EB On Ramp & Rocklin Rd Performance by movement Movement EBL EBT WBT WBR NBL NBT NBR All Denied Delay (hr) Denied Del/Veh (s) Total Delay (hr) Total Del/Veh (s) Vehicles Entered Vehicles Exited Hourly Exit Rate Input Volume % of Volume Total Network Performance Denied Delay (hr) Denied Del/Veh (s) Total Delay (hr) 66.2 Total Del/Veh (s) 62.3 Vehicles Entered 3730 Vehicles Exited 3725 Hourly Exit Rate 3725 Input Volume % of Volume 36 Sierra Gateway Apartments SimTraffic Report Page 3
99 HCM Signalized Intersection Capacity Analysis Existing Conditions 6: Sierra College Blvd & I-80 EB Ramps/Crossing Dr PM Peak Hour Movement EBL2 EBT EBR WBL WBR WBR2 NBT NBR NBR2 SBL SBT SBR Lane Configurations Traffic Volume (vph) Future Volume (vph) Ideal Flow (vphpl) Total Lost time (s) Lane Util. Factor Frt Flt Protected Satd. Flow (prot) Flt Permitted Satd. Flow (perm) Peak-hour factor, PHF Adj. Flow (vph) RTOR Reduction (vph) Lane Group Flow (vph) Turn Type Prot NA Perm Prot pt+ov Free NA Perm Perm Prot NA Perm Protected Phases Permitted Phases 4 Free Actuated Green, G (s) Effective Green, g (s) Actuated g/c Ratio Clearance Time (s) Vehicle Extension (s) Lane Grp Cap (vph) v/s Ratio Prot c c c v/s Ratio Perm c v/c Ratio Uniform Delay, d Progression Factor Incremental Delay, d Delay (s) Level of Service D D C D C A C D C D B B Approach Delay (s) Approach LOS D C C Intersection Summary HCM 2000 Control Delay 29.2 HCM 2000 Level of Service C HCM 2000 Volume to Capacity ratio 0.77 Actuated Cycle Length (s) Sum of lost time (s) 17.6 Intersection Capacity Utilization 57.7% ICU Level of Service B Analysis Period (min) 15 c Critical Lane Group Sierra Gateway Apartments Synchro 9 Report Page 3
100 HCM Signalized Intersection Capacity Analysis Existing Conditions 7: Sierra College Blvd & Commons Dr/I-80 WB Ramps PM Peak Hour Movement EBL EBR EBR2 WBL2 WBL WBT WBR NBL NBT NBR SBT SBR Lane Configurations Traffic Volume (vph) Future Volume (vph) Ideal Flow (vphpl) Total Lost time (s) Lane Util. Factor Frt Flt Protected Satd. Flow (prot) Flt Permitted Satd. Flow (perm) Peak-hour factor, PHF Adj. Flow (vph) RTOR Reduction (vph) Lane Group Flow (vph) Heavy Vehicles (%) 4% 4% 4% 4% 4% 4% 4% 4% 4% 4% 4% 4% Turn Type Prot pt+ov Prot Perm NA Perm Prot NA Perm NA Perm Protected Phases Permitted Phases Actuated Green, G (s) Effective Green, g (s) Actuated g/c Ratio Clearance Time (s) Vehicle Extension (s) Lane Grp Cap (vph) v/s Ratio Prot c c c0.23 v/s Ratio Perm c v/c Ratio Uniform Delay, d Progression Factor Incremental Delay, d Delay (s) Level of Service D C D C C C D B B C C Approach Delay (s) Approach LOS C B C Intersection Summary HCM 2000 Control Delay 27.3 HCM 2000 Level of Service C HCM 2000 Volume to Capacity ratio 0.74 Actuated Cycle Length (s) 95.2 Sum of lost time (s) 18.8 Intersection Capacity Utilization 63.3% ICU Level of Service B Analysis Period (min) 15 c Critical Lane Group Sierra Gateway Apartments Synchro 9 Report Page 4
101 HCM Signalized Intersection Capacity Analysis Existing Conditions 7: Sierra College Blvd & Commons Dr/I-80 WB Ramps PM Peak Hour Movement SBR2 Lane Configurations Traffic Volume (vph) 56 Future Volume (vph) 56 Ideal Flow (vphpl) 1900 Total Lost time (s) 5.7 Lane Util. Factor 1.00 Frt 0.85 Flt Protected 1.00 Satd. Flow (prot) 1553 Flt Permitted 1.00 Satd. Flow (perm) 1553 Peak-hour factor, PHF 0.94 Adj. Flow (vph) 60 RTOR Reduction (vph) 43 Lane Group Flow (vph) 17 Heavy Vehicles (%) 4% Turn Type Perm Protected Phases Permitted Phases 6 Actuated Green, G (s) 27.7 Effective Green, g (s) 27.7 Actuated g/c Ratio 0.29 Clearance Time (s) 5.7 Vehicle Extension (s) 1.0 Lane Grp Cap (vph) 451 v/s Ratio Prot v/s Ratio Perm 0.01 v/c Ratio 0.04 Uniform Delay, d Progression Factor 1.00 Incremental Delay, d2 0.0 Delay (s) 24.2 Level of Service C Approach Delay (s) Approach LOS Intersection Summary Sierra Gateway Apartments Synchro 9 Report Page 5
102 SimTraffic Performance Report AM Existing Plus Project 10/17/2016 4: I-80 WB On Ramp/I-80 WB Off Ramp & Rocklin Rd Performance by approach Approach EB WB SB All Denied Delay (hr) Denied Del/Veh (s) Total Delay (hr) Total Del/Veh (s) Vehicles Entered Vehicles Exited Hourly Exit Rate Input Volume % of Volume : I-80 EB Off Ramp/I-80 EB On Ramp & Rocklin Rd Performance by approach Approach EB WB NB All Denied Delay (hr) Denied Del/Veh (s) Total Delay (hr) Total Del/Veh (s) Vehicles Entered Vehicles Exited Hourly Exit Rate Input Volume % of Volume Total Network Performance Denied Delay (hr) 2.8 Denied Del/Veh (s) 2.3 Total Delay (hr) 44.5 Total Del/Veh (s) 36.2 Vehicles Entered 4415 Vehicles Exited 4347 Hourly Exit Rate 3478 Input Volume 9101 % of Volume 38 Sierra Gateway Apartments SimTraffic Report Page 3
103 HCM Signalized Intersection Capacity Analysis Existing Plus Project Conditions 6: Sierra College Blvd & I-80 EB Ramps/Crossing Dr AM Peak Hour Movement EBL2 EBT EBR WBL WBR WBR2 NBT NBR NBR2 SBL SBT SBR Lane Configurations Traffic Volume (vph) Future Volume (vph) Ideal Flow (vphpl) Total Lost time (s) Lane Util. Factor Frt Flt Protected Satd. Flow (prot) Flt Permitted Satd. Flow (perm) Peak-hour factor, PHF Adj. Flow (vph) RTOR Reduction (vph) Lane Group Flow (vph) Heavy Vehicles (%) 4% 4% 4% 4% 4% 4% 4% 4% 4% 4% 4% 4% Turn Type Prot NA Perm Prot pt+ov Free NA Perm Perm Prot NA Perm Protected Phases Permitted Phases 4 Free Actuated Green, G (s) Effective Green, g (s) Actuated g/c Ratio Clearance Time (s) Vehicle Extension (s) Lane Grp Cap (vph) v/s Ratio Prot c c c0.32 v/s Ratio Perm c v/c Ratio Uniform Delay, d Progression Factor Incremental Delay, d Delay (s) Level of Service D C C D C A B C B D B A Approach Delay (s) Approach LOS D B B Intersection Summary HCM 2000 Control Delay 20.1 HCM 2000 Level of Service C HCM 2000 Volume to Capacity ratio 0.60 Actuated Cycle Length (s) 92.8 Sum of lost time (s) 17.6 Intersection Capacity Utilization 53.5% ICU Level of Service A Analysis Period (min) 15 c Critical Lane Group Sierra Gateway Apartments Synchro 9 Report Page 3
104 HCM Signalized Intersection Capacity Analysis Existing Plus Project Conditions 7: Sierra College Blvd & Commons Dr/I-80 WB Ramps AM Peak Hour Movement EBL EBR EBR2 WBL2 WBT WBR NBL NBT NBR SBT SBR SBR2 Lane Configurations Traffic Volume (vph) Future Volume (vph) Ideal Flow (vphpl) Total Lost time (s) Lane Util. Factor Frt Flt Protected Satd. Flow (prot) Flt Permitted Satd. Flow (perm) Peak-hour factor, PHF Adj. Flow (vph) RTOR Reduction (vph) Lane Group Flow (vph) Heavy Vehicles (%) 4% 4% 4% 4% 4% 4% 4% 4% 4% 4% 4% 4% Turn Type Prot pt+ov Prot NA Perm Prot NA Perm NA Perm Perm Protected Phases Permitted Phases Actuated Green, G (s) Effective Green, g (s) Actuated g/c Ratio Clearance Time (s) Vehicle Extension (s) Lane Grp Cap (vph) v/s Ratio Prot c0.21 c0.08 c c0.24 v/s Ratio Perm v/c Ratio Uniform Delay, d Progression Factor Incremental Delay, d Delay (s) Level of Service F C C B B D B B C C B Approach Delay (s) Approach LOS C B C Intersection Summary HCM 2000 Control Delay 22.7 HCM 2000 Level of Service C HCM 2000 Volume to Capacity ratio 0.67 Actuated Cycle Length (s) 81.3 Sum of lost time (s) 18.8 Intersection Capacity Utilization 53.5% ICU Level of Service A Analysis Period (min) 15 c Critical Lane Group Sierra Gateway Apartments Synchro 9 Report Page 4
105 SimTraffic Performance Report PM Existing Plus Project 10/17/2016 4: I-80 WB On Ramp/I-80 WB Off Ramp & Rocklin Rd Performance by movement Movement EBT EBR WBL WBT SBL SBR All Denied Delay (hr) Denied Del/Veh (s) Total Delay (hr) Total Del/Veh (s) Vehicles Entered Vehicles Exited Hourly Exit Rate Input Volume % of Volume : I-80 EB Off Ramp/I-80 EB On Ramp & Rocklin Rd Performance by movement Movement EBL EBT WBT WBR NBL NBT NBR All Denied Delay (hr) Denied Del/Veh (s) Total Delay (hr) Total Del/Veh (s) Vehicles Entered Vehicles Exited Hourly Exit Rate Input Volume % of Volume Total Network Performance Denied Delay (hr) Denied Del/Veh (s) Total Delay (hr) 68.2 Total Del/Veh (s) 64.6 Vehicles Entered 3712 Vehicles Exited 3695 Hourly Exit Rate 3695 Input Volume % of Volume 36 Sierra Gateway Apartments SimTraffic Report Page 3
106 HCM Signalized Intersection Capacity Analysis Existing Plus Project Conditions 6: Sierra College Blvd & I-80 EB Ramps/Crossing Dr PM Peak Hour Movement EBL2 EBT EBR WBL WBR WBR2 NBT NBR NBR2 SBL SBT SBR Lane Configurations Traffic Volume (vph) Future Volume (vph) Ideal Flow (vphpl) Total Lost time (s) Lane Util. Factor Frt Flt Protected Satd. Flow (prot) Flt Permitted Satd. Flow (perm) Peak-hour factor, PHF Adj. Flow (vph) RTOR Reduction (vph) Lane Group Flow (vph) Turn Type Prot NA Perm Prot pt+ov Free NA Perm Perm Prot NA Perm Protected Phases Permitted Phases 4 Free Actuated Green, G (s) Effective Green, g (s) Actuated g/c Ratio Clearance Time (s) Vehicle Extension (s) Lane Grp Cap (vph) v/s Ratio Prot c c c v/s Ratio Perm c v/c Ratio Uniform Delay, d Progression Factor Incremental Delay, d Delay (s) Level of Service D C C E C A C D C E B B Approach Delay (s) Approach LOS D D C Intersection Summary HCM 2000 Control Delay 31.5 HCM 2000 Level of Service C HCM 2000 Volume to Capacity ratio 0.78 Actuated Cycle Length (s) Sum of lost time (s) 17.6 Intersection Capacity Utilization 58.1% ICU Level of Service B Analysis Period (min) 15 c Critical Lane Group Sierra Gateway Apartments Synchro 9 Report Page 3
107 HCM Signalized Intersection Capacity Analysis Existing Plus Project Conditions 7: Sierra College Blvd & Commons Dr/I-80 WB Ramps PM Peak Hour Movement EBL EBR EBR2 WBL2 WBL WBT WBR NBL NBT NBR SBT SBR Lane Configurations Traffic Volume (vph) Future Volume (vph) Ideal Flow (vphpl) Total Lost time (s) Lane Util. Factor Frt Flt Protected Satd. Flow (prot) Flt Permitted Satd. Flow (perm) Peak-hour factor, PHF Adj. Flow (vph) RTOR Reduction (vph) Lane Group Flow (vph) Heavy Vehicles (%) 4% 4% 4% 4% 4% 4% 4% 4% 4% 4% 4% 4% Turn Type Prot pt+ov Prot Prot NA Perm Prot NA Perm NA Perm Protected Phases Permitted Phases Actuated Green, G (s) Effective Green, g (s) Actuated g/c Ratio Clearance Time (s) Vehicle Extension (s) Lane Grp Cap (vph) v/s Ratio Prot c0.14 c0.10 c c0.23 v/s Ratio Perm v/c Ratio Uniform Delay, d Progression Factor Incremental Delay, d Delay (s) Level of Service D C D D C C D B B D C Approach Delay (s) Approach LOS D B C Intersection Summary HCM 2000 Control Delay 28.7 HCM 2000 Level of Service C HCM 2000 Volume to Capacity ratio 0.71 Actuated Cycle Length (s) 97.2 Sum of lost time (s) 18.8 Intersection Capacity Utilization 63.6% ICU Level of Service B Analysis Period (min) 15 c Critical Lane Group Sierra Gateway Apartments Synchro 9 Report Page 4
108 HCM Signalized Intersection Capacity Analysis Existing Plus Project Conditions 7: Sierra College Blvd & Commons Dr/I-80 WB Ramps PM Peak Hour Movement SBR2 Lane Configurations Traffic Volume (vph) 56 Future Volume (vph) 56 Ideal Flow (vphpl) 1900 Total Lost time (s) 5.7 Lane Util. Factor 1.00 Frt 0.85 Flt Protected 1.00 Satd. Flow (prot) 1553 Flt Permitted 1.00 Satd. Flow (perm) 1553 Peak-hour factor, PHF 0.94 Adj. Flow (vph) 60 RTOR Reduction (vph) 42 Lane Group Flow (vph) 18 Heavy Vehicles (%) 4% Turn Type Perm Protected Phases Permitted Phases 6 Actuated Green, G (s) 28.6 Effective Green, g (s) 28.6 Actuated g/c Ratio 0.29 Clearance Time (s) 5.7 Vehicle Extension (s) 1.0 Lane Grp Cap (vph) 456 v/s Ratio Prot v/s Ratio Perm 0.01 v/c Ratio 0.04 Uniform Delay, d Progression Factor 1.00 Incremental Delay, d2 0.0 Delay (s) 24.5 Level of Service C Approach Delay (s) Approach LOS Intersection Summary Sierra Gateway Apartments Synchro 9 Report Page 5
109 SimTraffic Performance Report AM Short Term No Project 10/17/2016 4: I-80 WB On Ramp/I-80 WB Off Ramp & Rocklin Rd Performance by approach Approach EB WB SB All Denied Delay (hr) Denied Del/Veh (s) Total Delay (hr) Total Del/Veh (s) Vehicles Entered Vehicles Exited Hourly Exit Rate Input Volume % of Volume : I-80 EB Off Ramp/I-80 EB On Ramp & Rocklin Rd Performance by approach Approach EB WB NB All Denied Delay (hr) Denied Del/Veh (s) Total Delay (hr) Total Del/Veh (s) Vehicles Entered Vehicles Exited Hourly Exit Rate Input Volume % of Volume Total Network Performance Denied Delay (hr) 4.4 Denied Del/Veh (s) 3.4 Total Delay (hr) 46.9 Total Del/Veh (s) 36.7 Vehicles Entered 4599 Vehicles Exited 4527 Hourly Exit Rate 3622 Input Volume 9490 % of Volume 38 Sierra Gateway Apartments SimTraffic Report Page 3
110 HCM Signalized Intersection Capacity Analysis Short Term Conditions 6: Sierra College Blvd & I-80 EB Ramps/Crossing Dr AM Peak Hour Movement EBL2 EBT EBR WBL WBR WBR2 NBT NBR NBR2 SBL SBT SBR Lane Configurations Traffic Volume (vph) Future Volume (vph) Ideal Flow (vphpl) Total Lost time (s) Lane Util. Factor Frt Flt Protected Satd. Flow (prot) Flt Permitted Satd. Flow (perm) Peak-hour factor, PHF Adj. Flow (vph) RTOR Reduction (vph) Lane Group Flow (vph) Heavy Vehicles (%) 4% 4% 4% 4% 4% 4% 4% 4% 4% 4% 4% 4% Turn Type Prot NA Perm Prot pt+ov Free NA Perm Perm Prot NA Perm Protected Phases Permitted Phases 4 Free Actuated Green, G (s) Effective Green, g (s) Actuated g/c Ratio Clearance Time (s) Vehicle Extension (s) Lane Grp Cap (vph) v/s Ratio Prot c c c0.32 v/s Ratio Perm c v/c Ratio Uniform Delay, d Progression Factor Incremental Delay, d Delay (s) Level of Service D C C D C A B C B D B A Approach Delay (s) Approach LOS C C B Intersection Summary HCM 2000 Control Delay 21.5 HCM 2000 Level of Service C HCM 2000 Volume to Capacity ratio 0.62 Actuated Cycle Length (s) 88.3 Sum of lost time (s) 17.6 Intersection Capacity Utilization 56.3% ICU Level of Service B Analysis Period (min) 15 c Critical Lane Group Sierra Gateway Apartments Synchro 9 Report Page 3
111 HCM Signalized Intersection Capacity Analysis Short Term Conditions 7: Sierra College Blvd & Commons Dr/I-80 WB Ramps AM Peak Hour Movement EBL EBR EBR2 WBL2 WBT WBR NBL NBT NBR SBT SBR SBR2 Lane Configurations Traffic Volume (vph) Future Volume (vph) Ideal Flow (vphpl) Total Lost time (s) Lane Util. Factor Frpb, ped/bikes Flpb, ped/bikes Frt Flt Protected Satd. Flow (prot) Flt Permitted Satd. Flow (perm) Peak-hour factor, PHF Adj. Flow (vph) RTOR Reduction (vph) Lane Group Flow (vph) Confl. Peds. (#/hr) 62 Heavy Vehicles (%) 4% 4% 4% 4% 4% 4% 4% 4% 4% 4% 4% 4% Turn Type Prot pt+ov Prot NA Perm Prot NA Perm NA Perm Perm Protected Phases Permitted Phases Actuated Green, G (s) Effective Green, g (s) Actuated g/c Ratio Clearance Time (s) Vehicle Extension (s) Lane Grp Cap (vph) v/s Ratio Prot c0.21 c0.09 c c0.25 v/s Ratio Perm v/c Ratio Uniform Delay, d Progression Factor Incremental Delay, d Delay (s) Level of Service D C C C C D B B C C B Approach Delay (s) Approach LOS C B C Intersection Summary HCM 2000 Control Delay 25.1 HCM 2000 Level of Service C HCM 2000 Volume to Capacity ratio 0.69 Actuated Cycle Length (s) 87.5 Sum of lost time (s) 18.8 Intersection Capacity Utilization 55.5% ICU Level of Service B Analysis Period (min) 15 c Critical Lane Group Sierra Gateway Apartments Synchro 9 Report Page 4
112 SimTraffic Performance Report PM Short Term No Project 10/17/2016 4: I-80 WB On Ramp/I-80 WB Off Ramp & Rocklin Rd Performance by movement Movement EBT EBR WBL WBT SBL SBR All Denied Delay (hr) Denied Del/Veh (s) Total Delay (hr) Total Del/Veh (s) Vehicles Entered Vehicles Exited Hourly Exit Rate Input Volume % of Volume : I-80 EB Off Ramp/I-80 EB On Ramp & Rocklin Rd Performance by movement Movement EBL EBT WBT WBR NBL NBT NBR All Denied Delay (hr) Denied Del/Veh (s) Total Delay (hr) Total Del/Veh (s) Vehicles Entered Vehicles Exited Hourly Exit Rate Input Volume % of Volume Total Network Performance Denied Delay (hr) Denied Del/Veh (s) Total Delay (hr) 94.3 Total Del/Veh (s) 85.2 Vehicles Entered 3852 Vehicles Exited 3858 Hourly Exit Rate 3858 Input Volume % of Volume 35 Sierra Gateway Apartments SimTraffic Report Page 3
113 HCM Signalized Intersection Capacity Analysis Short Term Conditions 6: Sierra College Blvd & I-80 EB Ramps/Crossing Dr PM Peak Hour Movement EBL2 EBT EBR WBL WBR WBR2 NBT NBR NBR2 SBL SBT SBR Lane Configurations Traffic Volume (vph) Future Volume (vph) Ideal Flow (vphpl) Total Lost time (s) Lane Util. Factor Frt Flt Protected Satd. Flow (prot) Flt Permitted Satd. Flow (perm) Peak-hour factor, PHF Adj. Flow (vph) RTOR Reduction (vph) Lane Group Flow (vph) Turn Type Prot NA Perm Prot pt+ov Free NA Perm Perm Prot NA Perm Protected Phases Permitted Phases 4 Free Actuated Green, G (s) Effective Green, g (s) Actuated g/c Ratio Clearance Time (s) Vehicle Extension (s) Lane Grp Cap (vph) v/s Ratio Prot c0.12 c v/s Ratio Perm 0.01 c0.20 c v/c Ratio Uniform Delay, d Progression Factor Incremental Delay, d Delay (s) Level of Service D D D E D A C E C E B B Approach Delay (s) Approach LOS D D C Intersection Summary HCM 2000 Control Delay 34.2 HCM 2000 Level of Service C HCM 2000 Volume to Capacity ratio 0.86 Actuated Cycle Length (s) Sum of lost time (s) 17.6 Intersection Capacity Utilization 65.2% ICU Level of Service C Analysis Period (min) 15 c Critical Lane Group Sierra Gateway Apartments Synchro 9 Report Page 3
114 HCM Signalized Intersection Capacity Analysis Short Term Conditions 7: Sierra College Blvd & Commons Dr/I-80 WB Ramps PM Peak Hour Movement EBL EBR EBR2 WBL2 WBL WBT WBR NBL NBT NBR SBT SBR Lane Configurations Traffic Volume (vph) Future Volume (vph) Ideal Flow (vphpl) Total Lost time (s) Lane Util. Factor Frt Flt Protected Satd. Flow (prot) Flt Permitted Satd. Flow (perm) Peak-hour factor, PHF Adj. Flow (vph) RTOR Reduction (vph) Lane Group Flow (vph) Heavy Vehicles (%) 4% 4% 4% 4% 4% 4% 4% 4% 4% 4% 4% 4% Turn Type Prot pt+ov Prot Perm NA Perm Prot NA Perm NA Perm Protected Phases Permitted Phases Actuated Green, G (s) Effective Green, g (s) Actuated g/c Ratio Clearance Time (s) Vehicle Extension (s) Lane Grp Cap (vph) v/s Ratio Prot c c c0.23 v/s Ratio Perm c v/c Ratio Uniform Delay, d Progression Factor Incremental Delay, d Delay (s) Level of Service E C D C C C D B B D D Approach Delay (s) Approach LOS D C D Intersection Summary HCM 2000 Control Delay 31.4 HCM 2000 Level of Service C HCM 2000 Volume to Capacity ratio 0.76 Actuated Cycle Length (s) Sum of lost time (s) 18.8 Intersection Capacity Utilization 67.3% ICU Level of Service C Analysis Period (min) 15 c Critical Lane Group Sierra Gateway Apartments Synchro 9 Report Page 4
115 HCM Signalized Intersection Capacity Analysis Short Term Conditions 7: Sierra College Blvd & Commons Dr/I-80 WB Ramps PM Peak Hour Movement SBR2 Lane Configurations Traffic Volume (vph) 125 Future Volume (vph) 125 Ideal Flow (vphpl) 1900 Total Lost time (s) 5.7 Lane Util. Factor 1.00 Frt 0.85 Flt Protected 1.00 Satd. Flow (prot) 1553 Flt Permitted 1.00 Satd. Flow (perm) 1553 Peak-hour factor, PHF 0.94 Adj. Flow (vph) 133 RTOR Reduction (vph) 82 Lane Group Flow (vph) 51 Heavy Vehicles (%) 4% Turn Type Perm Protected Phases Permitted Phases 6 Actuated Green, G (s) 30.0 Effective Green, g (s) 30.0 Actuated g/c Ratio 0.28 Clearance Time (s) 5.7 Vehicle Extension (s) 1.0 Lane Grp Cap (vph) 436 v/s Ratio Prot v/s Ratio Perm 0.03 v/c Ratio 0.12 Uniform Delay, d Progression Factor 1.00 Incremental Delay, d2 0.0 Delay (s) 28.5 Level of Service C Approach Delay (s) Approach LOS Intersection Summary Sierra Gateway Apartments Synchro 9 Report Page 5
116 SimTraffic Performance Report AM Short Term Plus Project 10/17/2016 4: I-80 WB On Ramp/I-80 WB Off Ramp & Rocklin Rd Performance by approach Approach EB WB SB All Denied Delay (hr) Denied Del/Veh (s) Total Delay (hr) Total Del/Veh (s) Vehicles Entered Vehicles Exited Hourly Exit Rate Input Volume % of Volume : I-80 EB Off Ramp/I-80 EB On Ramp & Rocklin Rd Performance by approach Approach EB WB NB All Denied Delay (hr) Denied Del/Veh (s) Total Delay (hr) Total Del/Veh (s) Vehicles Entered Vehicles Exited Hourly Exit Rate Input Volume % of Volume Total Network Performance Denied Delay (hr) 6.5 Denied Del/Veh (s) 5.0 Total Delay (hr) 49.7 Total Del/Veh (s) 38.3 Vehicles Entered 4671 Vehicles Exited 4596 Hourly Exit Rate 3677 Input Volume 9594 % of Volume 38 Sierra Gateway Apartments SimTraffic Report Page 3
117 HCM Signalized Intersection Capacity Analysis Short Term+Project Conditions 6: Sierra College Blvd & I-80 EB Ramps/Crossing Dr AM Peak Hour Movement EBL2 EBT EBR WBL WBR WBR2 NBT NBR NBR2 SBL SBT SBR Lane Configurations Traffic Volume (vph) Future Volume (vph) Ideal Flow (vphpl) Total Lost time (s) Lane Util. Factor Frt Flt Protected Satd. Flow (prot) Flt Permitted Satd. Flow (perm) Peak-hour factor, PHF Adj. Flow (vph) RTOR Reduction (vph) Lane Group Flow (vph) Heavy Vehicles (%) 4% 4% 4% 4% 4% 4% 4% 4% 4% 4% 4% 4% Turn Type Prot NA Perm Prot pt+ov Free NA Perm Perm Prot NA Perm Protected Phases Permitted Phases 4 Free Actuated Green, G (s) Effective Green, g (s) Actuated g/c Ratio Clearance Time (s) Vehicle Extension (s) Lane Grp Cap (vph) v/s Ratio Prot c c c v/s Ratio Perm c v/c Ratio Uniform Delay, d Progression Factor Incremental Delay, d Delay (s) Level of Service D D C D C A B C B D B A Approach Delay (s) Approach LOS D C B Intersection Summary HCM 2000 Control Delay 23.3 HCM 2000 Level of Service C HCM 2000 Volume to Capacity ratio 0.66 Actuated Cycle Length (s) Sum of lost time (s) 17.6 Intersection Capacity Utilization 56.5% ICU Level of Service B Analysis Period (min) 15 c Critical Lane Group Sierra Gateway Apartments Synchro 9 Report Page 3
118 HCM Signalized Intersection Capacity Analysis Short Term+Project Conditions 7: Sierra College Blvd & Commons Dr/I-80 WB Ramps AM Peak Hour Movement EBL EBR EBR2 WBL2 WBT WBR NBL NBT NBR SBT SBR SBR2 Lane Configurations Traffic Volume (vph) Future Volume (vph) Ideal Flow (vphpl) Total Lost time (s) Lane Util. Factor Frpb, ped/bikes Flpb, ped/bikes Frt Flt Protected Satd. Flow (prot) Flt Permitted Satd. Flow (perm) Peak-hour factor, PHF Adj. Flow (vph) RTOR Reduction (vph) Lane Group Flow (vph) Confl. Peds. (#/hr) 62 Heavy Vehicles (%) 4% 4% 4% 4% 4% 4% 4% 4% 4% 4% 4% 4% Turn Type Prot pt+ov Prot NA Perm Prot NA Perm NA Perm Perm Protected Phases Permitted Phases Actuated Green, G (s) Effective Green, g (s) Actuated g/c Ratio Clearance Time (s) Vehicle Extension (s) Lane Grp Cap (vph) v/s Ratio Prot c0.21 c0.09 c c0.25 v/s Ratio Perm v/c Ratio Uniform Delay, d Progression Factor Incremental Delay, d Delay (s) Level of Service D C D C C D B B C C B Approach Delay (s) Approach LOS C B C Intersection Summary HCM 2000 Control Delay 25.1 HCM 2000 Level of Service C HCM 2000 Volume to Capacity ratio 0.69 Actuated Cycle Length (s) 88.0 Sum of lost time (s) 18.8 Intersection Capacity Utilization 55.7% ICU Level of Service B Analysis Period (min) 15 c Critical Lane Group Sierra Gateway Apartments Synchro 9 Report Page 4
119 SimTraffic Performance Report PM Short Term Plus Project 10/17/2016 4: I-80 WB On Ramp/I-80 WB Off Ramp & Rocklin Rd Performance by movement Movement EBT EBR WBL WBT SBL SBR All Denied Delay (hr) Denied Del/Veh (s) Total Delay (hr) Total Del/Veh (s) Vehicles Entered Vehicles Exited Hourly Exit Rate Input Volume % of Volume : I-80 EB Off Ramp/I-80 EB On Ramp & Rocklin Rd Performance by movement Movement EBL EBT WBT WBR NBL NBT NBR All Denied Delay (hr) Denied Del/Veh (s) Total Delay (hr) Total Del/Veh (s) Vehicles Entered Vehicles Exited Hourly Exit Rate Input Volume % of Volume Total Network Performance Denied Delay (hr) Denied Del/Veh (s) Total Delay (hr) 98.1 Total Del/Veh (s) 86.9 Vehicles Entered 3933 Vehicles Exited 3928 Hourly Exit Rate 3928 Input Volume % of Volume 35 Sierra Gateway Apartments SimTraffic Report Page 3
120 HCM Signalized Intersection Capacity Analysis Short Term+Project Conditions 6: Sierra College Blvd & I-80 EB Ramps/Crossing Dr PM Peak Hour Movement EBL2 EBT EBR WBL WBR WBR2 NBT NBR NBR2 SBL SBT SBR Lane Configurations Traffic Volume (vph) Future Volume (vph) Ideal Flow (vphpl) Total Lost time (s) Lane Util. Factor Frt Flt Protected Satd. Flow (prot) Flt Permitted Satd. Flow (perm) Peak-hour factor, PHF Adj. Flow (vph) RTOR Reduction (vph) Lane Group Flow (vph) Turn Type Prot NA Perm Prot pt+ov Free NA Perm Perm Prot NA Perm Protected Phases Permitted Phases 4 Free Actuated Green, G (s) Effective Green, g (s) Actuated g/c Ratio Clearance Time (s) Vehicle Extension (s) Lane Grp Cap (vph) v/s Ratio Prot c0.12 c v/s Ratio Perm 0.01 c0.20 c v/c Ratio Uniform Delay, d Progression Factor Incremental Delay, d Delay (s) Level of Service D D D E D A C E C E B B Approach Delay (s) Approach LOS D D C Intersection Summary HCM 2000 Control Delay 34.5 HCM 2000 Level of Service C HCM 2000 Volume to Capacity ratio 0.87 Actuated Cycle Length (s) Sum of lost time (s) 17.6 Intersection Capacity Utilization 65.5% ICU Level of Service C Analysis Period (min) 15 c Critical Lane Group Sierra Gateway Apartments Synchro 9 Report Page 3
121 HCM Signalized Intersection Capacity Analysis Short Term+Project Conditions 7: Sierra College Blvd & Commons Dr/I-80 WB Ramps PM Peak Hour Movement EBL EBR EBR2 WBL2 WBL WBT WBR NBL NBT NBR SBT SBR Lane Configurations Traffic Volume (vph) Future Volume (vph) Ideal Flow (vphpl) Total Lost time (s) Lane Util. Factor Frt Flt Protected Satd. Flow (prot) Flt Permitted Satd. Flow (perm) Peak-hour factor, PHF Adj. Flow (vph) RTOR Reduction (vph) Lane Group Flow (vph) Heavy Vehicles (%) 4% 4% 4% 4% 4% 4% 4% 4% 4% 4% 4% 4% Turn Type Prot pt+ov Prot Perm NA Perm Prot NA Perm NA Perm Protected Phases Permitted Phases Actuated Green, G (s) Effective Green, g (s) Actuated g/c Ratio Clearance Time (s) Vehicle Extension (s) Lane Grp Cap (vph) v/s Ratio Prot c c c0.24 v/s Ratio Perm c v/c Ratio Uniform Delay, d Progression Factor Incremental Delay, d Delay (s) Level of Service E C D C C C D B B D D Approach Delay (s) Approach LOS D C D Intersection Summary HCM 2000 Control Delay 31.9 HCM 2000 Level of Service C HCM 2000 Volume to Capacity ratio 0.77 Actuated Cycle Length (s) Sum of lost time (s) 18.8 Intersection Capacity Utilization 67.6% ICU Level of Service C Analysis Period (min) 15 c Critical Lane Group Sierra Gateway Apartments Synchro 9 Report Page 4
122 HCM Signalized Intersection Capacity Analysis Short Term+Project Conditions 7: Sierra College Blvd & Commons Dr/I-80 WB Ramps PM Peak Hour Movement SBR2 Lane Configurations Traffic Volume (vph) 125 Future Volume (vph) 125 Ideal Flow (vphpl) 1900 Total Lost time (s) 5.7 Lane Util. Factor 1.00 Frt 0.85 Flt Protected 1.00 Satd. Flow (prot) 1553 Flt Permitted 1.00 Satd. Flow (perm) 1553 Peak-hour factor, PHF 0.94 Adj. Flow (vph) 133 RTOR Reduction (vph) 82 Lane Group Flow (vph) 51 Heavy Vehicles (%) 4% Turn Type Perm Protected Phases Permitted Phases 6 Actuated Green, G (s) 30.7 Effective Green, g (s) 30.7 Actuated g/c Ratio 0.28 Clearance Time (s) 5.7 Vehicle Extension (s) 1.0 Lane Grp Cap (vph) 440 v/s Ratio Prot v/s Ratio Perm 0.03 v/c Ratio 0.12 Uniform Delay, d Progression Factor 1.00 Incremental Delay, d2 0.0 Delay (s) 28.7 Level of Service C Approach Delay (s) Approach LOS Intersection Summary Sierra Gateway Apartments Synchro 9 Report Page 5
123 SimTraffic Performance Report AM Cumulative No Project 10/17/2016 4: I-80 WB On Ramp/I-80 WB Off Ramp & Rocklin Rd Performance by approach Approach EB WB SB All Denied Delay (hr) Denied Del/Veh (s) Total Delay (hr) Total Del/Veh (s) Vehicles Entered Vehicles Exited Hourly Exit Rate Input Volume % of Volume : I-80 EB Off Ramp/I-80 EB On Ramp & Rocklin Rd Performance by approach Approach EB WB NB All Denied Delay (hr) Denied Del/Veh (s) Total Delay (hr) Total Del/Veh (s) Vehicles Entered Vehicles Exited Hourly Exit Rate Input Volume % of Volume Total Network Performance Denied Delay (hr) Denied Del/Veh (s) Total Delay (hr) Total Del/Veh (s) 87.9 Vehicles Entered 5917 Vehicles Exited 5733 Hourly Exit Rate 4586 Input Volume % of Volume 34 Sierra Gateway Apartments SimTraffic Report Page 3
124 HCM Signalized Intersection Capacity Analysis Cumulative Conditions 6: Sierra College Blvd & I-80 EB Ramps/Crossing Dr AM Peak Hour Movement EBL2 EBT EBR WBL WBR WBR2 NBT NBR NBR2 SBL SBT SBR Lane Configurations Traffic Volume (vph) Future Volume (vph) Ideal Flow (vphpl) Total Lost time (s) Lane Util. Factor Frt Flt Protected Satd. Flow (prot) Flt Permitted Satd. Flow (perm) Peak-hour factor, PHF Adj. Flow (vph) RTOR Reduction (vph) Lane Group Flow (vph) Heavy Vehicles (%) 4% 4% 4% 4% 4% 4% 4% 4% 4% 4% 4% 4% Turn Type Prot NA Perm Prot pt+ov Free NA Perm Perm Prot NA Perm Protected Phases Permitted Phases 4 Free Actuated Green, G (s) Effective Green, g (s) Actuated g/c Ratio Clearance Time (s) Vehicle Extension (s) Lane Grp Cap (vph) v/s Ratio Prot c c0.48 v/s Ratio Perm c v/c Ratio Uniform Delay, d Progression Factor Incremental Delay, d Delay (s) Level of Service D C F E C A C D C E C B Approach Delay (s) Approach LOS F D D Intersection Summary HCM 2000 Control Delay 77.4 HCM 2000 Level of Service E HCM 2000 Volume to Capacity ratio 1.14 Actuated Cycle Length (s) Sum of lost time (s) 17.6 Intersection Capacity Utilization 114.3% ICU Level of Service H Analysis Period (min) 15 c Critical Lane Group Sierra Gateway Apartments Synchro 9 Report Page 3
125 HCM Signalized Intersection Capacity Analysis Cumulative Conditions 7: Sierra College Blvd & Commons Dr/I-80 WB Ramps AM Peak Hour Movement EBL EBR EBR2 WBL2 WBT WBR NBL NBT NBR SBT SBR SBR2 Lane Configurations Traffic Volume (vph) Future Volume (vph) Ideal Flow (vphpl) Total Lost time (s) Lane Util. Factor Frt Flt Protected Satd. Flow (prot) Flt Permitted Satd. Flow (perm) Peak-hour factor, PHF Adj. Flow (vph) RTOR Reduction (vph) Lane Group Flow (vph) Heavy Vehicles (%) 4% 4% 4% 4% 4% 4% 4% 4% 4% 4% 4% 4% Turn Type Prot pt+ov Prot NA Perm Prot NA Perm NA Perm Perm Protected Phases Permitted Phases Actuated Green, G (s) Effective Green, g (s) Actuated g/c Ratio Clearance Time (s) Vehicle Extension (s) Lane Grp Cap (vph) v/s Ratio Prot c0.28 c0.13 c v/s Ratio Perm c v/c Ratio Uniform Delay, d Progression Factor Incremental Delay, d Delay (s) Level of Service E D E C C E B B C E C Approach Delay (s) Approach LOS D B D Intersection Summary HCM 2000 Control Delay 39.4 HCM 2000 Level of Service D HCM 2000 Volume to Capacity ratio 0.90 Actuated Cycle Length (s) Sum of lost time (s) 18.8 Intersection Capacity Utilization 78.5% ICU Level of Service D Analysis Period (min) 15 c Critical Lane Group Sierra Gateway Apartments Synchro 9 Report Page 4
126 SimTraffic Performance Report PM Cumulative No Project 10/18/2016 4: I-80 WB On Ramp/I-80 WB Off Ramp & Rocklin Rd Performance by movement Movement EBT EBR WBL WBT SBL SBR All Denied Delay (hr) Denied Del/Veh (s) Total Delay (hr) Total Del/Veh (s) Vehicles Entered Vehicles Exited Hourly Exit Rate Input Volume % of Volume : I-80 EB Off Ramp/I-80 EB On Ramp & Rocklin Rd Performance by movement Movement EBL EBT WBT WBR NBL NBT NBR All Denied Delay (hr) Denied Del/Veh (s) Total Delay (hr) Total Del/Veh (s) Vehicles Entered Vehicles Exited Hourly Exit Rate Input Volume % of Volume Total Network Performance Denied Delay (hr) Denied Del/Veh (s) Total Delay (hr) Total Del/Veh (s) Vehicles Entered 4681 Vehicles Exited 4668 Hourly Exit Rate 4668 Input Volume % of Volume 30 Sierra Gateway Apartments SimTraffic Report Page 3
127 HCM Signalized Intersection Capacity Analysis Cumulative Conditions 6: Sierra College Blvd & I-80 EB Ramps/Crossing Dr PM Peak Hour Movement EBL2 EBT EBR WBL WBR WBR2 NBT NBR NBR2 SBL SBT SBR Lane Configurations Traffic Volume (vph) Future Volume (vph) Ideal Flow (vphpl) Total Lost time (s) Lane Util. Factor Frt Flt Protected Satd. Flow (prot) Flt Permitted Satd. Flow (perm) Peak-hour factor, PHF Adj. Flow (vph) RTOR Reduction (vph) Lane Group Flow (vph) Turn Type Prot NA Perm Prot pt+ov Free NA Perm Perm Prot NA Perm Protected Phases Permitted Phases 4 Free Actuated Green, G (s) Effective Green, g (s) Actuated g/c Ratio Clearance Time (s) Vehicle Extension (s) Lane Grp Cap (vph) v/s Ratio Prot c c v/s Ratio Perm 0.01 c0.19 c v/c Ratio Uniform Delay, d Progression Factor Incremental Delay, d Delay (s) Level of Service D D D E D A C D B E B B Approach Delay (s) Approach LOS D C C Intersection Summary HCM 2000 Control Delay 30.7 HCM 2000 Level of Service C HCM 2000 Volume to Capacity ratio 0.88 Actuated Cycle Length (s) Sum of lost time (s) 17.6 Intersection Capacity Utilization 68.9% ICU Level of Service C Analysis Period (min) 15 c Critical Lane Group Sierra Gateway Apartments Synchro 9 Report Page 3
128 HCM Signalized Intersection Capacity Analysis Cumulative Conditions 7: Sierra College Blvd & Commons Dr/I-80 WB Ramps PM Peak Hour Movement EBL EBR EBR2 WBL2 WBL WBT WBR NBL NBT NBR SBT SBR Lane Configurations Traffic Volume (vph) Future Volume (vph) Ideal Flow (vphpl) Total Lost time (s) Lane Util. Factor Frt Flt Protected Satd. Flow (prot) Flt Permitted Satd. Flow (perm) Peak-hour factor, PHF Adj. Flow (vph) RTOR Reduction (vph) Lane Group Flow (vph) Heavy Vehicles (%) 4% 4% 4% 4% 4% 4% 4% 4% 4% 4% 4% 4% Turn Type Prot pt+ov Prot Perm NA Perm Prot NA Perm NA Perm Protected Phases Permitted Phases Actuated Green, G (s) Effective Green, g (s) Actuated g/c Ratio Clearance Time (s) Vehicle Extension (s) Lane Grp Cap (vph) v/s Ratio Prot c c c0.31 v/s Ratio Perm c v/c Ratio Uniform Delay, d Progression Factor Incremental Delay, d Delay (s) Level of Service F C E D C C E B A D C Approach Delay (s) Approach LOS D B D Intersection Summary HCM 2000 Control Delay 31.7 HCM 2000 Level of Service C HCM 2000 Volume to Capacity ratio 0.92 Actuated Cycle Length (s) 92.3 Sum of lost time (s) 18.8 Intersection Capacity Utilization 78.5% ICU Level of Service D Analysis Period (min) 15 c Critical Lane Group Sierra Gateway Apartments Synchro 9 Report Page 4
129 HCM Signalized Intersection Capacity Analysis Cumulative Conditions 7: Sierra College Blvd & Commons Dr/I-80 WB Ramps PM Peak Hour Movement SBR2 Lane Configurations Traffic Volume (vph) 125 Future Volume (vph) 125 Ideal Flow (vphpl) 1900 Total Lost time (s) 5.7 Lane Util. Factor 1.00 Frt 0.85 Flt Protected 1.00 Satd. Flow (prot) 1553 Flt Permitted 1.00 Satd. Flow (perm) 1553 Peak-hour factor, PHF 1.00 Adj. Flow (vph) 125 RTOR Reduction (vph) 82 Lane Group Flow (vph) 43 Heavy Vehicles (%) 4% Turn Type Perm Protected Phases Permitted Phases 6 Actuated Green, G (s) 31.6 Effective Green, g (s) 31.6 Actuated g/c Ratio 0.34 Clearance Time (s) 5.7 Vehicle Extension (s) 1.0 Lane Grp Cap (vph) 531 v/s Ratio Prot v/s Ratio Perm 0.03 v/c Ratio 0.08 Uniform Delay, d Progression Factor 1.00 Incremental Delay, d2 0.0 Delay (s) 20.5 Level of Service C Approach Delay (s) Approach LOS Intersection Summary Sierra Gateway Apartments Synchro 9 Report Page 5
130 SimTraffic Performance Report AM Cumulative Plus Project 10/18/2016 4: I-80 WB On Ramp/I-80 WB Off Ramp & Rocklin Rd Performance by approach Approach EB WB SB All Denied Delay (hr) Denied Del/Veh (s) Total Delay (hr) Total Del/Veh (s) Vehicles Entered Vehicles Exited Hourly Exit Rate Input Volume % of Volume : I-80 EB Off Ramp/I-80 EB On Ramp & Rocklin Rd Performance by approach Approach EB WB NB All Denied Delay (hr) Denied Del/Veh (s) Total Delay (hr) Total Del/Veh (s) Vehicles Entered Vehicles Exited Hourly Exit Rate Input Volume % of Volume Total Network Performance Denied Delay (hr) Denied Del/Veh (s) Total Delay (hr) Total Del/Veh (s) 92.8 Vehicles Entered 5946 Vehicles Exited 5763 Hourly Exit Rate 4610 Input Volume % of Volume 34 Sierra Gateway Apartments SimTraffic Report Page 3
131 HCM Signalized Intersection Capacity Analysis Cumulative Plus Project Conditions 6: Sierra College Blvd & I-80 EB Ramps/Crossing Dr AM Peak Hour Movement EBL2 EBT EBR WBL WBR WBR2 NBT NBR NBR2 SBL SBT SBR Lane Configurations Traffic Volume (vph) Future Volume (vph) Ideal Flow (vphpl) Total Lost time (s) Lane Util. Factor Frt Flt Protected Satd. Flow (prot) Flt Permitted Satd. Flow (perm) Peak-hour factor, PHF Adj. Flow (vph) RTOR Reduction (vph) Lane Group Flow (vph) Heavy Vehicles (%) 4% 4% 4% 4% 4% 2% 4% 2% 4% 4% 4% 4% Turn Type Prot NA Perm Prot pt+ov Free NA Perm Perm Prot NA Perm Protected Phases Permitted Phases 4 Free Actuated Green, G (s) Effective Green, g (s) Actuated g/c Ratio Clearance Time (s) Vehicle Extension (s) Lane Grp Cap (vph) v/s Ratio Prot c c0.48 v/s Ratio Perm c c v/c Ratio Uniform Delay, d Progression Factor Incremental Delay, d Delay (s) Level of Service D C F E C A C E C E C B Approach Delay (s) Approach LOS F D D Intersection Summary HCM 2000 Control Delay 79.7 HCM 2000 Level of Service E HCM 2000 Volume to Capacity ratio 1.15 Actuated Cycle Length (s) Sum of lost time (s) 17.6 Intersection Capacity Utilization 114.5% ICU Level of Service H Analysis Period (min) 15 c Critical Lane Group Sierra Gateway Apartments Synchro 9 Report Page 3
132 HCM Signalized Intersection Capacity Analysis Cumulative Plus Project Conditions 7: Sierra College Blvd & Commons Dr/I-80 WB Ramps AM Peak Hour Movement EBL EBR EBR2 WBL2 WBT WBR NBL NBT NBR SBT SBR SBR2 Lane Configurations Traffic Volume (vph) Future Volume (vph) Ideal Flow (vphpl) Total Lost time (s) Lane Util. Factor Frt Flt Protected Satd. Flow (prot) Flt Permitted Satd. Flow (perm) Peak-hour factor, PHF Adj. Flow (vph) RTOR Reduction (vph) Lane Group Flow (vph) Heavy Vehicles (%) 4% 4% 4% 4% 4% 4% 4% 4% 4% 4% 4% 4% Turn Type Prot pt+ov Prot NA Perm Prot NA Perm NA Perm Perm Protected Phases Permitted Phases Actuated Green, G (s) Effective Green, g (s) Actuated g/c Ratio Clearance Time (s) Vehicle Extension (s) Lane Grp Cap (vph) v/s Ratio Prot c0.28 c0.13 c v/s Ratio Perm c v/c Ratio Uniform Delay, d Progression Factor Incremental Delay, d Delay (s) Level of Service E D E C C E B B C E C Approach Delay (s) Approach LOS D B D Intersection Summary HCM 2000 Control Delay 39.5 HCM 2000 Level of Service D HCM 2000 Volume to Capacity ratio 0.90 Actuated Cycle Length (s) Sum of lost time (s) 18.8 Intersection Capacity Utilization 78.7% ICU Level of Service D Analysis Period (min) 15 c Critical Lane Group Sierra Gateway Apartments Synchro 9 Report Page 4
133 SimTraffic Performance Report PM Cumulative Plus Project 10/18/2016 4: I-80 WB On Ramp/I-80 WB Off Ramp & Rocklin Rd Performance by movement Movement EBT EBR WBL WBT SBL SBR All Denied Delay (hr) Denied Del/Veh (s) Total Delay (hr) Total Del/Veh (s) Vehicles Entered Vehicles Exited Hourly Exit Rate Input Volume % of Volume : I-80 EB Off Ramp/I-80 EB On Ramp & Rocklin Rd Performance by movement Movement EBL EBT WBT WBR NBL NBT NBR All Denied Delay (hr) Denied Del/Veh (s) Total Delay (hr) Total Del/Veh (s) Vehicles Entered Vehicles Exited Hourly Exit Rate Input Volume % of Volume Total Network Performance Denied Delay (hr) Denied Del/Veh (s) Total Delay (hr) Total Del/Veh (s) Vehicles Entered 4501 Vehicles Exited 4497 Hourly Exit Rate 4497 Input Volume % of Volume 28 Sierra Gateway Apartments SimTraffic Report Page 3
134 HCM Signalized Intersection Capacity Analysis Cumulative Plus Project Conditions 6: Sierra College Blvd & I-80 EB Ramps/Crossing Dr PM Peak Hour Movement EBL2 EBT EBR WBL WBR WBR2 NBT NBR NBR2 SBL SBT SBR Lane Configurations Traffic Volume (vph) Future Volume (vph) Ideal Flow (vphpl) Total Lost time (s) Lane Util. Factor Frt Flt Protected Satd. Flow (prot) Flt Permitted Satd. Flow (perm) Peak-hour factor, PHF Adj. Flow (vph) RTOR Reduction (vph) Lane Group Flow (vph) Turn Type Prot NA Perm Prot pt+ov Free NA Perm Perm Prot NA Perm Protected Phases Permitted Phases 4 Free Actuated Green, G (s) Effective Green, g (s) Actuated g/c Ratio Clearance Time (s) Vehicle Extension (s) Lane Grp Cap (vph) v/s Ratio Prot c c v/s Ratio Perm 0.02 c0.19 c v/c Ratio Uniform Delay, d Progression Factor Incremental Delay, d Delay (s) Level of Service D D D E D A C D B E B B Approach Delay (s) Approach LOS D C C Intersection Summary HCM 2000 Control Delay 31.0 HCM 2000 Level of Service C HCM 2000 Volume to Capacity ratio 0.89 Actuated Cycle Length (s) Sum of lost time (s) 17.6 Intersection Capacity Utilization 69.0% ICU Level of Service C Analysis Period (min) 15 c Critical Lane Group Sierra Gateway Apartments Synchro 9 Report Page 3
135 HCM Signalized Intersection Capacity Analysis Cumulative Plus Project Conditions 7: Sierra College Blvd & Commons Dr/I-80 WB Ramps PM Peak Hour Movement EBL EBR EBR2 WBL2 WBL WBT WBR NBL NBT NBR SBT SBR Lane Configurations Traffic Volume (vph) Future Volume (vph) Ideal Flow (vphpl) Total Lost time (s) Lane Util. Factor Frt Flt Protected Satd. Flow (prot) Flt Permitted Satd. Flow (perm) Peak-hour factor, PHF Adj. Flow (vph) RTOR Reduction (vph) Lane Group Flow (vph) Heavy Vehicles (%) 4% 4% 2% 4% 2% 4% 4% 4% 4% 4% 4% 2% Turn Type Prot pt+ov Prot Perm NA Perm Prot NA Perm NA Perm Protected Phases Permitted Phases Actuated Green, G (s) Effective Green, g (s) Actuated g/c Ratio Clearance Time (s) Vehicle Extension (s) Lane Grp Cap (vph) v/s Ratio Prot c c c0.31 v/s Ratio Perm c v/c Ratio Uniform Delay, d Progression Factor Incremental Delay, d Delay (s) Level of Service F C E D C C E B A D C Approach Delay (s) Approach LOS D B D Intersection Summary HCM 2000 Control Delay 32.2 HCM 2000 Level of Service C HCM 2000 Volume to Capacity ratio 0.92 Actuated Cycle Length (s) 92.9 Sum of lost time (s) 18.8 Intersection Capacity Utilization 79.1% ICU Level of Service D Analysis Period (min) 15 c Critical Lane Group Sierra Gateway Apartments Synchro 9 Report Page 4
136 HCM Signalized Intersection Capacity Analysis Cumulative Plus Project Conditions 7: Sierra College Blvd & Commons Dr/I-80 WB Ramps PM Peak Hour Movement SBR2 Lane Configurations Traffic Volume (vph) 126 Future Volume (vph) 126 Ideal Flow (vphpl) 1900 Total Lost time (s) 5.7 Lane Util. Factor 1.00 Frt 0.85 Flt Protected 1.00 Satd. Flow (prot) 1553 Flt Permitted 1.00 Satd. Flow (perm) 1553 Peak-hour factor, PHF 1.00 Adj. Flow (vph) 126 RTOR Reduction (vph) 83 Lane Group Flow (vph) 43 Heavy Vehicles (%) 4% Turn Type Perm Protected Phases Permitted Phases 6 Actuated Green, G (s) 31.9 Effective Green, g (s) 31.9 Actuated g/c Ratio 0.34 Clearance Time (s) 5.7 Vehicle Extension (s) 1.0 Lane Grp Cap (vph) 533 v/s Ratio Prot v/s Ratio Perm 0.03 v/c Ratio 0.08 Uniform Delay, d Progression Factor 1.00 Incremental Delay, d2 0.0 Delay (s) 20.6 Level of Service C Approach Delay (s) Approach LOS Intersection Summary Sierra Gateway Apartments Synchro 9 Report Page 5
137 HCS Worksheets Sierra Gateway Apartments TIAR Page 39 The Ezralow Company, LLC R1783TIA007.docx
138 HCS 2010: Basic Freeway Segments Release 6.70 Phone: Fax: Operational Analysis Analyst: Makinzie Clark Agency or Company: Omni-Means Date Performed: 6/8/2016 Analysis Time Period: AM Peak Hour Freeway/Direction: I-80 Eastbound From/To: South of Rocklin Road Jurisdiction: Caltrans Analysis Year: Existing Description: Sierra Gateway Apartments TIS Flow Inputs and Adjustments Volume, V 4013 veh/h Peak-hour factor, PHF 0.92 Peak 15-min volume, v v Trucks and buses 9 % Recreational vehicles 0 % Terrain type: Level Grade - % Segment length - mi Trucks and buses PCE, ET 1.5 Recreational vehicle PCE, ER 1.2 Heavy vehicle adjustment, fhv Driver population factor, fp 1.00 Flow rate, vp 1519 pc/h/ln Speed Inputs and Adjustments Lane width - ft Right-side lateral clearance - ft Total ramp density, TRD - ramps/mi Number of lanes, N 3 Free-flow speed: Measured FFS or BFFS 65.0 mi/h Lane width adjustment, flw - mi/h Lateral clearance adjustment, flc - mi/h TRD adjustment - mi/h Free-flow speed, FFS 65.0 mi/h LOS and Performance Measures Flow rate, vp 1519 pc/h/ln Free-flow speed, FFS 65.0 mi/h Average passenger-car speed, S 64.8 mi/h Number of lanes, N 3 Density, D 23.4 pc/mi/ln Level of service, LOS C
139 HCS 2010: Freeway Merge and Diverge Segments Release 6.70 Phone: Fax: Diverge Analysis Analyst: Makinzie Clark Agency/Co.: Omni-Means Date performed: 6/8/2016 Analysis time period: AM Peak Hour Freeway/Dir of Travel: I-80 Eastbound Junction: Rocklin Road Off Ramp Jurisdiction: Caltrans Analysis Year: Existing Description: Sierra Gateway Apartments TIS Freeway Data Type of analysis Diverge Number of lanes in freeway 3 Free-flow speed on freeway 65.0 mph Volume on freeway 4013 vph Off Ramp Data Side of freeway Right Number of lanes in ramp 1 Free-Flow speed on ramp 35.0 mph Volume on ramp 1432 vph Length of first accel/decel lane 1050 ft Length of second accel/decel lane ft Adjacent Ramp Data (if one exists) Does adjacent ramp exist? Volume on adjacent ramp Position of adjacent ramp Type of adjacent ramp Distance to adjacent ramp No vph ft Conversion to pc/h Under Base Conditions Junction Components Freeway Ramp Adjacent Ramp Volume, V (vph) vph Peak-hour factor, PHF Peak 15-min volume, v v Trucks and buses 9 2 % Recreational vehicles 0 0 % Terrain type: Level Level Grade 0.00 % 0.00 % % Length 0.00 mi 0.00 mi mi Trucks and buses PCE, ET Recreational vehicle PCE, ER
140 Heavy vehicle adjustment, fhv Driver population factor, fp Flow rate, vp pcph Estimation of V12 Diverge Areas L = (Equation or 13-13) EQ P = Using Equation 9 FD v = v + (v - v ) P = 3276 pc/h 12 R F R FD Capacity Checks Actual Maximum LOS F? v = v No Fi F v = v - v No FO F R v No R v or v 1282 pc/h (Equation or 13-17) Is v or v > 2700 pc/h? No Is v or v > 1.5 v /2 No 12 If yes, v = 3276 (Equation 13-15, 13-16, 13-18, or 13-19) 12A Flow Entering Diverge Influence Area Actual Max Desirable Violation? v No 12 Level of Service Determination (if not F) Density, D = v L = 23.0 pc/mi/ln R 12 D Level of service for ramp-freeway junction areas of influence C Speed Estimation Intermediate speed variable, D = S Space mean speed in ramp influence area, S = 52.0 mph R Space mean speed in outer lanes, S = 70.2 mph 0 Space mean speed for all vehicles, S = 56.1 mph
141 HCS 2010: Freeway Merge and Diverge Segments Release 6.70 Phone: Fax: Merge Analysis Analyst: Makinzie Clark Agency/Co.: Omni-Means Date performed: 6/8/2016 Analysis time period: AM Peak Hour Freeway/Dir of Travel: I-80 Eastbound Junction: Rocklin Road On Ramp Jurisdiction: Caltrans Analysis Year: Existing Description: Sierra Gateway Apartments TIS Freeway Data Type of analysis Merge Number of lanes in freeway 3 Free-flow speed on freeway 65.0 mph Volume on freeway 2581 vph On Ramp Data Side of freeway Right Number of lanes in ramp 1 Free-flow speed on ramp 35.0 mph Volume on ramp 211 vph Length of first accel/decel lane 360 ft Length of second accel/decel lane ft Adjacent Ramp Data (if one exists) Does adjacent ramp exist? Volume on adjacent Ramp Position of adjacent Ramp Type of adjacent Ramp Distance to adjacent Ramp No vph ft Conversion to pc/h Under Base Conditions Junction Components Freeway Ramp Adjacent Ramp Volume, V (vph) vph Peak-hour factor, PHF Peak 15-min volume, v v Trucks and buses 9 2 % Recreational vehicles 0 0 % Terrain type: Level Level Grade % % % Length mi mi mi Trucks and buses PCE, ET Recreational vehicle PCE, ER
142 Heavy vehicle adjustment, fhv Driver population factor, fp Flow rate, vp pcph Estimation of V12 Merge Areas L = (Equation 13-6 or 13-7) EQ P = Using Equation 3 FM v = v (P ) = 1723 pc/h 12 F FM Capacity Checks Actual Maximum LOS F? v No FO v or v 1209 pc/h (Equation or 13-17) Is v or v > 2700 pc/h? No Is v or v > 1.5 v /2 Yes 12 If yes, v = 1723 (Equation 13-15, 13-16, 13-18, or 13-19) 12A Flow Entering Merge Influence Area Actual Max Desirable Violation? v No 12A Level of Service Determination (if not F) Density, D = v v L = 18.3 pc/mi/ln R R 12 A Level of service for ramp-freeway junction areas of influence B Speed Estimation Intermediate speed variable, M = S Space mean speed in ramp influence area, S = 57.6 mph R Space mean speed in outer lanes, S = 62.4 mph 0 Space mean speed for all vehicles, S = 59.3 mph
143 HCS 2010: Freeway Merge and Diverge Segments Release 6.70 Phone: Fax: Diverge Analysis Analyst: Makinzie Clark Agency/Co.: Omni-Means Date performed: 6/8/2016 Analysis time period: AM Peak Hour Freeway/Dir of Travel: I-80 Westbound Junction: Rocklin Road Off Ramp Jurisdiction: Caltrans Analysis Year: Existing Description: Sierra Gateway Apartments TIS Freeway Data Type of analysis Diverge Number of lanes in freeway 3 Free-flow speed on freeway 65.0 mph Volume on freeway 4009 vph Off Ramp Data Side of freeway Right Number of lanes in ramp 1 Free-Flow speed on ramp 35.0 mph Volume on ramp 282 vph Length of first accel/decel lane 150 ft Length of second accel/decel lane ft Adjacent Ramp Data (if one exists) Does adjacent ramp exist? Volume on adjacent ramp Position of adjacent ramp Type of adjacent ramp Distance to adjacent ramp No vph ft Conversion to pc/h Under Base Conditions Junction Components Freeway Ramp Adjacent Ramp Volume, V (vph) vph Peak-hour factor, PHF Peak 15-min volume, v v Trucks and buses 9 2 % Recreational vehicles 0 0 % Terrain type: Level Level Grade 0.00 % 0.00 % % Length 0.00 mi 0.00 mi mi Trucks and buses PCE, ET Recreational vehicle PCE, ER
144 Heavy vehicle adjustment, fhv Driver population factor, fp Flow rate, vp pcph Estimation of V12 Diverge Areas L = (Equation or 13-13) EQ P = Using Equation 9 FD v = v + (v - v ) P = 2991 pc/h 12 R F R FD Capacity Checks Actual Maximum LOS F? v = v No Fi F v = v - v No FO F R v No R v or v 1563 pc/h (Equation or 13-17) Is v or v > 2700 pc/h? No Is v or v > 1.5 v /2 No 12 If yes, v = 2991 (Equation 13-15, 13-16, 13-18, or 13-19) 12A Flow Entering Diverge Influence Area Actual Max Desirable Violation? v No 12 Level of Service Determination (if not F) Density, D = v L = 28.6 pc/mi/ln R 12 D Level of service for ramp-freeway junction areas of influence D Speed Estimation Intermediate speed variable, D = S Space mean speed in ramp influence area, S = 54.5 mph R Space mean speed in outer lanes, S = 69.1 mph 0 Space mean speed for all vehicles, S = 58.8 mph
145 HCS 2010: Freeway Merge and Diverge Segments Release 6.70 Phone: Fax: Merge Analysis Analyst: Makinzie Clark Agency/Co.: Omni-Means Date performed: 6/8/2016 Analysis time period: AM Peak Hour Freeway/Dir of Travel: I-80 Westbound Junction: Rocklin Road On Ramp Jurisdiction: Caltrans Analysis Year: Existing Description: Sierra Gateway Apartments TIS Freeway Data Type of analysis Merge Number of lanes in freeway 3 Free-flow speed on freeway 65.0 mph Volume on freeway 3727 vph On Ramp Data Side of freeway Right Number of lanes in ramp 1 Free-flow speed on ramp 35.0 mph Volume on ramp 776 vph Length of first accel/decel lane 750 ft Length of second accel/decel lane ft Adjacent Ramp Data (if one exists) Does adjacent ramp exist? Volume on adjacent Ramp Position of adjacent Ramp Type of adjacent Ramp Distance to adjacent Ramp No vph ft Conversion to pc/h Under Base Conditions Junction Components Freeway Ramp Adjacent Ramp Volume, V (vph) vph Peak-hour factor, PHF Peak 15-min volume, v v Trucks and buses 9 2 % Recreational vehicles 0 0 % Terrain type: Level Level Grade % % % Length mi mi mi Trucks and buses PCE, ET Recreational vehicle PCE, ER
146 Heavy vehicle adjustment, fhv Driver population factor, fp Flow rate, vp pcph Estimation of V12 Merge Areas L = (Equation 13-6 or 13-7) EQ P = Using Equation 3 FM v = v (P ) = 2533 pc/h 12 F FM Capacity Checks Actual Maximum LOS F? v No FO v or v 1700 pc/h (Equation or 13-17) Is v or v > 2700 pc/h? No Is v or v > 1.5 v /2 Yes 12 If yes, v = 2533 (Equation 13-15, 13-16, 13-18, or 13-19) 12A Flow Entering Merge Influence Area Actual Max Desirable Violation? v No 12A Level of Service Determination (if not F) Density, D = v v L = 26.7 pc/mi/ln R R 12 A Level of service for ramp-freeway junction areas of influence C Speed Estimation Intermediate speed variable, M = S Space mean speed in ramp influence area, S = 56.2 mph R Space mean speed in outer lanes, S = 60.7 mph 0 Space mean speed for all vehicles, S = 57.6 mph
147 HCS 2010: Basic Freeway Segments Release 6.70 Phone: Fax: Operational Analysis Analyst: Makinzie Clark Agency or Company: Omni-Means Date Performed: 6/8/2016 Analysis Time Period: AM Peak Hour Freeway/Direction: I-80 Westbound From/To: South of Rocklin Road Jurisdiction: Caltrans Analysis Year: Existing Description: Sierra Gateway Apartments TIS Flow Inputs and Adjustments Volume, V 4503 veh/h Peak-hour factor, PHF 0.92 Peak 15-min volume, v v Trucks and buses 9 % Recreational vehicles 0 % Terrain type: Level Grade - % Segment length - mi Trucks and buses PCE, ET 1.5 Recreational vehicle PCE, ER 1.2 Heavy vehicle adjustment, fhv Driver population factor, fp 1.00 Flow rate, vp 1705 pc/h/ln Speed Inputs and Adjustments Lane width - ft Right-side lateral clearance - ft Total ramp density, TRD - ramps/mi Number of lanes, N 3 Free-flow speed: Measured FFS or BFFS 65.0 mi/h Lane width adjustment, flw - mi/h Lateral clearance adjustment, flc - mi/h TRD adjustment - mi/h Free-flow speed, FFS 65.0 mi/h LOS and Performance Measures Flow rate, vp 1705 pc/h/ln Free-flow speed, FFS 65.0 mi/h Average passenger-car speed, S 63.7 mi/h Number of lanes, N 3 Density, D 26.8 pc/mi/ln Level of service, LOS D
148 HCS 2010: Basic Freeway Segments Release 6.70 Phone: Fax: Operational Analysis Analyst: Makinzie Clark Agency or Company: Omni-Means Date Performed: 6/8/2016 Analysis Time Period: AM Peak Freeway/Direction: I-80 Eastbound From/To: Rocklin Rd/Sierra College Blvd Jurisdiction: Caltrans Analysis Year: Existing Description: Sierra Gateway Apartments TIS Flow Inputs and Adjustments Volume, V 2792 veh/h Peak-hour factor, PHF 0.92 Peak 15-min volume, v v Trucks and buses 9 % Recreational vehicles 0 % Terrain type: Level Grade - % Segment length - mi Trucks and buses PCE, ET 1.5 Recreational vehicle PCE, ER 1.2 Heavy vehicle adjustment, fhv Driver population factor, fp 1.00 Flow rate, vp 1057 pc/h/ln Speed Inputs and Adjustments Lane width - ft Right-side lateral clearance - ft Total ramp density, TRD - ramps/mi Number of lanes, N 3 Free-flow speed: Measured FFS or BFFS 65.0 mi/h Lane width adjustment, flw - mi/h Lateral clearance adjustment, flc - mi/h TRD adjustment - mi/h Free-flow speed, FFS 65.0 mi/h LOS and Performance Measures Flow rate, vp 1057 pc/h/ln Free-flow speed, FFS 65.0 mi/h Average passenger-car speed, S 65.0 mi/h Number of lanes, N 3 Density, D 16.3 pc/mi/ln Level of service, LOS B
149 HCS 2010: Freeway Merge and Diverge Segments Release 6.70 Phone: Fax: Diverge Analysis Analyst: Makinzie Clark Agency/Co.: Omni-Means Date performed: 6/8/2016 Analysis time period: AM Peak Hour Freeway/Dir of Travel: I-80 Eastound Junction: Sierra College Blvd Off Ramp Jurisdiction: Caltrans Analysis Year: Existing Description: Sierra Gateway Apartments TIS Freeway Data Type of analysis Diverge Number of lanes in freeway 3 Free-flow speed on freeway 65.0 mph Volume on freeway 2792 vph Off Ramp Data Side of freeway Right Number of lanes in ramp 1 Free-Flow speed on ramp 35.0 mph Volume on ramp 539 vph Length of first accel/decel lane 150 ft Length of second accel/decel lane ft Adjacent Ramp Data (if one exists) Does adjacent ramp exist? Yes Volume on adjacent ramp 183 vph Position of adjacent ramp Downstream Type of adjacent ramp On Distance to adjacent ramp 1560 ft Conversion to pc/h Under Base Conditions Junction Components Freeway Ramp Adjacent Ramp Volume, V (vph) vph Peak-hour factor, PHF Peak 15-min volume, v v Trucks and buses % Recreational vehicles % Terrain type: Level Level Level Grade 0.00 % 0.00 % 0.00 % Length 0.00 mi 0.00 mi 0.00 mi Trucks and buses PCE, ET Recreational vehicle PCE, ER
150 Heavy vehicle adjustment, fhv Driver population factor, fp Flow rate, vp pcph Estimation of V12 Diverge Areas L = (Equation or 13-13) EQ P = Using Equation 9 FD v = v + (v - v ) P = 2283 pc/h 12 R F R FD Capacity Checks Actual Maximum LOS F? v = v No Fi F v = v - v No FO F R v No R v or v 888 pc/h (Equation or 13-17) Is v or v > 2700 pc/h? No Is v or v > 1.5 v /2 No 12 If yes, v = 2283 (Equation 13-15, 13-16, 13-18, or 13-19) 12A Flow Entering Diverge Influence Area Actual Max Desirable Violation? v No 12 Level of Service Determination (if not F) Density, D = v L = 22.5 pc/mi/ln R 12 D Level of service for ramp-freeway junction areas of influence C Speed Estimation Intermediate speed variable, D = S Space mean speed in ramp influence area, S = 53.9 mph R Space mean speed in outer lanes, S = 71.3 mph 0 Space mean speed for all vehicles, S = 57.8 mph
151 HCS 2010: Freeway Merge and Diverge Segments Release 6.70 Phone: Fax: Merge Analysis Analyst: Makinzie Clark Agency/Co.: Omni-Means Date performed: 6/8/2016 Analysis time period: AM Peak Hour Freeway/Dir of Travel: I-80 Eastbound Junction: Sierra College Blvd On Loop Jurisdiction: Caltrans Analysis Year: Existing Description: Sierra Gateway Apartments TIS Freeway Data Type of analysis Merge Number of lanes in freeway 3 Free-flow speed on freeway 65.0 mph Volume on freeway 2253 vph On Ramp Data Side of freeway Right Number of lanes in ramp 1 Free-flow speed on ramp 25.0 mph Volume on ramp 183 vph Length of first accel/decel lane 800 ft Length of second accel/decel lane ft Adjacent Ramp Data (if one exists) Does adjacent ramp exist? Yes Volume on adjacent Ramp 403 vph Position of adjacent Ramp Downstream Type of adjacent Ramp On Distance to adjacent Ramp 1420 ft Conversion to pc/h Under Base Conditions Junction Components Freeway Ramp Adjacent Ramp Volume, V (vph) vph Peak-hour factor, PHF Peak 15-min volume, v v Trucks and buses % Recreational vehicles % Terrain type: Level Level Level Grade % % % Length mi mi mi Trucks and buses PCE, ET Recreational vehicle PCE, ER
152 Heavy vehicle adjustment, fhv Driver population factor, fp Flow rate, vp pcph Estimation of V12 Merge Areas L = (Equation 13-6 or 13-7) EQ P = Using Equation 3 FM v = v (P ) = 1535 pc/h 12 F FM Capacity Checks Actual Maximum LOS F? v No FO v or v 1024 pc/h (Equation or 13-17) Is v or v > 2700 pc/h? No Is v or v > 1.5 v /2 Yes 12 If yes, v = 1535 (Equation 13-15, 13-16, 13-18, or 13-19) 12A Flow Entering Merge Influence Area Actual Max Desirable Violation? v No 12A Level of Service Determination (if not F) Density, D = v v L = 14.0 pc/mi/ln R R 12 A Level of service for ramp-freeway junction areas of influence B Speed Estimation Intermediate speed variable, M = S Space mean speed in ramp influence area, S = 58.0 mph R Space mean speed in outer lanes, S = 63.1 mph 0 Space mean speed for all vehicles, S = 59.8 mph
153 HCS 2010: Freeway Merge and Diverge Segments Release 6.70 Phone: Fax: Merge Analysis Analyst: Makinzie Clark Agency/Co.: Omni-Means Date performed: 6/8/2016 Analysis time period: AM Peak Hour Freeway/Dir of Travel: I-80 Eastbound Junction: Sierra College Blvd On Ramp Jurisdiction: Caltrans Analysis Year: Existing Description: Sierra Gateway Apartments TIS Freeway Data Type of analysis Merge Number of lanes in freeway 3 Free-flow speed on freeway 65.0 mph Volume on freeway 2436 vph On Ramp Data Side of freeway Right Number of lanes in ramp 1 Free-flow speed on ramp 35.0 mph Volume on ramp 403 vph Length of first accel/decel lane 700 ft Length of second accel/decel lane ft Adjacent Ramp Data (if one exists) Does adjacent ramp exist? Yes Volume on adjacent Ramp 183 vph Position of adjacent Ramp Upstream Type of adjacent Ramp On Distance to adjacent Ramp 1420 ft Conversion to pc/h Under Base Conditions Junction Components Freeway Ramp Adjacent Ramp Volume, V (vph) vph Peak-hour factor, PHF Peak 15-min volume, v v Trucks and buses % Recreational vehicles % Terrain type: Level Level Level Grade % % % Length mi mi mi Trucks and buses PCE, ET Recreational vehicle PCE, ER
154 Heavy vehicle adjustment, fhv Driver population factor, fp Flow rate, vp pcph Estimation of V12 Merge Areas L = (Equation 13-6 or 13-7) EQ P = Using Equation 3 FM v = v (P ) = 1652 pc/h 12 F FM Capacity Checks Actual Maximum LOS F? v No FO v or v 1115 pc/h (Equation or 13-17) Is v or v > 2700 pc/h? No Is v or v > 1.5 v /2 Yes 12 If yes, v = 1652 (Equation 13-15, 13-16, 13-18, or 13-19) 12A Flow Entering Merge Influence Area Actual Max Desirable Violation? v No 12A Level of Service Determination (if not F) Density, D = v v L = 17.4 pc/mi/ln R R 12 A Level of service for ramp-freeway junction areas of influence B Speed Estimation Intermediate speed variable, M = S Space mean speed in ramp influence area, S = 58.0 mph R Space mean speed in outer lanes, S = 62.8 mph 0 Space mean speed for all vehicles, S = 59.6 mph
155 HCS 2010: Basic Freeway Segments Release 6.70 Phone: Fax: Operational Analysis Analyst: Makinzie Clark Agency or Company: Omni-Means Date Performed: 6/8/2016 Analysis Time Period: AM Peak Hour Freeway/Direction: I-80 Eastbound From/To: North of Sierra College Blvd Jurisdiction: Caltrans Analysis Year: Existing Description: Sierra Gateway Apartments TIS Flow Inputs and Adjustments Volume, V 2839 veh/h Peak-hour factor, PHF 0.92 Peak 15-min volume, v v Trucks and buses 9 % Recreational vehicles 0 % Terrain type: Level Grade - % Segment length - mi Trucks and buses PCE, ET 1.5 Recreational vehicle PCE, ER 1.2 Heavy vehicle adjustment, fhv Driver population factor, fp 1.00 Flow rate, vp 1075 pc/h/ln Speed Inputs and Adjustments Lane width - ft Right-side lateral clearance - ft Total ramp density, TRD - ramps/mi Number of lanes, N 3 Free-flow speed: Measured FFS or BFFS 65.0 mi/h Lane width adjustment, flw - mi/h Lateral clearance adjustment, flc - mi/h TRD adjustment - mi/h Free-flow speed, FFS 65.0 mi/h LOS and Performance Measures Flow rate, vp 1075 pc/h/ln Free-flow speed, FFS 65.0 mi/h Average passenger-car speed, S 65.0 mi/h Number of lanes, N 3 Density, D 16.5 pc/mi/ln Level of service, LOS B
156 HCS 2010: Basic Freeway Segments Release 6.70 Phone: Fax: Operational Analysis Analyst: Makinzie Clark Agency or Company: Omni-Means Date Performed: 6/8/2016 Analysis Time Period: AM Peak Hour Freeway/Direction: I-80 Westbound From/To: North of Sierra College Blvd Jurisdiction: Caltrans Analysis Year: Existing Description: Sierra Gateway Apartments TIS Flow Inputs and Adjustments Volume, V 4456 veh/h Peak-hour factor, PHF 0.92 Peak 15-min volume, v v Trucks and buses 9 % Recreational vehicles 0 % Terrain type: Level Grade - % Segment length - mi Trucks and buses PCE, ET 1.5 Recreational vehicle PCE, ER 1.2 Heavy vehicle adjustment, fhv Driver population factor, fp 1.00 Flow rate, vp 1687 pc/h/ln Speed Inputs and Adjustments Lane width - ft Right-side lateral clearance - ft Total ramp density, TRD - ramps/mi Number of lanes, N 3 Free-flow speed: Measured FFS or BFFS 65.0 mi/h Lane width adjustment, flw - mi/h Lateral clearance adjustment, flc - mi/h TRD adjustment - mi/h Free-flow speed, FFS 65.0 mi/h LOS and Performance Measures Flow rate, vp 1687 pc/h/ln Free-flow speed, FFS 65.0 mi/h Average passenger-car speed, S 63.8 mi/h Number of lanes, N 3 Density, D 26.4 pc/mi/ln Level of service, LOS D
157 HCS 2010: Freeway Merge and Diverge Segments Release 6.70 Phone: Fax: Diverge Analysis Analyst: Makinzie Clark Agency/Co.: Omni-Means Date performed: 6/8/2016 Analysis time period: AM Peak Hour Freeway/Dir of Travel: I-80 Westbound Junction: Sierra College Blvd Off Ramp Jurisdiction: Caltrans Analysis Year: Existing Description: Sierra Gateway Apartments TIS Freeway Data Type of analysis Diverge Number of lanes in freeway 3 Free-flow speed on freeway 65.0 mph Volume on freeway 4456 vph Off Ramp Data Side of freeway Right Number of lanes in ramp 1 Free-Flow speed on ramp 35.0 mph Volume on ramp 879 vph Length of first accel/decel lane 650 ft Length of second accel/decel lane ft Adjacent Ramp Data (if one exists) Does adjacent ramp exist? Yes Volume on adjacent ramp 111 vph Position of adjacent ramp Downstream Type of adjacent ramp On Distance to adjacent ramp 1650 ft Conversion to pc/h Under Base Conditions Junction Components Freeway Ramp Adjacent Ramp Volume, V (vph) vph Peak-hour factor, PHF Peak 15-min volume, v v Trucks and buses % Recreational vehicles % Terrain type: Level Level Level Grade 0.00 % 0.00 % 0.00 % Length 0.00 mi 0.00 mi 0.00 mi Trucks and buses PCE, ET Recreational vehicle PCE, ER
158 Heavy vehicle adjustment, fhv Driver population factor, fp Flow rate, vp pcph Estimation of V12 Diverge Areas L = (Equation or 13-13) EQ P = Using Equation 9 FD v = v + (v - v ) P = 3401 pc/h 12 R F R FD Capacity Checks Actual Maximum LOS F? v = v No Fi F v = v - v No FO F R v No R v or v 1660 pc/h (Equation or 13-17) Is v or v > 2700 pc/h? No Is v or v > 1.5 v /2 No 12 If yes, v = 3401 (Equation 13-15, 13-16, 13-18, or 13-19) 12A Flow Entering Diverge Influence Area Actual Max Desirable Violation? v No 12 Level of Service Determination (if not F) Density, D = v L = 27.7 pc/mi/ln R 12 D Level of service for ramp-freeway junction areas of influence C Speed Estimation Intermediate speed variable, D = S Space mean speed in ramp influence area, S = 52.9 mph R Space mean speed in outer lanes, S = 68.7 mph 0 Space mean speed for all vehicles, S = 57.3 mph
159 HCS 2010: Freeway Merge and Diverge Segments Release 6.70 Phone: Fax: Merge Analysis Analyst: Makinzie Clark Agency/Co.: Omni-Means Date performed: 6/8/2016 Analysis time period: AM Peak Hour Freeway/Dir of Travel: I-80 Westbound Junction: Sierra College Blvd On Loop Jurisdiction: Caltrans Analysis Year: Existing Description: Sierra Gateway Apartments TIS Freeway Data Type of analysis Merge Number of lanes in freeway 3 Free-flow speed on freeway 65.0 mph Volume on freeway 3577 vph On Ramp Data Side of freeway Right Number of lanes in ramp 1 Free-flow speed on ramp 25.0 mph Volume on ramp 111 vph Length of first accel/decel lane 700 ft Length of second accel/decel lane ft Adjacent Ramp Data (if one exists) Does adjacent ramp exist? Yes Volume on adjacent Ramp 321 vph Position of adjacent Ramp Downstream Type of adjacent Ramp On Distance to adjacent Ramp 1560 ft Conversion to pc/h Under Base Conditions Junction Components Freeway Ramp Adjacent Ramp Volume, V (vph) vph Peak-hour factor, PHF Peak 15-min volume, v v Trucks and buses % Recreational vehicles % Terrain type: Level Level Level Grade % % % Length mi mi mi Trucks and buses PCE, ET Recreational vehicle PCE, ER
160 Heavy vehicle adjustment, fhv Driver population factor, fp Flow rate, vp pcph Estimation of V12 Merge Areas L = (Equation 13-6 or 13-7) EQ P = Using Equation 3 FM v = v (P ) = 2426 pc/h 12 F FM Capacity Checks Actual Maximum LOS F? v No FO v or v 1637 pc/h (Equation or 13-17) Is v or v > 2700 pc/h? No Is v or v > 1.5 v /2 Yes 12 If yes, v = 2426 (Equation 13-15, 13-16, 13-18, or 13-19) 12A Flow Entering Merge Influence Area Actual Max Desirable Violation? v No 12A Level of Service Determination (if not F) Density, D = v v L = 21.0 pc/mi/ln R R 12 A Level of service for ramp-freeway junction areas of influence C Speed Estimation Intermediate speed variable, M = S Space mean speed in ramp influence area, S = 57.3 mph R Space mean speed in outer lanes, S = 60.9 mph 0 Space mean speed for all vehicles, S = 58.6 mph
161 HCS 2010: Freeway Merge and Diverge Segments Release 6.70 Phone: Fax: Merge Analysis Analyst: Makinzie Clark Agency/Co.: Omni-Means Date performed: 6/8/2016 Analysis time period: AM Peak Hour Freeway/Dir of Travel: I-80 Westbound Junction: Sierra College Blvd On Ramp Jurisdiction: Caltrans Analysis Year: Existing Description: Sierra Gateway Apartments TIS Freeway Data Type of analysis Merge Number of lanes in freeway 3 Free-flow speed on freeway 65.0 mph Volume on freeway 3688 vph On Ramp Data Side of freeway Right Number of lanes in ramp 1 Free-flow speed on ramp 35.0 mph Volume on ramp 321 vph Length of first accel/decel lane 700 ft Length of second accel/decel lane ft Adjacent Ramp Data (if one exists) Does adjacent ramp exist? Yes Volume on adjacent Ramp 111 vph Position of adjacent Ramp Upstream Type of adjacent Ramp On Distance to adjacent Ramp 1560 ft Conversion to pc/h Under Base Conditions Junction Components Freeway Ramp Adjacent Ramp Volume, V (vph) vph Peak-hour factor, PHF Peak 15-min volume, v v Trucks and buses % Recreational vehicles % Terrain type: Level Level Level Grade % % % Length mi mi mi Trucks and buses PCE, ET Recreational vehicle PCE, ER
162 Heavy vehicle adjustment, fhv Driver population factor, fp Flow rate, vp pcph Estimation of V12 Merge Areas L = (Equation 13-6 or 13-7) EQ P = Using Equation 3 FM v = v (P ) = 2501 pc/h 12 F FM Capacity Checks Actual Maximum LOS F? v No FO v or v 1688 pc/h (Equation or 13-17) Is v or v > 2700 pc/h? No Is v or v > 1.5 v /2 Yes 12 If yes, v = 2501 (Equation 13-15, 13-16, 13-18, or 13-19) 12A Flow Entering Merge Influence Area Actual Max Desirable Violation? v No 12A Level of Service Determination (if not F) Density, D = v v L = 23.5 pc/mi/ln R R 12 A Level of service for ramp-freeway junction areas of influence C Speed Estimation Intermediate speed variable, M = S Space mean speed in ramp influence area, S = 57.1 mph R Space mean speed in outer lanes, S = 60.7 mph 0 Space mean speed for all vehicles, S = 58.4 mph
163 HCS 2010: Basic Freeway Segments Release 6.70 Phone: Fax: Operational Analysis Analyst: Makinzie Clark Agency or Company: Omni-Means Date Performed: 6/8/2016 Analysis Time Period: AM Peak Hour Freeway/Direction: I-80 Westbound From/To: Sierra College Blvd/Rocklin Rd Jurisdiction: Caltrans Analysis Year: Existing Description: Sierra Gateway Apartments TIS Flow Inputs and Adjustments Volume, V 4009 veh/h Peak-hour factor, PHF 0.92 Peak 15-min volume, v v Trucks and buses 9 % Recreational vehicles 0 % Terrain type: Level Grade - % Segment length - mi Trucks and buses PCE, ET 1.5 Recreational vehicle PCE, ER 1.2 Heavy vehicle adjustment, fhv Driver population factor, fp 1.00 Flow rate, vp 1518 pc/h/ln Speed Inputs and Adjustments Lane width - ft Right-side lateral clearance - ft Total ramp density, TRD - ramps/mi Number of lanes, N 3 Free-flow speed: Measured FFS or BFFS 65.0 mi/h Lane width adjustment, flw - mi/h Lateral clearance adjustment, flc - mi/h TRD adjustment - mi/h Free-flow speed, FFS 65.0 mi/h LOS and Performance Measures Flow rate, vp 1518 pc/h/ln Free-flow speed, FFS 65.0 mi/h Average passenger-car speed, S 64.8 mi/h Number of lanes, N 3 Density, D 23.4 pc/mi/ln Level of service, LOS C
164 HCS 2010: Basic Freeway Segments Release 6.70 Phone: Fax: Operational Analysis Analyst: Makinzie Clark Agency or Company: Omni-Means Date Performed: 6/8/2016 Analysis Time Period: PM Peak Hour Freeway/Direction: I-80 Eastbound From/To: South of Rocklin Road Jurisdiction: Caltrans Analysis Year: Existing Description: Sierra Gateway Apartments TIS Flow Inputs and Adjustments Volume, V 5027 veh/h Peak-hour factor, PHF 0.92 Peak 15-min volume, v v Trucks and buses 9 % Recreational vehicles 0 % Terrain type: Level Grade - % Segment length - mi Trucks and buses PCE, ET 1.5 Recreational vehicle PCE, ER 1.2 Heavy vehicle adjustment, fhv Driver population factor, fp 1.00 Flow rate, vp 1903 pc/h/ln Speed Inputs and Adjustments Lane width - ft Right-side lateral clearance - ft Total ramp density, TRD - ramps/mi Number of lanes, N 3 Free-flow speed: Measured FFS or BFFS 65.0 mi/h Lane width adjustment, flw - mi/h Lateral clearance adjustment, flc - mi/h TRD adjustment - mi/h Free-flow speed, FFS 65.0 mi/h LOS and Performance Measures Flow rate, vp 1903 pc/h/ln Free-flow speed, FFS 65.0 mi/h Average passenger-car speed, S 61.4 mi/h Number of lanes, N 3 Density, D 31.0 pc/mi/ln Level of service, LOS D
165 HCS 2010: Freeway Merge and Diverge Segments Release 6.70 Phone: Fax: Diverge Analysis Analyst: Makinzie Clark Agency/Co.: Omni-Means Date performed: 6/8/2016 Analysis time period: PM Peak Hour Freeway/Dir of Travel: I-80 Eastbound Junction: Rocklin Road Off Ramp Jurisdiction: Caltrans Analysis Year: Existing Description: Sierra Gateway Apartments TIS Freeway Data Type of analysis Diverge Number of lanes in freeway 3 Free-flow speed on freeway 65.0 mph Volume on freeway 5027 vph Off Ramp Data Side of freeway Right Number of lanes in ramp 1 Free-Flow speed on ramp 35.0 mph Volume on ramp 1028 vph Length of first accel/decel lane 892 ft Length of second accel/decel lane ft Adjacent Ramp Data (if one exists) Does adjacent ramp exist? Volume on adjacent ramp Position of adjacent ramp Type of adjacent ramp Distance to adjacent ramp No vph ft Conversion to pc/h Under Base Conditions Junction Components Freeway Ramp Adjacent Ramp Volume, V (vph) vph Peak-hour factor, PHF Peak 15-min volume, v v Trucks and buses 9 2 % Recreational vehicles 0 0 % Terrain type: Level Level Grade 0.00 % 0.00 % % Length 0.00 mi 0.00 mi mi Trucks and buses PCE, ET Recreational vehicle PCE, ER
166 Heavy vehicle adjustment, fhv Driver population factor, fp Flow rate, vp pcph Estimation of V12 Diverge Areas L = (Equation or 13-13) EQ P = Using Equation 9 FD v = v + (v - v ) P = 3708 pc/h 12 R F R FD Capacity Checks Actual Maximum LOS F? v = v No Fi F v = v - v No FO F R v No R v or v 2002 pc/h (Equation or 13-17) Is v or v > 2700 pc/h? No Is v or v > 1.5 v /2 No 12 If yes, v = 3708 (Equation 13-15, 13-16, 13-18, or 13-19) 12A Flow Entering Diverge Influence Area Actual Max Desirable Violation? v No 12 Level of Service Determination (if not F) Density, D = v L = 28.1 pc/mi/ln R 12 D Level of service for ramp-freeway junction areas of influence D Speed Estimation Intermediate speed variable, D = S Space mean speed in ramp influence area, S = 52.9 mph R Space mean speed in outer lanes, S = 67.4 mph 0 Space mean speed for all vehicles, S = 57.2 mph
167 HCS 2010: Freeway Merge and Diverge Segments Release 6.70 Phone: Fax: Merge Analysis Analyst: Makinzie Clark Agency/Co.: Omni-Means Date performed: 6/8/2016 Analysis time period: PM Peak Hour Freeway/Dir of Travel: I-80 Eastbound Junction: Rocklin Road On Ramp Jurisdiction: Caltrans Analysis Year: Existing Description: Sierra Gateway Apartments TIS Freeway Data Type of analysis Merge Number of lanes in freeway 3 Free-flow speed on freeway 65.0 mph Volume on freeway 3999 vph On Ramp Data Side of freeway Right Number of lanes in ramp 1 Free-flow speed on ramp 35.0 mph Volume on ramp 260 vph Length of first accel/decel lane 360 ft Length of second accel/decel lane ft Adjacent Ramp Data (if one exists) Does adjacent ramp exist? Volume on adjacent Ramp Position of adjacent Ramp Type of adjacent Ramp Distance to adjacent Ramp No vph ft Conversion to pc/h Under Base Conditions Junction Components Freeway Ramp Adjacent Ramp Volume, V (vph) vph Peak-hour factor, PHF Peak 15-min volume, v v Trucks and buses 9 2 % Recreational vehicles 0 0 % Terrain type: Level Level Grade % % % Length mi mi mi Trucks and buses PCE, ET Recreational vehicle PCE, ER
168 Heavy vehicle adjustment, fhv Driver population factor, fp Flow rate, vp pcph Estimation of V12 Merge Areas L = (Equation 13-6 or 13-7) EQ P = Using Equation 3 FM v = v (P ) = 2669 pc/h 12 F FM Capacity Checks Actual Maximum LOS F? v No FO v or v 1873 pc/h (Equation or 13-17) Is v or v > 2700 pc/h? No Is v or v > 1.5 v /2 Yes 12 If yes, v = 2669 (Equation 13-15, 13-16, 13-18, or 13-19) 12A Flow Entering Merge Influence Area Actual Max Desirable Violation? v No 12A Level of Service Determination (if not F) Density, D = v v L = 26.0 pc/mi/ln R R 12 A Level of service for ramp-freeway junction areas of influence C Speed Estimation Intermediate speed variable, M = S Space mean speed in ramp influence area, S = 56.5 mph R Space mean speed in outer lanes, S = 60.1 mph 0 Space mean speed for all vehicles, S = 57.8 mph
169 HCS 2010: Freeway Merge and Diverge Segments Release 6.70 Phone: Fax: Diverge Analysis Analyst: Makinzie Clark Agency/Co.: Omni-Means Date performed: 6/8/2016 Analysis time period: PM Peak Hour Freeway/Dir of Travel: I-80 Westbound Junction: Rocklin Road Off Ramp Jurisdiction: Caltrans Analysis Year: Existing Description: Sierra Gateway Apartments TIS Freeway Data Type of analysis Diverge Number of lanes in freeway 3 Free-flow speed on freeway 65.0 mph Volume on freeway 3436 vph Off Ramp Data Side of freeway Right Number of lanes in ramp 1 Free-Flow speed on ramp 35.0 mph Volume on ramp 340 vph Length of first accel/decel lane 150 ft Length of second accel/decel lane ft Adjacent Ramp Data (if one exists) Does adjacent ramp exist? Volume on adjacent ramp Position of adjacent ramp Type of adjacent ramp Distance to adjacent ramp No vph ft Conversion to pc/h Under Base Conditions Junction Components Freeway Ramp Adjacent Ramp Volume, V (vph) vph Peak-hour factor, PHF Peak 15-min volume, v v Trucks and buses 9 2 % Recreational vehicles 0 0 % Terrain type: Level Level Grade 0.00 % 0.00 % % Length 0.00 mi 0.00 mi mi Trucks and buses PCE, ET Recreational vehicle PCE, ER
170 Heavy vehicle adjustment, fhv Driver population factor, fp Flow rate, vp pcph Estimation of V12 Diverge Areas L = (Equation or 13-13) EQ P = Using Equation 9 FD v = v + (v - v ) P = 2646 pc/h 12 R F R FD Capacity Checks Actual Maximum LOS F? v = v No Fi F v = v - v No FO F R v No R v or v 1257 pc/h (Equation or 13-17) Is v or v > 2700 pc/h? No Is v or v > 1.5 v /2 No 12 If yes, v = 2646 (Equation 13-15, 13-16, 13-18, or 13-19) 12A Flow Entering Diverge Influence Area Actual Max Desirable Violation? v No 12 Level of Service Determination (if not F) Density, D = v L = 25.7 pc/mi/ln R 12 D Level of service for ramp-freeway junction areas of influence C Speed Estimation Intermediate speed variable, D = S Space mean speed in ramp influence area, S = 54.4 mph R Space mean speed in outer lanes, S = 70.3 mph 0 Space mean speed for all vehicles, S = 58.7 mph
171 HCS 2010: Freeway Merge and Diverge Segments Release 6.70 Phone: Fax: Merge Analysis Analyst: Makinzie Clark Agency/Co.: Omni-Means Date performed: 6/8/2016 Analysis time period: PM Peak Hour Freeway/Dir of Travel: I-80 Westbound Junction: Rocklin Road On Ramp Jurisdiction: Caltrans Analysis Year: Existing Description: Sierra Gateway Apartments TIS Freeway Data Type of analysis Merge Number of lanes in freeway 3 Free-flow speed on freeway 65.0 mph Volume on freeway 3096 vph On Ramp Data Side of freeway Right Number of lanes in ramp 1 Free-flow speed on ramp 35.0 mph Volume on ramp 1170 vph Length of first accel/decel lane 760 ft Length of second accel/decel lane ft Adjacent Ramp Data (if one exists) Does adjacent ramp exist? Volume on adjacent Ramp Position of adjacent Ramp Type of adjacent Ramp Distance to adjacent Ramp No vph ft Conversion to pc/h Under Base Conditions Junction Components Freeway Ramp Adjacent Ramp Volume, V (vph) vph Peak-hour factor, PHF Peak 15-min volume, v v Trucks and buses 9 2 % Recreational vehicles 0 0 % Terrain type: Level Level Grade % % % Length mi mi mi Trucks and buses PCE, ET Recreational vehicle PCE, ER
172 Heavy vehicle adjustment, fhv Driver population factor, fp Flow rate, vp pcph Estimation of V12 Merge Areas L = (Equation 13-6 or 13-7) EQ P = Using Equation 3 FM v = v (P ) = 2106 pc/h 12 F FM Capacity Checks Actual Maximum LOS F? v No FO v or v 1411 pc/h (Equation or 13-17) Is v or v > 2700 pc/h? No Is v or v > 1.5 v /2 Yes 12 If yes, v = 2106 (Equation 13-15, 13-16, 13-18, or 13-19) 12A Flow Entering Merge Influence Area Actual Max Desirable Violation? v No 12A Level of Service Determination (if not F) Density, D = v v L = 25.9 pc/mi/ln R R 12 A Level of service for ramp-freeway junction areas of influence C Speed Estimation Intermediate speed variable, M = S Space mean speed in ramp influence area, S = 56.4 mph R Space mean speed in outer lanes, S = 61.7 mph 0 Space mean speed for all vehicles, S = 57.9 mph
173 HCS 2010: Basic Freeway Segments Release 6.70 Phone: Fax: Operational Analysis Analyst: Makinzie Clark Agency or Company: Omni-Means Date Performed: 6/8/2016 Analysis Time Period: PM Peak Hour Freeway/Direction: I-80 Westbound From/To: South of Rocklin Road Jurisdiction: Caltrans Analysis Year: Existing Description: Sierra Gateway Apartments TIS Flow Inputs and Adjustments Volume, V 4266 veh/h Peak-hour factor, PHF 0.92 Peak 15-min volume, v v Trucks and buses 9 % Recreational vehicles 0 % Terrain type: Level Grade - % Segment length - mi Trucks and buses PCE, ET 1.5 Recreational vehicle PCE, ER 1.2 Heavy vehicle adjustment, fhv Driver population factor, fp 1.00 Flow rate, vp 1615 pc/h/ln Speed Inputs and Adjustments Lane width - ft Right-side lateral clearance - ft Total ramp density, TRD - ramps/mi Number of lanes, N 3 Free-flow speed: Measured FFS or BFFS 65.0 mi/h Lane width adjustment, flw - mi/h Lateral clearance adjustment, flc - mi/h TRD adjustment - mi/h Free-flow speed, FFS 65.0 mi/h LOS and Performance Measures Flow rate, vp 1615 pc/h/ln Free-flow speed, FFS 65.0 mi/h Average passenger-car speed, S 64.3 mi/h Number of lanes, N 3 Density, D 25.1 pc/mi/ln Level of service, LOS C
174 HCS 2010: Basic Freeway Segments Release 6.70 Phone: Fax: Operational Analysis Analyst: Makinzie Clark Agency or Company: Omni-Means Date Performed: 6/8/2016 Analysis Time Period: PM Peak Hour Freeway/Direction: I-80 Eastbound From/To: Rocklin Rd/Sierra College Blvd Jurisdiction: Caltrans Analysis Year: Existing Description: Sierra Gateway Apartments TIS Flow Inputs and Adjustments Volume, V 4259 veh/h Peak-hour factor, PHF 0.92 Peak 15-min volume, v v Trucks and buses 9 % Recreational vehicles 0 % Terrain type: Level Grade - % Segment length - mi Trucks and buses PCE, ET 1.5 Recreational vehicle PCE, ER 1.2 Heavy vehicle adjustment, fhv Driver population factor, fp 1.00 Flow rate, vp 1613 pc/h/ln Speed Inputs and Adjustments Lane width - ft Right-side lateral clearance - ft Total ramp density, TRD - ramps/mi Number of lanes, N 3 Free-flow speed: Measured FFS or BFFS 65.0 mi/h Lane width adjustment, flw - mi/h Lateral clearance adjustment, flc - mi/h TRD adjustment - mi/h Free-flow speed, FFS 65.0 mi/h LOS and Performance Measures Flow rate, vp 1613 pc/h/ln Free-flow speed, FFS 65.0 mi/h Average passenger-car speed, S 64.4 mi/h Number of lanes, N 3 Density, D 25.1 pc/mi/ln Level of service, LOS C
175 HCS 2010: Freeway Merge and Diverge Segments Release 6.70 Phone: Fax: Diverge Analysis Analyst: Makinzie Clark Agency/Co.: Omni-Means Date performed: 6/8/2016 Analysis time period: PM Peak Hour Freeway/Dir of Travel: I-80 Eastound Junction: Sierra College Blvd Off Ramp Jurisdiction: Caltrans Analysis Year: Existing Description: Sierra Gateway Apartments TIS Freeway Data Type of analysis Diverge Number of lanes in freeway 3 Free-flow speed on freeway 65.0 mph Volume on freeway 4259 vph Off Ramp Data Side of freeway Right Number of lanes in ramp 1 Free-Flow speed on ramp 35.0 mph Volume on ramp 575 vph Length of first accel/decel lane 150 ft Length of second accel/decel lane ft Adjacent Ramp Data (if one exists) Does adjacent ramp exist? Yes Volume on adjacent ramp 343 vph Position of adjacent ramp Downstream Type of adjacent ramp On Distance to adjacent ramp 1560 ft Conversion to pc/h Under Base Conditions Junction Components Freeway Ramp Adjacent Ramp Volume, V (vph) vph Peak-hour factor, PHF Peak 15-min volume, v v Trucks and buses % Recreational vehicles % Terrain type: Level Level Level Grade 0.00 % 0.00 % 0.00 % Length 0.00 mi 0.00 mi 0.00 mi Trucks and buses PCE, ET Recreational vehicle PCE, ER
176 Heavy vehicle adjustment, fhv Driver population factor, fp Flow rate, vp pcph Estimation of V12 Diverge Areas L = (Equation or 13-13) EQ P = Using Equation 9 FD v = v + (v - v ) P = 3194 pc/h 12 R F R FD Capacity Checks Actual Maximum LOS F? v = v No Fi F v = v - v No FO F R v No R v or v 1644 pc/h (Equation or 13-17) Is v or v > 2700 pc/h? No Is v or v > 1.5 v /2 No 12 If yes, v = 3194 (Equation 13-15, 13-16, 13-18, or 13-19) 12A Flow Entering Diverge Influence Area Actual Max Desirable Violation? v No 12 Level of Service Determination (if not F) Density, D = v L = 30.4 pc/mi/ln R 12 D Level of service for ramp-freeway junction areas of influence D Speed Estimation Intermediate speed variable, D = S Space mean speed in ramp influence area, S = 53.9 mph R Space mean speed in outer lanes, S = 68.8 mph 0 Space mean speed for all vehicles, S = 58.2 mph
177 HCS 2010: Freeway Merge and Diverge Segments Release 6.70 Phone: Fax: Merge Analysis Analyst: Makinzie Clark Agency/Co.: Omni-Means Date performed: 6/8/2016 Analysis time period: PM Peak Hour Freeway/Dir of Travel: I-80 Eastbound Junction: Sierra College Blvd On Loop Jurisdiction: Caltrans Analysis Year: Existing Description: Sierra Gateway Apartments TIS Freeway Data Type of analysis Merge Number of lanes in freeway 3 Free-flow speed on freeway 65.0 mph Volume on freeway 3684 vph On Ramp Data Side of freeway Right Number of lanes in ramp 1 Free-flow speed on ramp 25.0 mph Volume on ramp 343 vph Length of first accel/decel lane 800 ft Length of second accel/decel lane ft Adjacent Ramp Data (if one exists) Does adjacent ramp exist? Yes Volume on adjacent Ramp 748 vph Position of adjacent Ramp Downstream Type of adjacent Ramp On Distance to adjacent Ramp 1420 ft Conversion to pc/h Under Base Conditions Junction Components Freeway Ramp Adjacent Ramp Volume, V (vph) vph Peak-hour factor, PHF Peak 15-min volume, v v Trucks and buses % Recreational vehicles % Terrain type: Level Level Level Grade % % % Length mi mi mi Trucks and buses PCE, ET Recreational vehicle PCE, ER
178 Heavy vehicle adjustment, fhv Driver population factor, fp Flow rate, vp pcph Estimation of V12 Merge Areas L = (Equation 13-6 or 13-7) EQ P = Using Equation 3 FM v = v (P ) = 2511 pc/h 12 F FM Capacity Checks Actual Maximum LOS F? v No FO v or v 1674 pc/h (Equation or 13-17) Is v or v > 2700 pc/h? No Is v or v > 1.5 v /2 Yes 12 If yes, v = 2511 (Equation 13-15, 13-16, 13-18, or 13-19) 12A Flow Entering Merge Influence Area Actual Max Desirable Violation? v No 12A Level of Service Determination (if not F) Density, D = v v L = 22.7 pc/mi/ln R R 12 A Level of service for ramp-freeway junction areas of influence C Speed Estimation Intermediate speed variable, M = S Space mean speed in ramp influence area, S = 56.9 mph R Space mean speed in outer lanes, S = 60.8 mph 0 Space mean speed for all vehicles, S = 58.3 mph
179 HCS 2010: Freeway Merge and Diverge Segments Release 6.70 Phone: Fax: Merge Analysis Analyst: Makinzie Clark Agency/Co.: Omni-Means Date performed: 6/8/2016 Analysis time period: PM Peak Hour Freeway/Dir of Travel: I-80 Eastbound Junction: Sierra College Blvd On Ramp Jurisdiction: Caltrans Analysis Year: Existing Description: Sierra Gateway Apartments TIS Freeway Data Type of analysis Merge Number of lanes in freeway 3 Free-flow speed on freeway 65.0 mph Volume on freeway 4027 vph On Ramp Data Side of freeway Right Number of lanes in ramp 1 Free-flow speed on ramp 35.0 mph Volume on ramp 748 vph Length of first accel/decel lane 700 ft Length of second accel/decel lane ft Adjacent Ramp Data (if one exists) Does adjacent ramp exist? Yes Volume on adjacent Ramp 343 vph Position of adjacent Ramp Upstream Type of adjacent Ramp On Distance to adjacent Ramp 1420 ft Conversion to pc/h Under Base Conditions Junction Components Freeway Ramp Adjacent Ramp Volume, V (vph) vph Peak-hour factor, PHF Peak 15-min volume, v v Trucks and buses % Recreational vehicles % Terrain type: Level Level Level Grade % % % Length mi mi mi Trucks and buses PCE, ET Recreational vehicle PCE, ER
180 Heavy vehicle adjustment, fhv Driver population factor, fp Flow rate, vp pcph Estimation of V12 Merge Areas L = (Equation 13-6 or 13-7) EQ P = Using Equation 3 FM v = v (P ) = 2731 pc/h 12 F FM Capacity Checks Actual Maximum LOS F? v No FO v or v 1843 pc/h (Equation or 13-17) Is v or v > 2700 pc/h? No Is v or v > 1.5 v /2 Yes 12 If yes, v = 2731 (Equation 13-15, 13-16, 13-18, or 13-19) 12A Flow Entering Merge Influence Area Actual Max Desirable Violation? v No 12A Level of Service Determination (if not F) Density, D = v v L = 28.3 pc/mi/ln R R 12 A Level of service for ramp-freeway junction areas of influence D Speed Estimation Intermediate speed variable, M = S Space mean speed in ramp influence area, S = 55.7 mph R Space mean speed in outer lanes, S = 60.2 mph 0 Space mean speed for all vehicles, S = 57.1 mph
181 HCS 2010: Basic Freeway Segments Release 6.70 Phone: Fax: Operational Analysis Analyst: Makinzie Clark Agency or Company: Omni-Means Date Performed: 6/8/2016 Analysis Time Period: PM Peak Hour Freeway/Direction: I-80 Eastbound From/To: North of Sierra College Blvd Jurisdiction: Caltrans Analysis Year: Existing Description: Sierra Gateway Apartments TIS Flow Inputs and Adjustments Volume, V 4775 veh/h Peak-hour factor, PHF 0.92 Peak 15-min volume, v v Trucks and buses 9 % Recreational vehicles 0 % Terrain type: Level Grade - % Segment length - mi Trucks and buses PCE, ET 1.5 Recreational vehicle PCE, ER 1.2 Heavy vehicle adjustment, fhv Driver population factor, fp 1.00 Flow rate, vp 1808 pc/h/ln Speed Inputs and Adjustments Lane width - ft Right-side lateral clearance - ft Total ramp density, TRD - ramps/mi Number of lanes, N 3 Free-flow speed: Measured FFS or BFFS 65.0 mi/h Lane width adjustment, flw - mi/h Lateral clearance adjustment, flc - mi/h TRD adjustment - mi/h Free-flow speed, FFS 65.0 mi/h LOS and Performance Measures Flow rate, vp 1808 pc/h/ln Free-flow speed, FFS 65.0 mi/h Average passenger-car speed, S 62.6 mi/h Number of lanes, N 3 Density, D 28.9 pc/mi/ln Level of service, LOS D
182 HCS 2010: Basic Freeway Segments Release 6.70 Phone: Fax: Operational Analysis Analyst: Makinzie Clark Agency or Company: Omni-Means Date Performed: 6/8/2016 Analysis Time Period: PM Peak Hour Freeway/Direction: I-80 Westbound From/To: North of Sierra College Blvd Jurisdiction: Caltrans Analysis Year: Existing Description: Sierra Gateway Apartments TIS Flow Inputs and Adjustments Volume, V 3544 veh/h Peak-hour factor, PHF 0.92 Peak 15-min volume, v v Trucks and buses 9 % Recreational vehicles 0 % Terrain type: Level Grade - % Segment length - mi Trucks and buses PCE, ET 1.5 Recreational vehicle PCE, ER 1.2 Heavy vehicle adjustment, fhv Driver population factor, fp 1.00 Flow rate, vp 1342 pc/h/ln Speed Inputs and Adjustments Lane width - ft Right-side lateral clearance - ft Total ramp density, TRD - ramps/mi Number of lanes, N 3 Free-flow speed: Measured FFS or BFFS 65.0 mi/h Lane width adjustment, flw - mi/h Lateral clearance adjustment, flc - mi/h TRD adjustment - mi/h Free-flow speed, FFS 65.0 mi/h LOS and Performance Measures Flow rate, vp 1342 pc/h/ln Free-flow speed, FFS 65.0 mi/h Average passenger-car speed, S 65.0 mi/h Number of lanes, N 3 Density, D 20.6 pc/mi/ln Level of service, LOS C
183 HCS 2010: Freeway Merge and Diverge Segments Release 6.70 Phone: Fax: Diverge Analysis Analyst: Makinzie Clark Agency/Co.: Omni-Means Date performed: 6/8/2016 Analysis time period: PM Peak Hour Freeway/Dir of Travel: I-80 Westbound Junction: Sierra College Blvd Off Ramp Jurisdiction: Caltrans Analysis Year: Existing Description: Sierra Gateway Apartments TIS Freeway Data Type of analysis Diverge Number of lanes in freeway 3 Free-flow speed on freeway 65.0 mph Volume on freeway 3544 vph Off Ramp Data Side of freeway Right Number of lanes in ramp 1 Free-Flow speed on ramp 35.0 mph Volume on ramp 724 vph Length of first accel/decel lane 650 ft Length of second accel/decel lane ft Adjacent Ramp Data (if one exists) Does adjacent ramp exist? Yes Volume on adjacent ramp 234 vph Position of adjacent ramp Downstream Type of adjacent ramp On Distance to adjacent ramp 1650 ft Conversion to pc/h Under Base Conditions Junction Components Freeway Ramp Adjacent Ramp Volume, V (vph) vph Peak-hour factor, PHF Peak 15-min volume, v v Trucks and buses % Recreational vehicles % Terrain type: Level Level Level Grade 0.00 % 0.00 % 0.00 % Length 0.00 mi 0.00 mi 0.00 mi Trucks and buses PCE, ET Recreational vehicle PCE, ER
184 Heavy vehicle adjustment, fhv Driver population factor, fp Flow rate, vp pcph Estimation of V12 Diverge Areas L = (Equation or 13-13) EQ P = Using Equation 9 FD v = v + (v - v ) P = 2802 pc/h 12 R F R FD Capacity Checks Actual Maximum LOS F? v = v No Fi F v = v - v No FO F R v No R v or v 1224 pc/h (Equation or 13-17) Is v or v > 2700 pc/h? No Is v or v > 1.5 v /2 No 12 If yes, v = 2802 (Equation 13-15, 13-16, 13-18, or 13-19) 12A Flow Entering Diverge Influence Area Actual Max Desirable Violation? v No 12 Level of Service Determination (if not F) Density, D = v L = 22.5 pc/mi/ln R 12 D Level of service for ramp-freeway junction areas of influence C Speed Estimation Intermediate speed variable, D = S Space mean speed in ramp influence area, S = 53.6 mph R Space mean speed in outer lanes, S = 70.4 mph 0 Space mean speed for all vehicles, S = 57.8 mph
185 HCS 2010: Freeway Merge and Diverge Segments Release 6.70 Phone: Fax: Merge Analysis Analyst: Makinzie Clark Agency/Co.: Omni-Means Date performed: 6/8/2016 Analysis time period: PM Peak Hour Freeway/Dir of Travel: I-80 Westbound Junction: Sierra College Blvd On Loop Jurisdiction: Caltrans Analysis Year: Existing Description: Sierra Gateway Apartments TIS Freeway Data Type of analysis Merge Number of lanes in freeway 3 Free-flow speed on freeway 65.0 mph Volume on freeway 2820 vph On Ramp Data Side of freeway Right Number of lanes in ramp 1 Free-flow speed on ramp 25.0 mph Volume on ramp 234 vph Length of first accel/decel lane 700 ft Length of second accel/decel lane ft Adjacent Ramp Data (if one exists) Does adjacent ramp exist? Yes Volume on adjacent Ramp 382 vph Position of adjacent Ramp Downstream Type of adjacent Ramp On Distance to adjacent Ramp 1560 ft Conversion to pc/h Under Base Conditions Junction Components Freeway Ramp Adjacent Ramp Volume, V (vph) vph Peak-hour factor, PHF Peak 15-min volume, v v Trucks and buses % Recreational vehicles % Terrain type: Level Level Level Grade % % % Length mi mi mi Trucks and buses PCE, ET Recreational vehicle PCE, ER
186 Heavy vehicle adjustment, fhv Driver population factor, fp Flow rate, vp pcph Estimation of V12 Merge Areas L = (Equation 13-6 or 13-7) EQ P = Using Equation 3 FM v = v (P ) = 1913 pc/h 12 F FM Capacity Checks Actual Maximum LOS F? v No FO v or v 1290 pc/h (Equation or 13-17) Is v or v > 2700 pc/h? No Is v or v > 1.5 v /2 Yes 12 If yes, v = 1913 (Equation 13-15, 13-16, 13-18, or 13-19) 12A Flow Entering Merge Influence Area Actual Max Desirable Violation? v No 12A Level of Service Determination (if not F) Density, D = v v L = 17.8 pc/mi/ln R R 12 A Level of service for ramp-freeway junction areas of influence B Speed Estimation Intermediate speed variable, M = S Space mean speed in ramp influence area, S = 57.6 mph R Space mean speed in outer lanes, S = 62.2 mph 0 Space mean speed for all vehicles, S = 59.2 mph
187 HCS 2010: Freeway Merge and Diverge Segments Release 6.70 Phone: Fax: Merge Analysis Analyst: Makinzie Clark Agency/Co.: Omni-Means Date performed: 6/8/2016 Analysis time period: PM Peak Hour Freeway/Dir of Travel: I-80 Westbound Junction: Sierra Collge Blvd On Ramp Jurisdiction: Caltrans Analysis Year: Existing Description: Sierra Gateway Apartments TIS Freeway Data Type of analysis Merge Number of lanes in freeway 3 Free-flow speed on freeway 65.0 mph Volume on freeway 3054 vph On Ramp Data Side of freeway Right Number of lanes in ramp 1 Free-flow speed on ramp 35.0 mph Volume on ramp 382 vph Length of first accel/decel lane 700 ft Length of second accel/decel lane ft Adjacent Ramp Data (if one exists) Does adjacent ramp exist? Yes Volume on adjacent Ramp 234 vph Position of adjacent Ramp Upstream Type of adjacent Ramp On Distance to adjacent Ramp 1560 ft Conversion to pc/h Under Base Conditions Junction Components Freeway Ramp Adjacent Ramp Volume, V (vph) vph Peak-hour factor, PHF Peak 15-min volume, v v Trucks and buses % Recreational vehicles % Terrain type: Level Level Level Grade % % % Length mi mi mi Trucks and buses PCE, ET Recreational vehicle PCE, ER
188 Heavy vehicle adjustment, fhv Driver population factor, fp Flow rate, vp pcph Estimation of V12 Merge Areas L = (Equation 13-6 or 13-7) EQ P = Using Equation 3 FM v = v (P ) = 2071 pc/h 12 F FM Capacity Checks Actual Maximum LOS F? v No FO v or v 1398 pc/h (Equation or 13-17) Is v or v > 2700 pc/h? No Is v or v > 1.5 v /2 Yes 12 If yes, v = 2071 (Equation 13-15, 13-16, 13-18, or 13-19) 12A Flow Entering Merge Influence Area Actual Max Desirable Violation? v No 12A Level of Service Determination (if not F) Density, D = v v L = 20.2 pc/mi/ln R R 12 A Level of service for ramp-freeway junction areas of influence C Speed Estimation Intermediate speed variable, M = S Space mean speed in ramp influence area, S = 57.7 mph R Space mean speed in outer lanes, S = 61.8 mph 0 Space mean speed for all vehicles, S = 59.1 mph
189 HCS 2010: Basic Freeway Segments Release 6.70 Phone: Fax: Operational Analysis Analyst: Makinzie Clark Agency or Company: Omni-Means Date Performed: 6/8/2016 Analysis Time Period: PM Peak Hour Freeway/Direction: I-80 Westbound From/To: Sierra College Blvd/Rocklin Rd Jurisdiction: Caltrans Analysis Year: Existing Description: Sierra Gateway Apartments TIS Flow Inputs and Adjustments Volume, V 3436 veh/h Peak-hour factor, PHF 0.92 Peak 15-min volume, v v Trucks and buses 9 % Recreational vehicles 0 % Terrain type: Level Grade - % Segment length - mi Trucks and buses PCE, ET 1.5 Recreational vehicle PCE, ER 1.2 Heavy vehicle adjustment, fhv Driver population factor, fp 1.00 Flow rate, vp 1301 pc/h/ln Speed Inputs and Adjustments Lane width - ft Right-side lateral clearance - ft Total ramp density, TRD - ramps/mi Number of lanes, N 3 Free-flow speed: Measured FFS or BFFS 65.0 mi/h Lane width adjustment, flw - mi/h Lateral clearance adjustment, flc - mi/h TRD adjustment - mi/h Free-flow speed, FFS 65.0 mi/h LOS and Performance Measures Flow rate, vp 1301 pc/h/ln Free-flow speed, FFS 65.0 mi/h Average passenger-car speed, S 65.0 mi/h Number of lanes, N 3 Density, D 20.0 pc/mi/ln Level of service, LOS C
190 HCS 2010: Basic Freeway Segments Release 6.70 Phone: Fax: Operational Analysis Analyst: Makinzie Clark Agency or Company: Omni-Means Date Performed: 6/8/2016 Analysis Time Period: AM Peak Hour Freeway/Direction: I-80 Eastbound From/To: South of Rocklin Road Jurisdiction: Caltrans Analysis Year: Existing+Project Description: Sierra Gateway Apartments TIS Flow Inputs and Adjustments Volume, V 4017 veh/h Peak-hour factor, PHF 0.92 Peak 15-min volume, v v Trucks and buses 9 % Recreational vehicles 0 % Terrain type: Level Grade - % Segment length - mi Trucks and buses PCE, ET 1.5 Recreational vehicle PCE, ER 1.2 Heavy vehicle adjustment, fhv Driver population factor, fp 1.00 Flow rate, vp 1521 pc/h/ln Speed Inputs and Adjustments Lane width - ft Right-side lateral clearance - ft Total ramp density, TRD - ramps/mi Number of lanes, N 3 Free-flow speed: Measured FFS or BFFS 65.0 mi/h Lane width adjustment, flw - mi/h Lateral clearance adjustment, flc - mi/h TRD adjustment - mi/h Free-flow speed, FFS 65.0 mi/h LOS and Performance Measures Flow rate, vp 1521 pc/h/ln Free-flow speed, FFS 65.0 mi/h Average passenger-car speed, S 64.8 mi/h Number of lanes, N 3 Density, D 23.5 pc/mi/ln Level of service, LOS C
191 HCS 2010: Freeway Merge and Diverge Segments Release 6.70 Phone: Fax: Diverge Analysis Analyst: Makinzie Clark Agency/Co.: Omni-Means Date performed: 6/8/2016 Analysis time period: AM Peak Hour Freeway/Dir of Travel: I-80 Eastbound Junction: Rocklin Road Off Ramp Jurisdiction: Caltrans Analysis Year: Existing+Project Description: Sierra Gateway Apartments TIS Freeway Data Type of analysis Diverge Number of lanes in freeway 3 Free-flow speed on freeway 65.0 mph Volume on freeway 4017 vph Off Ramp Data Side of freeway Right Number of lanes in ramp 1 Free-Flow speed on ramp 35.0 mph Volume on ramp 1435 vph Length of first accel/decel lane 1050 ft Length of second accel/decel lane ft Adjacent Ramp Data (if one exists) Does adjacent ramp exist? Volume on adjacent ramp Position of adjacent ramp Type of adjacent ramp Distance to adjacent ramp No vph ft Conversion to pc/h Under Base Conditions Junction Components Freeway Ramp Adjacent Ramp Volume, V (vph) vph Peak-hour factor, PHF Peak 15-min volume, v v Trucks and buses 9 3 % Recreational vehicles 0 0 % Terrain type: Level Level Grade 0.00 % 0.00 % % Length 0.00 mi 0.00 mi mi Trucks and buses PCE, ET Recreational vehicle PCE, ER
192 Heavy vehicle adjustment, fhv Driver population factor, fp Flow rate, vp pcph Estimation of V12 Diverge Areas L = (Equation or 13-13) EQ P = Using Equation 9 FD v = v + (v - v ) P = 3281 pc/h 12 R F R FD Capacity Checks Actual Maximum LOS F? v = v No Fi F v = v - v No FO F R v No R v or v 1282 pc/h (Equation or 13-17) Is v or v > 2700 pc/h? No Is v or v > 1.5 v /2 No 12 If yes, v = 3281 (Equation 13-15, 13-16, 13-18, or 13-19) 12A Flow Entering Diverge Influence Area Actual Max Desirable Violation? v No 12 Level of Service Determination (if not F) Density, D = v L = 23.0 pc/mi/ln R 12 D Level of service for ramp-freeway junction areas of influence C Speed Estimation Intermediate speed variable, D = S Space mean speed in ramp influence area, S = 51.9 mph R Space mean speed in outer lanes, S = 70.2 mph 0 Space mean speed for all vehicles, S = 56.0 mph
193 HCS 2010: Freeway Merge and Diverge Segments Release 6.70 Phone: Fax: Merge Analysis Analyst: Makinzie Clark Agency/Co.: Omni-Means Date performed: 6/8/2016 Analysis time period: AM Peak Hour Freeway/Dir of Travel: I-80 Eastbound Junction: Rocklin Road On Ramp Jurisdiction: Caltrans Analysis Year: Existing+Project Description: Sierra Gateway Apartments TIS Freeway Data Type of analysis Merge Number of lanes in freeway 3 Free-flow speed on freeway 65.0 mph Volume on freeway 2582 vph On Ramp Data Side of freeway Right Number of lanes in ramp 1 Free-flow speed on ramp 35.0 mph Volume on ramp 213 vph Length of first accel/decel lane 360 ft Length of second accel/decel lane ft Adjacent Ramp Data (if one exists) Does adjacent ramp exist? Volume on adjacent Ramp Position of adjacent Ramp Type of adjacent Ramp Distance to adjacent Ramp No vph ft Conversion to pc/h Under Base Conditions Junction Components Freeway Ramp Adjacent Ramp Volume, V (vph) vph Peak-hour factor, PHF Peak 15-min volume, v v Trucks and buses 9 3 % Recreational vehicles 0 0 % Terrain type: Level Level Grade % % % Length mi mi mi Trucks and buses PCE, ET Recreational vehicle PCE, ER
194 Heavy vehicle adjustment, fhv Driver population factor, fp Flow rate, vp pcph Estimation of V12 Merge Areas L = (Equation 13-6 or 13-7) EQ P = Using Equation 3 FM v = v (P ) = 1723 pc/h 12 F FM Capacity Checks Actual Maximum LOS F? v No FO v or v 1210 pc/h (Equation or 13-17) Is v or v > 2700 pc/h? No Is v or v > 1.5 v /2 Yes 12 If yes, v = 1723 (Equation 13-15, 13-16, 13-18, or 13-19) 12A Flow Entering Merge Influence Area Actual Max Desirable Violation? v No 12A Level of Service Determination (if not F) Density, D = v v L = 18.3 pc/mi/ln R R 12 A Level of service for ramp-freeway junction areas of influence B Speed Estimation Intermediate speed variable, M = S Space mean speed in ramp influence area, S = 57.6 mph R Space mean speed in outer lanes, S = 62.4 mph 0 Space mean speed for all vehicles, S = 59.3 mph
195 HCS 2010: Freeway Merge and Diverge Segments Release 6.70 Phone: Fax: Diverge Analysis Analyst: Makinzie Clark Agency/Co.: Omni-Means Date performed: 6/8/2016 Analysis time period: AM Peak Hour Freeway/Dir of Travel: I-80 Westbound Junction: Rocklin Road Off Ramp Jurisdiction: Caltrans Analysis Year: Existing+Project Description: Sierra Gateway Apartments TIS Freeway Data Type of analysis Diverge Number of lanes in freeway 3 Free-flow speed on freeway 65.0 mph Volume on freeway 4012 vph Off Ramp Data Side of freeway Right Number of lanes in ramp 1 Free-Flow speed on ramp 35.0 mph Volume on ramp 283 vph Length of first accel/decel lane 150 ft Length of second accel/decel lane ft Adjacent Ramp Data (if one exists) Does adjacent ramp exist? Volume on adjacent ramp Position of adjacent ramp Type of adjacent ramp Distance to adjacent ramp No vph ft Conversion to pc/h Under Base Conditions Junction Components Freeway Ramp Adjacent Ramp Volume, V (vph) vph Peak-hour factor, PHF Peak 15-min volume, v v Trucks and buses 9 3 % Recreational vehicles 0 0 % Terrain type: Level Level Grade 0.00 % 0.00 % % Length 0.00 mi 0.00 mi mi Trucks and buses PCE, ET Recreational vehicle PCE, ER
196 Heavy vehicle adjustment, fhv Driver population factor, fp Flow rate, vp pcph Estimation of V12 Diverge Areas L = (Equation or 13-13) EQ P = Using Equation 9 FD v = v + (v - v ) P = 2993 pc/h 12 R F R FD Capacity Checks Actual Maximum LOS F? v = v No Fi F v = v - v No FO F R v No R v or v 1564 pc/h (Equation or 13-17) Is v or v > 2700 pc/h? No Is v or v > 1.5 v /2 No 12 If yes, v = 2993 (Equation 13-15, 13-16, 13-18, or 13-19) 12A Flow Entering Diverge Influence Area Actual Max Desirable Violation? v No 12 Level of Service Determination (if not F) Density, D = v L = 28.6 pc/mi/ln R 12 D Level of service for ramp-freeway junction areas of influence D Speed Estimation Intermediate speed variable, D = S Space mean speed in ramp influence area, S = 54.5 mph R Space mean speed in outer lanes, S = 69.1 mph 0 Space mean speed for all vehicles, S = 58.8 mph
197 HCS 2010: Freeway Merge and Diverge Segments Release 6.70 Phone: Fax: Merge Analysis Analyst: Makinzie Clark Agency/Co.: Omni-Means Date performed: 6/8/2016 Analysis time period: AM Peak Hour Freeway/Dir of Travel: I-80 Westbound Junction: Rocklin Road On Ramp Jurisdiction: Caltrans Analysis Year: Existing+Project Description: Sierra Gateway Apartments TIS Freeway Data Type of analysis Merge Number of lanes in freeway 3 Free-flow speed on freeway 65.0 mph Volume on freeway 3729 vph On Ramp Data Side of freeway Right Number of lanes in ramp 1 Free-flow speed on ramp 35.0 mph Volume on ramp 789 vph Length of first accel/decel lane 750 ft Length of second accel/decel lane ft Adjacent Ramp Data (if one exists) Does adjacent ramp exist? Volume on adjacent Ramp Position of adjacent Ramp Type of adjacent Ramp Distance to adjacent Ramp No vph ft Conversion to pc/h Under Base Conditions Junction Components Freeway Ramp Adjacent Ramp Volume, V (vph) vph Peak-hour factor, PHF Peak 15-min volume, v v Trucks and buses 9 3 % Recreational vehicles 0 0 % Terrain type: Level Level Grade % % % Length mi mi mi Trucks and buses PCE, ET Recreational vehicle PCE, ER
198 Heavy vehicle adjustment, fhv Driver population factor, fp Flow rate, vp pcph Estimation of V12 Merge Areas L = (Equation 13-6 or 13-7) EQ P = Using Equation 3 FM v = v (P ) = 2535 pc/h 12 F FM Capacity Checks Actual Maximum LOS F? v No FO v or v 1701 pc/h (Equation or 13-17) Is v or v > 2700 pc/h? No Is v or v > 1.5 v /2 Yes 12 If yes, v = 2535 (Equation 13-15, 13-16, 13-18, or 13-19) 12A Flow Entering Merge Influence Area Actual Max Desirable Violation? v No 12A Level of Service Determination (if not F) Density, D = v v L = 26.8 pc/mi/ln R R 12 A Level of service for ramp-freeway junction areas of influence C Speed Estimation Intermediate speed variable, M = S Space mean speed in ramp influence area, S = 56.2 mph R Space mean speed in outer lanes, S = 60.7 mph 0 Space mean speed for all vehicles, S = 57.6 mph
199 HCS 2010: Basic Freeway Segments Release 6.70 Phone: Fax: Operational Analysis Analyst: Makinzie Clark Agency or Company: Omni-Means Date Performed: 6/8/2016 Analysis Time Period: AM Peak Hour Freeway/Direction: I-80 Westbound From/To: South of Rocklin Road Jurisdiction: Caltrans Analysis Year: Existing+Project Description: Sierra Gateway Apartments TIS Flow Inputs and Adjustments Volume, V 4518 veh/h Peak-hour factor, PHF 0.92 Peak 15-min volume, v v Trucks and buses 9 % Recreational vehicles 0 % Terrain type: Level Grade - % Segment length - mi Trucks and buses PCE, ET 1.5 Recreational vehicle PCE, ER 1.2 Heavy vehicle adjustment, fhv Driver population factor, fp 1.00 Flow rate, vp 1711 pc/h/ln Speed Inputs and Adjustments Lane width - ft Right-side lateral clearance - ft Total ramp density, TRD - ramps/mi Number of lanes, N 3 Free-flow speed: Measured FFS or BFFS 65.0 mi/h Lane width adjustment, flw - mi/h Lateral clearance adjustment, flc - mi/h TRD adjustment - mi/h Free-flow speed, FFS 65.0 mi/h LOS and Performance Measures Flow rate, vp 1711 pc/h/ln Free-flow speed, FFS 65.0 mi/h Average passenger-car speed, S 63.6 mi/h Number of lanes, N 3 Density, D 26.9 pc/mi/ln Level of service, LOS D
200 HCS 2010: Basic Freeway Segments Release 6.70 Phone: Fax: Operational Analysis Analyst: Makinzie Clark Agency or Company: Omni-Means Date Performed: 6/8/2016 Analysis Time Period: AM Peak Hour Freeway/Direction: I-80 Eastbound From/To: Rocklin Rd/Sierra College Blvd Jurisdiction: Caltrans Analysis Year: Existing+Project Description: Sierra Gateway Apartments TIS Flow Inputs and Adjustments Volume, V 2795 veh/h Peak-hour factor, PHF 0.92 Peak 15-min volume, v v Trucks and buses 9 % Recreational vehicles 0 % Terrain type: Level Grade - % Segment length - mi Trucks and buses PCE, ET 1.5 Recreational vehicle PCE, ER 1.2 Heavy vehicle adjustment, fhv Driver population factor, fp 1.00 Flow rate, vp 1058 pc/h/ln Speed Inputs and Adjustments Lane width - ft Right-side lateral clearance - ft Total ramp density, TRD - ramps/mi Number of lanes, N 3 Free-flow speed: Measured FFS or BFFS 65.0 mi/h Lane width adjustment, flw - mi/h Lateral clearance adjustment, flc - mi/h TRD adjustment - mi/h Free-flow speed, FFS 65.0 mi/h LOS and Performance Measures Flow rate, vp 1058 pc/h/ln Free-flow speed, FFS 65.0 mi/h Average passenger-car speed, S 65.0 mi/h Number of lanes, N 3 Density, D 16.3 pc/mi/ln Level of service, LOS B
201 HCS 2010: Freeway Merge and Diverge Segments Release 6.70 Phone: Fax: Diverge Analysis Analyst: Makinzie Clark Agency/Co.: Omni-Means Date performed: 6/8/2016 Analysis time period: AM Peak Hour Freeway/Dir of Travel: I-80 Eastound Junction: Sierra College Blvd Off Ramp Jurisdiction: Caltrans Analysis Year: Existing+Project Description: Sierra Gateway Apartments TIS Freeway Data Type of analysis Diverge Number of lanes in freeway 3 Free-flow speed on freeway 65.0 mph Volume on freeway 2795 vph Off Ramp Data Side of freeway Right Number of lanes in ramp 1 Free-Flow speed on ramp 35.0 mph Volume on ramp 540 vph Length of first accel/decel lane 150 ft Length of second accel/decel lane ft Adjacent Ramp Data (if one exists) Does adjacent ramp exist? Yes Volume on adjacent ramp 183 vph Position of adjacent ramp Downstream Type of adjacent ramp On Distance to adjacent ramp 1560 ft Conversion to pc/h Under Base Conditions Junction Components Freeway Ramp Adjacent Ramp Volume, V (vph) vph Peak-hour factor, PHF Peak 15-min volume, v v Trucks and buses % Recreational vehicles % Terrain type: Level Level Level Grade 0.00 % 0.00 % 0.00 % Length 0.00 mi 0.00 mi 0.00 mi Trucks and buses PCE, ET Recreational vehicle PCE, ER
202 Heavy vehicle adjustment, fhv Driver population factor, fp Flow rate, vp pcph Estimation of V12 Diverge Areas L = (Equation or 13-13) EQ P = Using Equation 9 FD v = v + (v - v ) P = 2286 pc/h 12 R F R FD Capacity Checks Actual Maximum LOS F? v = v No Fi F v = v - v No FO F R v No R v or v 889 pc/h (Equation or 13-17) Is v or v > 2700 pc/h? No Is v or v > 1.5 v /2 No 12 If yes, v = 2286 (Equation 13-15, 13-16, 13-18, or 13-19) 12A Flow Entering Diverge Influence Area Actual Max Desirable Violation? v No 12 Level of Service Determination (if not F) Density, D = v L = 22.6 pc/mi/ln R 12 D Level of service for ramp-freeway junction areas of influence C Speed Estimation Intermediate speed variable, D = S Space mean speed in ramp influence area, S = 53.9 mph R Space mean speed in outer lanes, S = 71.3 mph 0 Space mean speed for all vehicles, S = 57.8 mph
203 HCS 2010: Freeway Merge and Diverge Segments Release 6.70 Phone: Fax: Merge Analysis Analyst: Makinzie Clark Agency/Co.: Omni-Means Date performed: 6/8/2016 Analysis time period: AM Peak Hour Freeway/Dir of Travel: I-80 Eastbound Junction: Sierra College Blvd On Loop Jurisdiction: Caltrans Analysis Year: Existing+Project Description: Sierra Gateway Apartments TIS Freeway Data Type of analysis Merge Number of lanes in freeway 3 Free-flow speed on freeway 65.0 mph Volume on freeway 2255 vph On Ramp Data Side of freeway Right Number of lanes in ramp 1 Free-flow speed on ramp 25.0 mph Volume on ramp 183 vph Length of first accel/decel lane 800 ft Length of second accel/decel lane ft Adjacent Ramp Data (if one exists) Does adjacent ramp exist? Yes Volume on adjacent Ramp 414 vph Position of adjacent Ramp Downstream Type of adjacent Ramp On Distance to adjacent Ramp 1420 ft Conversion to pc/h Under Base Conditions Junction Components Freeway Ramp Adjacent Ramp Volume, V (vph) vph Peak-hour factor, PHF Peak 15-min volume, v v Trucks and buses % Recreational vehicles % Terrain type: Level Level Level Grade % % % Length mi mi mi Trucks and buses PCE, ET Recreational vehicle PCE, ER
204 Heavy vehicle adjustment, fhv Driver population factor, fp Flow rate, vp pcph Estimation of V12 Merge Areas L = (Equation 13-6 or 13-7) EQ P = Using Equation 3 FM v = v (P ) = 1536 pc/h 12 F FM Capacity Checks Actual Maximum LOS F? v No FO v or v 1025 pc/h (Equation or 13-17) Is v or v > 2700 pc/h? No Is v or v > 1.5 v /2 Yes 12 If yes, v = 1536 (Equation 13-15, 13-16, 13-18, or 13-19) 12A Flow Entering Merge Influence Area Actual Max Desirable Violation? v No 12A Level of Service Determination (if not F) Density, D = v v L = 14.0 pc/mi/ln R R 12 A Level of service for ramp-freeway junction areas of influence B Speed Estimation Intermediate speed variable, M = S Space mean speed in ramp influence area, S = 58.0 mph R Space mean speed in outer lanes, S = 63.1 mph 0 Space mean speed for all vehicles, S = 59.8 mph
205 HCS 2010: Freeway Merge and Diverge Segments Release 6.70 Phone: Fax: Merge Analysis Analyst: Makinzie Clark Agency/Co.: Omni-Means Date performed: 6/8/2016 Analysis time period: AM Peak Hour Freeway/Dir of Travel: I-80 Eastbound Junction: Sierra College Blvd On Ramp Jurisdiction: Caltrans Analysis Year: Existing+Project Description: Sierra Gateway Apartments TIS Freeway Data Type of analysis Merge Number of lanes in freeway 3 Free-flow speed on freeway 65.0 mph Volume on freeway 2438 vph On Ramp Data Side of freeway Right Number of lanes in ramp 1 Free-flow speed on ramp 35.0 mph Volume on ramp 414 vph Length of first accel/decel lane 700 ft Length of second accel/decel lane ft Adjacent Ramp Data (if one exists) Does adjacent ramp exist? Yes Volume on adjacent Ramp 183 vph Position of adjacent Ramp Upstream Type of adjacent Ramp On Distance to adjacent Ramp 1420 ft Conversion to pc/h Under Base Conditions Junction Components Freeway Ramp Adjacent Ramp Volume, V (vph) vph Peak-hour factor, PHF Peak 15-min volume, v v Trucks and buses % Recreational vehicles % Terrain type: Level Level Level Grade % % % Length mi mi mi Trucks and buses PCE, ET Recreational vehicle PCE, ER
206 Heavy vehicle adjustment, fhv Driver population factor, fp Flow rate, vp pcph Estimation of V12 Merge Areas L = (Equation 13-6 or 13-7) EQ P = Using Equation 3 FM v = v (P ) = 1653 pc/h 12 F FM Capacity Checks Actual Maximum LOS F? v No FO v or v 1116 pc/h (Equation or 13-17) Is v or v > 2700 pc/h? No Is v or v > 1.5 v /2 Yes 12 If yes, v = 1653 (Equation 13-15, 13-16, 13-18, or 13-19) 12A Flow Entering Merge Influence Area Actual Max Desirable Violation? v No 12A Level of Service Determination (if not F) Density, D = v v L = 17.5 pc/mi/ln R R 12 A Level of service for ramp-freeway junction areas of influence B Speed Estimation Intermediate speed variable, M = S Space mean speed in ramp influence area, S = 58.0 mph R Space mean speed in outer lanes, S = 62.8 mph 0 Space mean speed for all vehicles, S = 59.6 mph
207 HCS 2010: Basic Freeway Segments Release 6.70 Phone: Fax: Operational Analysis Analyst: Makinzie Clark Agency or Company: Omni-Means Date Performed: 6/8/2016 Analysis Time Period: AM Peak Hour Freeway/Direction: I-80 Eastbound From/To: North of Sierra College Blvd Jurisdiction: Caltrans Analysis Year: Existing+Project Description: Sierra Gateway Apartments TIS Flow Inputs and Adjustments Volume, V 2852 veh/h Peak-hour factor, PHF 0.92 Peak 15-min volume, v v Trucks and buses 9 % Recreational vehicles 0 % Terrain type: Level Grade - % Segment length - mi Trucks and buses PCE, ET 1.5 Recreational vehicle PCE, ER 1.2 Heavy vehicle adjustment, fhv Driver population factor, fp 1.00 Flow rate, vp 1080 pc/h/ln Speed Inputs and Adjustments Lane width - ft Right-side lateral clearance - ft Total ramp density, TRD - ramps/mi Number of lanes, N 3 Free-flow speed: Measured FFS or BFFS 65.0 mi/h Lane width adjustment, flw - mi/h Lateral clearance adjustment, flc - mi/h TRD adjustment - mi/h Free-flow speed, FFS 65.0 mi/h LOS and Performance Measures Flow rate, vp 1080 pc/h/ln Free-flow speed, FFS 65.0 mi/h Average passenger-car speed, S 65.0 mi/h Number of lanes, N 3 Density, D 16.6 pc/mi/ln Level of service, LOS B
208 HCS 2010: Basic Freeway Segments Release 6.70 Phone: Fax: Operational Analysis Analyst: Makinzie Clark Agency or Company: Omni-Means Date Performed: 6/8/2016 Analysis Time Period: AM Peak Hour Freeway/Direction: I-80 Westbound From/To: North of Sierra College Blvd Jurisdiction: Caltrans Analysis Year: Existing+Project Description: Sierra Gateway Apartments TIS Flow Inputs and Adjustments Volume, V 4460 veh/h Peak-hour factor, PHF 0.92 Peak 15-min volume, v v Trucks and buses 9 % Recreational vehicles 0 % Terrain type: Level Grade - % Segment length - mi Trucks and buses PCE, ET 1.5 Recreational vehicle PCE, ER 1.2 Heavy vehicle adjustment, fhv Driver population factor, fp 1.00 Flow rate, vp 1689 pc/h/ln Speed Inputs and Adjustments Lane width - ft Right-side lateral clearance - ft Total ramp density, TRD - ramps/mi Number of lanes, N 3 Free-flow speed: Measured FFS or BFFS 65.0 mi/h Lane width adjustment, flw - mi/h Lateral clearance adjustment, flc - mi/h TRD adjustment - mi/h Free-flow speed, FFS 65.0 mi/h LOS and Performance Measures Flow rate, vp 1689 pc/h/ln Free-flow speed, FFS 65.0 mi/h Average passenger-car speed, S 63.8 mi/h Number of lanes, N 3 Density, D 26.5 pc/mi/ln Level of service, LOS D
209 HCS 2010: Freeway Merge and Diverge Segments Release 6.70 Phone: Fax: Diverge Analysis Analyst: Makinzie Clark Agency/Co.: Omni-Means Date performed: 6/8/2016 Analysis time period: AM Peak Hour Freeway/Dir of Travel: I-80 Westbound Junction: Sierra College Blvd Off Ramp Jurisdiction: Caltrans Analysis Year: Existing+Project Description: Sierra Gateway Apartments TIS Freeway Data Type of analysis Diverge Number of lanes in freeway 3 Free-flow speed on freeway 65.0 mph Volume on freeway 4460 vph Off Ramp Data Side of freeway Right Number of lanes in ramp 1 Free-Flow speed on ramp 35.0 mph Volume on ramp 882 vph Length of first accel/decel lane 650 ft Length of second accel/decel lane ft Adjacent Ramp Data (if one exists) Does adjacent ramp exist? Yes Volume on adjacent ramp 113 vph Position of adjacent ramp Downstream Type of adjacent ramp On Distance to adjacent ramp 1650 ft Conversion to pc/h Under Base Conditions Junction Components Freeway Ramp Adjacent Ramp Volume, V (vph) vph Peak-hour factor, PHF Peak 15-min volume, v v Trucks and buses % Recreational vehicles % Terrain type: Level Level Level Grade 0.00 % 0.00 % 0.00 % Length 0.00 mi 0.00 mi 0.00 mi Trucks and buses PCE, ET Recreational vehicle PCE, ER
210 Heavy vehicle adjustment, fhv Driver population factor, fp Flow rate, vp pcph Estimation of V12 Diverge Areas L = (Equation or 13-13) EQ P = Using Equation 9 FD v = v + (v - v ) P = 3381 pc/h 12 R F R FD Capacity Checks Actual Maximum LOS F? v = v No Fi F v = v - v No FO F R v No R v or v 1685 pc/h (Equation or 13-17) Is v or v > 2700 pc/h? No Is v or v > 1.5 v /2 No 12 If yes, v = 3381 (Equation 13-15, 13-16, 13-18, or 13-19) 12A Flow Entering Diverge Influence Area Actual Max Desirable Violation? v No 12 Level of Service Determination (if not F) Density, D = v L = 27.5 pc/mi/ln R 12 D Level of service for ramp-freeway junction areas of influence C Speed Estimation Intermediate speed variable, D = S Space mean speed in ramp influence area, S = 53.2 mph R Space mean speed in outer lanes, S = 68.6 mph 0 Space mean speed for all vehicles, S = 57.5 mph
211 HCS 2010: Freeway Merge and Diverge Segments Release 6.70 Phone: Fax: Merge Analysis Analyst: Makinzie Clark Agency/Co.: Omni-Means Date performed: 6/8/2016 Analysis time period: AM Peak Hour Freeway/Dir of Travel: I-80 Westbound Junction: Sierra College Blvd On Loop Jurisdiction: Caltrans Analysis Year: Existing+Project Description: Sierra Gateway Apartments TIS Freeway Data Type of analysis Merge Number of lanes in freeway 3 Free-flow speed on freeway 65.0 mph Volume on freeway 3578 vph On Ramp Data Side of freeway Right Number of lanes in ramp 1 Free-flow speed on ramp 25.0 mph Volume on ramp 113 vph Length of first accel/decel lane 700 ft Length of second accel/decel lane ft Adjacent Ramp Data (if one exists) Does adjacent ramp exist? Yes Volume on adjacent Ramp 321 vph Position of adjacent Ramp Downstream Type of adjacent Ramp On Distance to adjacent Ramp 1560 ft Conversion to pc/h Under Base Conditions Junction Components Freeway Ramp Adjacent Ramp Volume, V (vph) vph Peak-hour factor, PHF Peak 15-min volume, v v Trucks and buses % Recreational vehicles % Terrain type: Level Level Level Grade % % % Length mi mi mi Trucks and buses PCE, ET Recreational vehicle PCE, ER
212 Heavy vehicle adjustment, fhv Driver population factor, fp Flow rate, vp pcph Estimation of V12 Merge Areas L = (Equation 13-6 or 13-7) EQ P = Using Equation 3 FM v = v (P ) = 2427 pc/h 12 F FM Capacity Checks Actual Maximum LOS F? v No FO v or v 1637 pc/h (Equation or 13-17) Is v or v > 2700 pc/h? No Is v or v > 1.5 v /2 Yes 12 If yes, v = 2427 (Equation 13-15, 13-16, 13-18, or 13-19) 12A Flow Entering Merge Influence Area Actual Max Desirable Violation? v No 12A Level of Service Determination (if not F) Density, D = v v L = 20.9 pc/mi/ln R R 12 A Level of service for ramp-freeway junction areas of influence C Speed Estimation Intermediate speed variable, M = S Space mean speed in ramp influence area, S = 57.3 mph R Space mean speed in outer lanes, S = 60.9 mph 0 Space mean speed for all vehicles, S = 58.6 mph
213 HCS 2010: Freeway Merge and Diverge Segments Release 6.70 Phone: Fax: Merge Analysis Analyst: Makinzie Clark Agency/Co.: Omni-Means Date performed: 6/8/2016 Analysis time period: AM Peak Hour Freeway/Dir of Travel: I-80 Westbound Junction: Sierra College Blvd On Ramp Jurisdiction: Caltrans Analysis Year: Existing+Project Description: Sierra Gateway Apartments TIS Freeway Data Type of analysis Merge Number of lanes in freeway 3 Free-flow speed on freeway 65.0 mph Volume on freeway 3691 vph On Ramp Data Side of freeway Right Number of lanes in ramp 1 Free-flow speed on ramp 35.0 mph Volume on ramp 321 vph Length of first accel/decel lane 700 ft Length of second accel/decel lane ft Adjacent Ramp Data (if one exists) Does adjacent ramp exist? Yes Volume on adjacent Ramp 113 vph Position of adjacent Ramp Upstream Type of adjacent Ramp On Distance to adjacent Ramp 1560 ft Conversion to pc/h Under Base Conditions Junction Components Freeway Ramp Adjacent Ramp Volume, V (vph) vph Peak-hour factor, PHF Peak 15-min volume, v v Trucks and buses % Recreational vehicles % Terrain type: Level Level Level Grade % % % Length mi mi mi Trucks and buses PCE, ET Recreational vehicle PCE, ER
214 Heavy vehicle adjustment, fhv Driver population factor, fp Flow rate, vp pcph Estimation of V12 Merge Areas L = (Equation 13-6 or 13-7) EQ P = Using Equation 3 FM v = v (P ) = 2503 pc/h 12 F FM Capacity Checks Actual Maximum LOS F? v No FO v or v 1689 pc/h (Equation or 13-17) Is v or v > 2700 pc/h? No Is v or v > 1.5 v /2 Yes 12 If yes, v = 2503 (Equation 13-15, 13-16, 13-18, or 13-19) 12A Flow Entering Merge Influence Area Actual Max Desirable Violation? v No 12A Level of Service Determination (if not F) Density, D = v v L = 23.2 pc/mi/ln R R 12 A Level of service for ramp-freeway junction areas of influence C Speed Estimation Intermediate speed variable, M = S Space mean speed in ramp influence area, S = 57.2 mph R Space mean speed in outer lanes, S = 60.7 mph 0 Space mean speed for all vehicles, S = 58.5 mph
215 HCS 2010: Basic Freeway Segments Release 6.70 Phone: Fax: Operational Analysis Analyst: Makinzie Clark Agency or Company: Omni-Means Date Performed: 6/8/2016 Analysis Time Period: AM Peak Hour Freeway/Direction: I-80 Westbound From/To: Sierra College Blvd/Rocklin Rd Jurisdiction: Caltrans Analysis Year: Existing+Project Description: Sierra Gateway Apartments TIS Flow Inputs and Adjustments Volume, V 4012 veh/h Peak-hour factor, PHF 0.92 Peak 15-min volume, v v Trucks and buses 9 % Recreational vehicles 0 % Terrain type: Level Grade - % Segment length - mi Trucks and buses PCE, ET 1.5 Recreational vehicle PCE, ER 1.2 Heavy vehicle adjustment, fhv Driver population factor, fp 1.00 Flow rate, vp 1519 pc/h/ln Speed Inputs and Adjustments Lane width - ft Right-side lateral clearance - ft Total ramp density, TRD - ramps/mi Number of lanes, N 3 Free-flow speed: Measured FFS or BFFS 65.0 mi/h Lane width adjustment, flw - mi/h Lateral clearance adjustment, flc - mi/h TRD adjustment - mi/h Free-flow speed, FFS 65.0 mi/h LOS and Performance Measures Flow rate, vp 1519 pc/h/ln Free-flow speed, FFS 65.0 mi/h Average passenger-car speed, S 64.8 mi/h Number of lanes, N 3 Density, D 23.4 pc/mi/ln Level of service, LOS C
216 HCS 2010: Basic Freeway Segments Release 6.70 Phone: Fax: Operational Analysis Analyst: Makinzie Clark Agency or Company: Omni-Means Date Performed: 6/8/2016 Analysis Time Period: PM Peak Hour Freeway/Direction: I-80 Eastbound From/To: South of Rocklin Road Jurisdiction: Caltrans Analysis Year: Existing+Project Description: Sierra Gateway Apartments TIS Flow Inputs and Adjustments Volume, V 5041 veh/h Peak-hour factor, PHF 0.92 Peak 15-min volume, v v Trucks and buses 9 % Recreational vehicles 0 % Terrain type: Level Grade - % Segment length - mi Trucks and buses PCE, ET 1.5 Recreational vehicle PCE, ER 1.2 Heavy vehicle adjustment, fhv Driver population factor, fp 1.00 Flow rate, vp 1909 pc/h/ln Speed Inputs and Adjustments Lane width - ft Right-side lateral clearance - ft Total ramp density, TRD - ramps/mi Number of lanes, N 3 Free-flow speed: Measured FFS or BFFS 65.0 mi/h Lane width adjustment, flw - mi/h Lateral clearance adjustment, flc - mi/h TRD adjustment - mi/h Free-flow speed, FFS 65.0 mi/h LOS and Performance Measures Flow rate, vp 1909 pc/h/ln Free-flow speed, FFS 65.0 mi/h Average passenger-car speed, S 61.3 mi/h Number of lanes, N 3 Density, D 31.1 pc/mi/ln Level of service, LOS D
217 HCS 2010: Freeway Merge and Diverge Segments Release 6.80 Phone: Fax: Diverge Analysis Analyst: Makinzie Clark Agency/Co.: Omni-Means Date performed: 6/8/2016 Analysis time period: PM Peak Hour Freeway/Dir of Travel: I-80 Eastbound Junction: Rocklin Road Off Ramp Jurisdiction: Caltrans Analysis Year: Existing+Project Description: Sierra Gateway Apartments TIS Freeway Data Type of analysis Diverge Number of lanes in freeway 3 Free-flow speed on freeway 65.0 mph Volume on freeway 5041 vph Off Ramp Data Side of freeway Right Number of lanes in ramp 1 Free-Flow speed on ramp 35.0 mph Volume on ramp 1040 vph Length of first accel/decel lane 892 ft Length of second accel/decel lane ft Adjacent Ramp Data (if one exists) Does adjacent ramp exist? Volume on adjacent ramp Position of adjacent ramp Type of adjacent ramp Distance to adjacent ramp No vph ft Conversion to pc/h Under Base Conditions Junction Components Freeway Ramp Adjacent Ramp Volume, V (vph) vph Peak-hour factor, PHF Peak 15-min volume, v v Trucks and buses 9 2 % Recreational vehicles 0 0 % Terrain type: Level Level Grade 0.00 % 0.00 % % Length 0.00 mi 0.00 mi mi Trucks and buses PCE, ET Recreational vehicle PCE, ER
218 Heavy vehicle adjustment, fhv Driver population factor, fp Flow rate, vp pcph Estimation of V12 Diverge Areas L = (Equation or 13-13) EQ P = Using Equation 9 FD v = v + (v - v ) P = 3718 pc/h 12 R F R FD Capacity Checks Actual Maximum LOS F? v = v No Fi F v = v - v No FO F R v No R v or v 2008 pc/h (Equation or 13-17) Is v or v > 2700 pc/h? No Is v or v > 1.5 v /2 No 12 If yes, v = 3718 (Equation 13-15, 13-16, 13-18, or 13-19) 12A Flow Entering Diverge Influence Area Actual Max Desirable Violation? v No 12 Level of Service Determination (if not F) Density, D = v L = 28.2 pc/mi/ln R 12 D Level of service for ramp-freeway junction areas of influence D Speed Estimation Intermediate speed variable, D = S Space mean speed in ramp influence area, S = 52.9 mph R Space mean speed in outer lanes, S = 67.4 mph 0 Space mean speed for all vehicles, S = 57.2 mph
219 HCS 2010: Freeway Merge and Diverge Segments Release 6.70 Phone: Fax: Merge Analysis Analyst: Makinzie Clark Agency/Co.: Omni-Means Date performed: 6/8/2016 Analysis time period: PM Peak Hour Freeway/Dir of Travel: I-80 Eastbound Junction: Rocklin Road On Ramp Jurisdiction: Caltrans Analysis Year: Existing+Project Description: Sierra Gateway Apartments TIS Freeway Data Type of analysis Merge Number of lanes in freeway 3 Free-flow speed on freeway 65.0 mph Volume on freeway 4001 vph On Ramp Data Side of freeway Right Number of lanes in ramp 1 Free-flow speed on ramp 35.0 mph Volume on ramp 261 vph Length of first accel/decel lane 360 ft Length of second accel/decel lane ft Adjacent Ramp Data (if one exists) Does adjacent ramp exist? Volume on adjacent Ramp Position of adjacent Ramp Type of adjacent Ramp Distance to adjacent Ramp No vph ft Conversion to pc/h Under Base Conditions Junction Components Freeway Ramp Adjacent Ramp Volume, V (vph) vph Peak-hour factor, PHF Peak 15-min volume, v v Trucks and buses 9 2 % Recreational vehicles 0 0 % Terrain type: Level Level Grade % % % Length mi mi mi Trucks and buses PCE, ET Recreational vehicle PCE, ER
220 Heavy vehicle adjustment, fhv Driver population factor, fp Flow rate, vp pcph Estimation of V12 Merge Areas L = (Equation 13-6 or 13-7) EQ P = Using Equation 3 FM v = v (P ) = 2671 pc/h 12 F FM Capacity Checks Actual Maximum LOS F? v No FO v or v 1874 pc/h (Equation or 13-17) Is v or v > 2700 pc/h? No Is v or v > 1.5 v /2 Yes 12 If yes, v = 2671 (Equation 13-15, 13-16, 13-18, or 13-19) 12A Flow Entering Merge Influence Area Actual Max Desirable Violation? v No 12A Level of Service Determination (if not F) Density, D = v v L = 26.1 pc/mi/ln R R 12 A Level of service for ramp-freeway junction areas of influence C Speed Estimation Intermediate speed variable, M = S Space mean speed in ramp influence area, S = 56.5 mph R Space mean speed in outer lanes, S = 60.1 mph 0 Space mean speed for all vehicles, S = 57.8 mph
221 HCS 2010: Freeway Merge and Diverge Segments Release 6.70 Phone: Fax: Diverge Analysis Analyst: Makinzie Clark Agency/Co.: Omni-Means Date performed: 6/8/2016 Analysis time period: PM Peak Hour Freeway/Dir of Travel: I-80 Westbound Junction: Rocklin Road Off Ramp Jurisdiction: Caltrans Analysis Year: Existing+Project Description: Sierra Gateway Apartments TIS Freeway Data Type of analysis Diverge Number of lanes in freeway 3 Free-flow speed on freeway 65.0 mph Volume on freeway 3439 vph Off Ramp Data Side of freeway Right Number of lanes in ramp 1 Free-Flow speed on ramp 35.0 mph Volume on ramp 342 vph Length of first accel/decel lane 150 ft Length of second accel/decel lane ft Adjacent Ramp Data (if one exists) Does adjacent ramp exist? Volume on adjacent ramp Position of adjacent ramp Type of adjacent ramp Distance to adjacent ramp No vph ft Conversion to pc/h Under Base Conditions Junction Components Freeway Ramp Adjacent Ramp Volume, V (vph) vph Peak-hour factor, PHF Peak 15-min volume, v v Trucks and buses 9 2 % Recreational vehicles 0 0 % Terrain type: Level Level Grade 0.00 % 0.00 % % Length 0.00 mi 0.00 mi mi Trucks and buses PCE, ET Recreational vehicle PCE, ER
222 Heavy vehicle adjustment, fhv Driver population factor, fp Flow rate, vp pcph Estimation of V12 Diverge Areas L = (Equation or 13-13) EQ P = Using Equation 9 FD v = v + (v - v ) P = 2648 pc/h 12 R F R FD Capacity Checks Actual Maximum LOS F? v = v No Fi F v = v - v No FO F R v No R v or v 1258 pc/h (Equation or 13-17) Is v or v > 2700 pc/h? No Is v or v > 1.5 v /2 No 12 If yes, v = 2648 (Equation 13-15, 13-16, 13-18, or 13-19) 12A Flow Entering Diverge Influence Area Actual Max Desirable Violation? v No 12 Level of Service Determination (if not F) Density, D = v L = 25.7 pc/mi/ln R 12 D Level of service for ramp-freeway junction areas of influence C Speed Estimation Intermediate speed variable, D = S Space mean speed in ramp influence area, S = 54.4 mph R Space mean speed in outer lanes, S = 70.3 mph 0 Space mean speed for all vehicles, S = 58.7 mph
223 HCS 2010: Freeway Merge and Diverge Segments Release 6.70 Phone: Fax: Merge Analysis Analyst: Makinzie Clark Agency/Co.: Omni-Means Date performed: 6/8/2016 Analysis time period: PM Peak Hour Freeway/Dir of Travel: I-80 Westbound Junction: Rocklin Road On Ramp Jurisdiction: Caltrans Analysis Year: Existing+Project Description: Sierra Gateway Apartments TIS Freeway Data Type of analysis Merge Number of lanes in freeway 3 Free-flow speed on freeway 65.0 mph Volume on freeway 3097 vph On Ramp Data Side of freeway Right Number of lanes in ramp 1 Free-flow speed on ramp 35.0 mph Volume on ramp 1177 vph Length of first accel/decel lane 760 ft Length of second accel/decel lane ft Adjacent Ramp Data (if one exists) Does adjacent ramp exist? Volume on adjacent Ramp Position of adjacent Ramp Type of adjacent Ramp Distance to adjacent Ramp No vph ft Conversion to pc/h Under Base Conditions Junction Components Freeway Ramp Adjacent Ramp Volume, V (vph) vph Peak-hour factor, PHF Peak 15-min volume, v v Trucks and buses 9 2 % Recreational vehicles 0 0 % Terrain type: Level Level Grade % % % Length mi mi mi Trucks and buses PCE, ET Recreational vehicle PCE, ER
224 Heavy vehicle adjustment, fhv Driver population factor, fp Flow rate, vp pcph Estimation of V12 Merge Areas L = (Equation 13-6 or 13-7) EQ P = Using Equation 3 FM v = v (P ) = 2107 pc/h 12 F FM Capacity Checks Actual Maximum LOS F? v No FO v or v 1411 pc/h (Equation or 13-17) Is v or v > 2700 pc/h? No Is v or v > 1.5 v /2 Yes 12 If yes, v = 2107 (Equation 13-15, 13-16, 13-18, or 13-19) 12A Flow Entering Merge Influence Area Actual Max Desirable Violation? v No 12A Level of Service Determination (if not F) Density, D = v v L = 26.0 pc/mi/ln R R 12 A Level of service for ramp-freeway junction areas of influence C Speed Estimation Intermediate speed variable, M = S Space mean speed in ramp influence area, S = 56.4 mph R Space mean speed in outer lanes, S = 61.7 mph 0 Space mean speed for all vehicles, S = 57.9 mph
225 HCS 2010: Basic Freeway Segments Release 6.70 Phone: Fax: Operational Analysis Analyst: Makinzie Clark Agency or Company: Omni-Means Date Performed: 6/8/2016 Analysis Time Period: PM Peak Hour Freeway/Direction: I-80 Westbound From/To: South of Rocklin Road Jurisdiction: Caltrans Analysis Year: Existing+Project Description: Sierra Gateway Apartments TIS Flow Inputs and Adjustments Volume, V 4274 veh/h Peak-hour factor, PHF 0.92 Peak 15-min volume, v v Trucks and buses 9 % Recreational vehicles 0 % Terrain type: Level Grade - % Segment length - mi Trucks and buses PCE, ET 1.5 Recreational vehicle PCE, ER 1.2 Heavy vehicle adjustment, fhv Driver population factor, fp 1.00 Flow rate, vp 1618 pc/h/ln Speed Inputs and Adjustments Lane width - ft Right-side lateral clearance - ft Total ramp density, TRD - ramps/mi Number of lanes, N 3 Free-flow speed: Measured FFS or BFFS 65.0 mi/h Lane width adjustment, flw - mi/h Lateral clearance adjustment, flc - mi/h TRD adjustment - mi/h Free-flow speed, FFS 65.0 mi/h LOS and Performance Measures Flow rate, vp 1618 pc/h/ln Free-flow speed, FFS 65.0 mi/h Average passenger-car speed, S 64.3 mi/h Number of lanes, N 3 Density, D 25.2 pc/mi/ln Level of service, LOS C
226 HCS 2010: Basic Freeway Segments Release 6.70 Phone: Fax: Operational Analysis Analyst: Makinzie Clark Agency or Company: Omni-Means Date Performed: 6/8/2016 Analysis Time Period: PM Peak Hour Freeway/Direction: I-80 Eastbound From/To: Rocklin Rd/Sierra College Blvd Jurisdiction: Caltrans Analysis Year: Existing+Project Description: Sierra Gateway Apartments TIS Flow Inputs and Adjustments Volume, V 4262 veh/h Peak-hour factor, PHF 0.92 Peak 15-min volume, v v Trucks and buses 9 % Recreational vehicles 0 % Terrain type: Level Grade - % Segment length - mi Trucks and buses PCE, ET 1.5 Recreational vehicle PCE, ER 1.2 Heavy vehicle adjustment, fhv Driver population factor, fp 1.00 Flow rate, vp 1614 pc/h/ln Speed Inputs and Adjustments Lane width - ft Right-side lateral clearance - ft Total ramp density, TRD - ramps/mi Number of lanes, N 3 Free-flow speed: Measured FFS or BFFS 65.0 mi/h Lane width adjustment, flw - mi/h Lateral clearance adjustment, flc - mi/h TRD adjustment - mi/h Free-flow speed, FFS 65.0 mi/h LOS and Performance Measures Flow rate, vp 1614 pc/h/ln Free-flow speed, FFS 65.0 mi/h Average passenger-car speed, S 64.4 mi/h Number of lanes, N 3 Density, D 25.1 pc/mi/ln Level of service, LOS C
227 HCS 2010: Freeway Merge and Diverge Segments Release 6.70 Phone: Fax: Diverge Analysis Analyst: Makinzie Clark Agency/Co.: Omni-Means Date performed: 6/8/2016 Analysis time period: PM Peak Hour Freeway/Dir of Travel: I-80 Eastound Junction: Sierra College Blvd Off Ramp Jurisdiction: Caltrans Analysis Year: Existing+Project Description: Sierra Gateway Apartments TIS Freeway Data Type of analysis Diverge Number of lanes in freeway 3 Free-flow speed on freeway 65.0 mph Volume on freeway 4262 vph Off Ramp Data Side of freeway Right Number of lanes in ramp 1 Free-Flow speed on ramp 35.0 mph Volume on ramp 577 vph Length of first accel/decel lane 150 ft Length of second accel/decel lane ft Adjacent Ramp Data (if one exists) Does adjacent ramp exist? Yes Volume on adjacent ramp 343 vph Position of adjacent ramp Downstream Type of adjacent ramp On Distance to adjacent ramp 1560 ft Conversion to pc/h Under Base Conditions Junction Components Freeway Ramp Adjacent Ramp Volume, V (vph) vph Peak-hour factor, PHF Peak 15-min volume, v v Trucks and buses % Recreational vehicles % Terrain type: Level Level Level Grade 0.00 % 0.00 % 0.00 % Length 0.00 mi 0.00 mi 0.00 mi Trucks and buses PCE, ET Recreational vehicle PCE, ER
228 Heavy vehicle adjustment, fhv Driver population factor, fp Flow rate, vp pcph Estimation of V12 Diverge Areas L = (Equation or 13-13) EQ P = Using Equation 9 FD v = v + (v - v ) P = 3195 pc/h 12 R F R FD Capacity Checks Actual Maximum LOS F? v = v No Fi F v = v - v No FO F R v No R v or v 1646 pc/h (Equation or 13-17) Is v or v > 2700 pc/h? No Is v or v > 1.5 v /2 No 12 If yes, v = 3195 (Equation 13-15, 13-16, 13-18, or 13-19) 12A Flow Entering Diverge Influence Area Actual Max Desirable Violation? v No 12 Level of Service Determination (if not F) Density, D = v L = 30.4 pc/mi/ln R 12 D Level of service for ramp-freeway junction areas of influence D Speed Estimation Intermediate speed variable, D = S Space mean speed in ramp influence area, S = 53.9 mph R Space mean speed in outer lanes, S = 68.8 mph 0 Space mean speed for all vehicles, S = 58.2 mph
229 HCS 2010: Freeway Merge and Diverge Segments Release 6.70 Phone: Fax: Merge Analysis Analyst: Makinzie Clark Agency/Co.: Omni-Means Date performed: 6/8/2016 Analysis time period: PM Peak Hour Freeway/Dir of Travel: I-80 Eastbound Junction: Sierra College Blvd On Loop Jurisdiction: Caltrans Analysis Year: Existing+Project Description: Sierra Gateway Apartments TIS Freeway Data Type of analysis Merge Number of lanes in freeway 3 Free-flow speed on freeway 65.0 mph Volume on freeway 3685 vph On Ramp Data Side of freeway Right Number of lanes in ramp 1 Free-flow speed on ramp 25.0 mph Volume on ramp 343 vph Length of first accel/decel lane 800 ft Length of second accel/decel lane ft Adjacent Ramp Data (if one exists) Does adjacent ramp exist? Yes Volume on adjacent Ramp 754 vph Position of adjacent Ramp Downstream Type of adjacent Ramp On Distance to adjacent Ramp 1420 ft Conversion to pc/h Under Base Conditions Junction Components Freeway Ramp Adjacent Ramp Volume, V (vph) vph Peak-hour factor, PHF Peak 15-min volume, v v Trucks and buses % Recreational vehicles % Terrain type: Level Level Level Grade % % % Length mi mi mi Trucks and buses PCE, ET Recreational vehicle PCE, ER
230 Heavy vehicle adjustment, fhv Driver population factor, fp Flow rate, vp pcph Estimation of V12 Merge Areas L = (Equation 13-6 or 13-7) EQ P = Using Equation 3 FM v = v (P ) = 2511 pc/h 12 F FM Capacity Checks Actual Maximum LOS F? v No FO v or v 1675 pc/h (Equation or 13-17) Is v or v > 2700 pc/h? No Is v or v > 1.5 v /2 Yes 12 If yes, v = 2511 (Equation 13-15, 13-16, 13-18, or 13-19) 12A Flow Entering Merge Influence Area Actual Max Desirable Violation? v No 12A Level of Service Determination (if not F) Density, D = v v L = 22.7 pc/mi/ln R R 12 A Level of service for ramp-freeway junction areas of influence C Speed Estimation Intermediate speed variable, M = S Space mean speed in ramp influence area, S = 56.9 mph R Space mean speed in outer lanes, S = 60.8 mph 0 Space mean speed for all vehicles, S = 58.3 mph
231 HCS 2010: Freeway Merge and Diverge Segments Release 6.70 Phone: Fax: Merge Analysis Analyst: Makinzie Clark Agency/Co.: Omni-Means Date performed: 6/8/2016 Analysis time period: PM Peak Hour Freeway/Dir of Travel: I-80 Eastbound Junction: Sierra College Blvd On Ramp Jurisdiction: Caltrans Analysis Year: Existing+Project Description: Sierra Gateway Apartments TIS Freeway Data Type of analysis Merge Number of lanes in freeway 3 Free-flow speed on freeway 65.0 mph Volume on freeway 4028 vph On Ramp Data Side of freeway Right Number of lanes in ramp 1 Free-flow speed on ramp 35.0 mph Volume on ramp 754 vph Length of first accel/decel lane 700 ft Length of second accel/decel lane ft Adjacent Ramp Data (if one exists) Does adjacent ramp exist? Yes Volume on adjacent Ramp 343 vph Position of adjacent Ramp Upstream Type of adjacent Ramp On Distance to adjacent Ramp 1420 ft Conversion to pc/h Under Base Conditions Junction Components Freeway Ramp Adjacent Ramp Volume, V (vph) vph Peak-hour factor, PHF Peak 15-min volume, v v Trucks and buses % Recreational vehicles % Terrain type: Level Level Level Grade % % % Length mi mi mi Trucks and buses PCE, ET Recreational vehicle PCE, ER
232 Heavy vehicle adjustment, fhv Driver population factor, fp Flow rate, vp pcph Estimation of V12 Merge Areas L = (Equation 13-6 or 13-7) EQ P = Using Equation 3 FM v = v (P ) = 2732 pc/h 12 F FM Capacity Checks Actual Maximum LOS F? v No FO v or v 1843 pc/h (Equation or 13-17) Is v or v > 2700 pc/h? No Is v or v > 1.5 v /2 Yes 12 If yes, v = 2732 (Equation 13-15, 13-16, 13-18, or 13-19) 12A Flow Entering Merge Influence Area Actual Max Desirable Violation? v No 12A Level of Service Determination (if not F) Density, D = v v L = 28.3 pc/mi/ln R R 12 A Level of service for ramp-freeway junction areas of influence D Speed Estimation Intermediate speed variable, M = S Space mean speed in ramp influence area, S = 55.7 mph R Space mean speed in outer lanes, S = 60.2 mph 0 Space mean speed for all vehicles, S = 57.1 mph
233 HCS 2010: Basic Freeway Segments Release 6.70 Phone: Fax: Operational Analysis Analyst: Makinzie Clark Agency or Company: Omni-Means Date Performed: 6/8/2016 Analysis Time Period: PM Peak Hour Freeway/Direction: I-80 Eastbound From/To: North of Sierra College Blvd Jurisdiction: Caltrans Analysis Year: Existing+Project Description: Sierra Gateway Apartments TIS Flow Inputs and Adjustments Volume, V 4782 veh/h Peak-hour factor, PHF 0.92 Peak 15-min volume, v v Trucks and buses 9 % Recreational vehicles 0 % Terrain type: Level Grade - % Segment length - mi Trucks and buses PCE, ET 1.5 Recreational vehicle PCE, ER 1.2 Heavy vehicle adjustment, fhv Driver population factor, fp 1.00 Flow rate, vp 1811 pc/h/ln Speed Inputs and Adjustments Lane width - ft Right-side lateral clearance - ft Total ramp density, TRD - ramps/mi Number of lanes, N 3 Free-flow speed: Measured FFS or BFFS 65.0 mi/h Lane width adjustment, flw - mi/h Lateral clearance adjustment, flc - mi/h TRD adjustment - mi/h Free-flow speed, FFS 65.0 mi/h LOS and Performance Measures Flow rate, vp 1811 pc/h/ln Free-flow speed, FFS 65.0 mi/h Average passenger-car speed, S 62.6 mi/h Number of lanes, N 3 Density, D 28.9 pc/mi/ln Level of service, LOS D
234 HCS 2010: Basic Freeway Segments Release 6.70 Phone: Fax: Operational Analysis Analyst: Makinzie Clark Agency or Company: Omni-Means Date Performed: 6/8/2016 Analysis Time Period: PM Peak Hour Freeway/Direction: I-80 Westbound From/To: North of Sierra College Blvd Jurisdiction: Caltrans Analysis Year: Existing+Project Description: Sierra Gateway Apartments TIS Flow Inputs and Adjustments Volume, V 3557 veh/h Peak-hour factor, PHF 0.92 Peak 15-min volume, v v Trucks and buses 9 % Recreational vehicles 0 % Terrain type: Level Grade - % Segment length - mi Trucks and buses PCE, ET 1.5 Recreational vehicle PCE, ER 1.2 Heavy vehicle adjustment, fhv Driver population factor, fp 1.00 Flow rate, vp 1347 pc/h/ln Speed Inputs and Adjustments Lane width - ft Right-side lateral clearance - ft Total ramp density, TRD - ramps/mi Number of lanes, N 3 Free-flow speed: Measured FFS or BFFS 65.0 mi/h Lane width adjustment, flw - mi/h Lateral clearance adjustment, flc - mi/h TRD adjustment - mi/h Free-flow speed, FFS 65.0 mi/h LOS and Performance Measures Flow rate, vp 1347 pc/h/ln Free-flow speed, FFS 65.0 mi/h Average passenger-car speed, S 65.0 mi/h Number of lanes, N 3 Density, D 20.7 pc/mi/ln Level of service, LOS C
235 HCS 2010: Freeway Merge and Diverge Segments Release 6.70 Phone: Fax: Diverge Analysis Analyst: Makinzie Clark Agency/Co.: Omni-Means Date performed: 6/8/2016 Analysis time period: PM Peak Hour Freeway/Dir of Travel: I-80 Westbound Junction: Sierra College Blvd Off Ramp Jurisdiction: Caltrans Analysis Year: Existing+Project Description: Sierra Gateway Apartments TIS Freeway Data Type of analysis Diverge Number of lanes in freeway 3 Free-flow speed on freeway 65.0 mph Volume on freeway 3557 vph Off Ramp Data Side of freeway Right Number of lanes in ramp 1 Free-Flow speed on ramp 35.0 mph Volume on ramp 735 vph Length of first accel/decel lane 650 ft Length of second accel/decel lane ft Adjacent Ramp Data (if one exists) Does adjacent ramp exist? Yes Volume on adjacent ramp 235 vph Position of adjacent ramp Downstream Type of adjacent ramp On Distance to adjacent ramp 1650 ft Conversion to pc/h Under Base Conditions Junction Components Freeway Ramp Adjacent Ramp Volume, V (vph) vph Peak-hour factor, PHF Peak 15-min volume, v v Trucks and buses % Recreational vehicles % Terrain type: Level Level Level Grade 0.00 % 0.00 % 0.00 % Length 0.00 mi 0.00 mi 0.00 mi Trucks and buses PCE, ET Recreational vehicle PCE, ER
236 Heavy vehicle adjustment, fhv Driver population factor, fp Flow rate, vp pcph Estimation of V12 Diverge Areas L = (Equation or 13-13) EQ P = Using Equation 9 FD v = v + (v - v ) P = 2813 pc/h 12 R F R FD Capacity Checks Actual Maximum LOS F? v = v No Fi F v = v - v No FO F R v No R v or v 1227 pc/h (Equation or 13-17) Is v or v > 2700 pc/h? No Is v or v > 1.5 v /2 No 12 If yes, v = 2813 (Equation 13-15, 13-16, 13-18, or 13-19) 12A Flow Entering Diverge Influence Area Actual Max Desirable Violation? v No 12 Level of Service Determination (if not F) Density, D = v L = 22.6 pc/mi/ln R 12 D Level of service for ramp-freeway junction areas of influence C Speed Estimation Intermediate speed variable, D = S Space mean speed in ramp influence area, S = 53.5 mph R Space mean speed in outer lanes, S = 70.4 mph 0 Space mean speed for all vehicles, S = 57.7 mph
237 HCS 2010: Freeway Merge and Diverge Segments Release 6.70 Phone: Fax: Merge Analysis Analyst: Makinzie Clark Agency/Co.: Omni-Means Date performed: 6/8/2016 Analysis time period: PM Peak Hour Freeway/Dir of Travel: I-80 Westbound Junction: Sierra College Blvd On Loop Jurisdiction: Caltrans Analysis Year: Existing+Project Description: Sierra Gateway Apartments TIS Freeway Data Type of analysis Merge Number of lanes in freeway 3 Free-flow speed on freeway 65.0 mph Volume on freeway 2822 vph On Ramp Data Side of freeway Right Number of lanes in ramp 1 Free-flow speed on ramp 25.0 mph Volume on ramp 235 vph Length of first accel/decel lane 700 ft Length of second accel/decel lane ft Adjacent Ramp Data (if one exists) Does adjacent ramp exist? Yes Volume on adjacent Ramp 382 vph Position of adjacent Ramp Downstream Type of adjacent Ramp On Distance to adjacent Ramp 1560 ft Conversion to pc/h Under Base Conditions Junction Components Freeway Ramp Adjacent Ramp Volume, V (vph) vph Peak-hour factor, PHF Peak 15-min volume, v v Trucks and buses % Recreational vehicles % Terrain type: Level Level Level Grade % % % Length mi mi mi Trucks and buses PCE, ET Recreational vehicle PCE, ER
238 Heavy vehicle adjustment, fhv Driver population factor, fp Flow rate, vp pcph Estimation of V12 Merge Areas L = (Equation 13-6 or 13-7) EQ P = Using Equation 3 FM v = v (P ) = 1914 pc/h 12 F FM Capacity Checks Actual Maximum LOS F? v No FO v or v 1291 pc/h (Equation or 13-17) Is v or v > 2700 pc/h? No Is v or v > 1.5 v /2 Yes 12 If yes, v = 1914 (Equation 13-15, 13-16, 13-18, or 13-19) 12A Flow Entering Merge Influence Area Actual Max Desirable Violation? v No 12A Level of Service Determination (if not F) Density, D = v v L = 17.9 pc/mi/ln R R 12 A Level of service for ramp-freeway junction areas of influence B Speed Estimation Intermediate speed variable, M = S Space mean speed in ramp influence area, S = 57.6 mph R Space mean speed in outer lanes, S = 62.2 mph 0 Space mean speed for all vehicles, S = 59.2 mph
239 HCS 2010: Freeway Merge and Diverge Segments Release 6.70 Phone: Fax: Merge Analysis Analyst: Makinzie Clark Agency/Co.: Omni-Means Date performed: 6/8/2016 Analysis time period: PM Peak Hour Freeway/Dir of Travel: I-80 Westbound Junction: Sierra Collge Blvd On Ramp Jurisdiction: Caltrans Analysis Year: Existing+Project Description: Sierra Gateway Apartments TIS Freeway Data Type of analysis Merge Number of lanes in freeway 3 Free-flow speed on freeway 65.0 mph Volume on freeway 3057 vph On Ramp Data Side of freeway Right Number of lanes in ramp 1 Free-flow speed on ramp 35.0 mph Volume on ramp 382 vph Length of first accel/decel lane 700 ft Length of second accel/decel lane ft Adjacent Ramp Data (if one exists) Does adjacent ramp exist? Yes Volume on adjacent Ramp 235 vph Position of adjacent Ramp Upstream Type of adjacent Ramp On Distance to adjacent Ramp 1560 ft Conversion to pc/h Under Base Conditions Junction Components Freeway Ramp Adjacent Ramp Volume, V (vph) vph Peak-hour factor, PHF Peak 15-min volume, v v Trucks and buses % Recreational vehicles % Terrain type: Level Level Level Grade % % % Length mi mi mi Trucks and buses PCE, ET Recreational vehicle PCE, ER
240 Heavy vehicle adjustment, fhv Driver population factor, fp Flow rate, vp pcph Estimation of V12 Merge Areas L = (Equation 13-6 or 13-7) EQ P = Using Equation 3 FM v = v (P ) = 2073 pc/h 12 F FM Capacity Checks Actual Maximum LOS F? v No FO v or v 1399 pc/h (Equation or 13-17) Is v or v > 2700 pc/h? No Is v or v > 1.5 v /2 Yes 12 If yes, v = 2073 (Equation 13-15, 13-16, 13-18, or 13-19) 12A Flow Entering Merge Influence Area Actual Max Desirable Violation? v No 12A Level of Service Determination (if not F) Density, D = v v L = 20.3 pc/mi/ln R R 12 A Level of service for ramp-freeway junction areas of influence C Speed Estimation Intermediate speed variable, M = S Space mean speed in ramp influence area, S = 57.7 mph R Space mean speed in outer lanes, S = 61.8 mph 0 Space mean speed for all vehicles, S = 59.1 mph
241 HCS 2010: Basic Freeway Segments Release 6.70 Phone: Fax: Operational Analysis Analyst: Makinzie Clark Agency or Company: Omni-Means Date Performed: 6/8/2016 Analysis Time Period: PM Peak Hour Freeway/Direction: I-80 Westbound From/To: Sierra College Blvd/Rocklin Rd Jurisdiction: Caltrans Analysis Year: Existing+Project Description: Sierra Gateway Apartments TIS Flow Inputs and Adjustments Volume, V 3439 veh/h Peak-hour factor, PHF 0.92 Peak 15-min volume, v v Trucks and buses 9 % Recreational vehicles 0 % Terrain type: Level Grade - % Segment length - mi Trucks and buses PCE, ET 1.5 Recreational vehicle PCE, ER 1.2 Heavy vehicle adjustment, fhv Driver population factor, fp 1.00 Flow rate, vp 1302 pc/h/ln Speed Inputs and Adjustments Lane width - ft Right-side lateral clearance - ft Total ramp density, TRD - ramps/mi Number of lanes, N 3 Free-flow speed: Measured FFS or BFFS 65.0 mi/h Lane width adjustment, flw - mi/h Lateral clearance adjustment, flc - mi/h TRD adjustment - mi/h Free-flow speed, FFS 65.0 mi/h LOS and Performance Measures Flow rate, vp 1302 pc/h/ln Free-flow speed, FFS 65.0 mi/h Average passenger-car speed, S 65.0 mi/h Number of lanes, N 3 Density, D 20.0 pc/mi/ln Level of service, LOS C
242 HCS 2010: Basic Freeway Segments Release 6.80 Phone: Fax: Operational Analysis Analyst: Makinzie Clark Agency or Company: Omni-Means Date Performed: 6/8/2016 Analysis Time Period: AM Peak Hour Freeway/Direction: I-80 Eastbound From/To: South of Rocklin Road Jurisdiction: Caltrans Analysis Year: Existing Plus Approved Pending Description: Sierra Gateway Apartments TIS Flow Inputs and Adjustments Volume, V 4161 veh/h Peak-hour factor, PHF 0.92 Peak 15-min volume, v v Trucks and buses 9 % Recreational vehicles 0 % Terrain type: Level Grade - % Segment length - mi Trucks and buses PCE, ET 1.5 Recreational vehicle PCE, ER 1.2 Heavy vehicle adjustment, fhv Driver population factor, fp 1.00 Flow rate, vp 1575 pc/h/ln Speed Inputs and Adjustments Lane width - ft Right-side lateral clearance - ft Total ramp density, TRD - ramps/mi Number of lanes, N 3 Free-flow speed: Measured FFS or BFFS 65.0 mi/h Lane width adjustment, flw - mi/h Lateral clearance adjustment, flc - mi/h TRD adjustment - mi/h Free-flow speed, FFS 65.0 mi/h LOS and Performance Measures Flow rate, vp 1575 pc/h/ln Free-flow speed, FFS 65.0 mi/h Average passenger-car speed, S 64.6 mi/h Number of lanes, N 3 Density, D 24.4 pc/mi/ln Level of service, LOS C
243 HCS 2010: Freeway Merge and Diverge Segments Release 6.80 Phone: Fax: Diverge Analysis Analyst: Makinzie Clark Agency/Co.: Omni-Means Date performed: 6/8/2016 Analysis time period: AM Peak Hour Freeway/Dir of Travel: I-80 Eastbound Junction: Rocklin Road Off Ramp Jurisdiction: Caltrans Analysis Year: Existing Plus Approved Pending Description: Sierra Gateway Apartments TIS Freeway Data Type of analysis Diverge Number of lanes in freeway 3 Free-flow speed on freeway 65.0 mph Volume on freeway 4161 vph Off Ramp Data Side of freeway Right Number of lanes in ramp 1 Free-Flow speed on ramp 35.0 mph Volume on ramp 1498 vph Length of first accel/decel lane 1050 ft Length of second accel/decel lane ft Adjacent Ramp Data (if one exists) Does adjacent ramp exist? Volume on adjacent ramp Position of adjacent ramp Type of adjacent ramp Distance to adjacent ramp No vph ft Conversion to pc/h Under Base Conditions Junction Components Freeway Ramp Adjacent Ramp Volume, V (vph) vph Peak-hour factor, PHF Peak 15-min volume, v v Trucks and buses 9 2 % Recreational vehicles 0 0 % Terrain type: Level Level Grade 0.00 % 0.00 % % Length 0.00 mi 0.00 mi mi Trucks and buses PCE, ET Recreational vehicle PCE, ER
244 Heavy vehicle adjustment, fhv Driver population factor, fp Flow rate, vp pcph Estimation of V12 Diverge Areas L = (Equation or 13-13) EQ P = Using Equation 9 FD v = v + (v - v ) P = 3379 pc/h 12 R F R FD Capacity Checks Actual Maximum LOS F? v = v No Fi F v = v - v No FO F R v No R v or v 1347 pc/h (Equation or 13-17) Is v or v > 2700 pc/h? No Is v or v > 1.5 v /2 No 12 If yes, v = 3379 (Equation 13-15, 13-16, 13-18, or 13-19) 12A Flow Entering Diverge Influence Area Actual Max Desirable Violation? v No 12 Level of Service Determination (if not F) Density, D = v L = 23.9 pc/mi/ln R 12 D Level of service for ramp-freeway junction areas of influence C Speed Estimation Intermediate speed variable, D = S Space mean speed in ramp influence area, S = 51.8 mph R Space mean speed in outer lanes, S = 70.0 mph 0 Space mean speed for all vehicles, S = 56.0 mph
245 HCS 2010: Freeway Merge and Diverge Segments Release 6.80 Phone: Fax: Merge Analysis Analyst: Makinzie Clark Agency/Co.: Omni-Means Date performed: 6/8/2016 Analysis time period: AM Peak Hour Freeway/Dir of Travel: I-80 Eastbound Junction: Rocklin Road On Ramp Jurisdiction: Caltrans Analysis Year: Existing Plus Approved Pending Description: Sierra Gateway Apartments TIS Freeway Data Type of analysis Merge Number of lanes in freeway 3 Free-flow speed on freeway 65.0 mph Volume on freeway 2663 vph On Ramp Data Side of freeway Right Number of lanes in ramp 1 Free-flow speed on ramp 35.0 mph Volume on ramp 221 vph Length of first accel/decel lane 360 ft Length of second accel/decel lane ft Adjacent Ramp Data (if one exists) Does adjacent ramp exist? Volume on adjacent Ramp Position of adjacent Ramp Type of adjacent Ramp Distance to adjacent Ramp No vph ft Conversion to pc/h Under Base Conditions Junction Components Freeway Ramp Adjacent Ramp Volume, V (vph) vph Peak-hour factor, PHF Peak 15-min volume, v v Trucks and buses 9 2 % Recreational vehicles 0 0 % Terrain type: Level Level Grade % % % Length mi mi mi Trucks and buses PCE, ET Recreational vehicle PCE, ER
246 Heavy vehicle adjustment, fhv Driver population factor, fp Flow rate, vp pcph Estimation of V12 Merge Areas L = (Equation 13-6 or 13-7) EQ P = Using Equation 3 FM v = v (P ) = 1777 pc/h 12 F FM Capacity Checks Actual Maximum LOS F? v No FO v or v 1248 pc/h (Equation or 13-17) Is v or v > 2700 pc/h? No Is v or v > 1.5 v /2 Yes 12 If yes, v = 1777 (Equation 13-15, 13-16, 13-18, or 13-19) 12A Flow Entering Merge Influence Area Actual Max Desirable Violation? v No 12A Level of Service Determination (if not F) Density, D = v v L = 18.8 R R 12 A Level of service for ramp-freeway junction areas of influence B pc/mi/ln Speed Estimation Intermediate speed variable, M = S Space mean speed in ramp influence area, S = 57.5 mph R Space mean speed in outer lanes, S = 62.3 mph 0 Space mean speed for all vehicles, S = 59.3 mph
247 HCS 2010: Freeway Merge and Diverge Segments Release 6.80 Phone: Fax: Diverge Analysis Analyst: Makinzie Clark Agency/Co.: Omni-Means Date performed: 6/8/2016 Analysis time period: AM Peak Hour Freeway/Dir of Travel: I-80 Westbound Junction: Rocklin Road Off Ramp Jurisdiction: Caltrans Analysis Year: Existing Plus Approved Pending Description: Sierra Gateway Apartments TIS Freeway Data Type of analysis Diverge Number of lanes in freeway 3 Free-flow speed on freeway 65.0 mph Volume on freeway 4046 vph Off Ramp Data Side of freeway Right Number of lanes in ramp 1 Free-Flow speed on ramp 35.0 mph Volume on ramp 291 vph Length of first accel/decel lane 150 ft Length of second accel/decel lane ft Adjacent Ramp Data (if one exists) Does adjacent ramp exist? Volume on adjacent ramp Position of adjacent ramp Type of adjacent ramp Distance to adjacent ramp No vph ft Conversion to pc/h Under Base Conditions Junction Components Freeway Ramp Adjacent Ramp Volume, V (vph) vph Peak-hour factor, PHF Peak 15-min volume, v v Trucks and buses 9 2 % Recreational vehicles 0 0 % Terrain type: Level Level Grade 0.00 % 0.00 % % Length 0.00 mi 0.00 mi mi Trucks and buses PCE, ET Recreational vehicle PCE, ER
248 Heavy vehicle adjustment, fhv Driver population factor, fp Flow rate, vp pcph Estimation of V12 Diverge Areas L = (Equation or 13-13) EQ P = Using Equation 9 FD v = v + (v - v ) P = 3014 pc/h 12 R F R FD Capacity Checks Actual Maximum LOS F? v = v No Fi F v = v - v No FO F R v No R v or v 1582 pc/h (Equation or 13-17) Is v or v > 2700 pc/h? No Is v or v > 1.5 v /2 No 12 If yes, v = 3014 (Equation 13-15, 13-16, 13-18, or 13-19) 12A Flow Entering Diverge Influence Area Actual Max Desirable Violation? v No 12 Level of Service Determination (if not F) Density, D = v L = 28.8 pc/mi/ln R 12 D Level of service for ramp-freeway junction areas of influence D Speed Estimation Intermediate speed variable, D = S Space mean speed in ramp influence area, S = 54.5 mph R Space mean speed in outer lanes, S = 69.0 mph 0 Space mean speed for all vehicles, S = 58.8 mph
249 HCS 2010: Freeway Merge and Diverge Segments Release 6.80 Phone: Fax: Merge Analysis Analyst: Makinzie Clark Agency/Co.: Omni-Means Date performed: 6/8/2016 Analysis time period: AM Peak Hour Freeway/Dir of Travel: I-80 Westbound Junction: Rocklin Road On Ramp Jurisdiction: Caltrans Analysis Year: Existing Plus Approved Pending Description: Sierra Gateway Apartments TIS Freeway Data Type of analysis Merge Number of lanes in freeway 3 Free-flow speed on freeway 65.0 mph Volume on freeway 3755 vph On Ramp Data Side of freeway Right Number of lanes in ramp 1 Free-flow speed on ramp 35.0 mph Volume on ramp 830 vph Length of first accel/decel lane 750 ft Length of second accel/decel lane ft Adjacent Ramp Data (if one exists) Does adjacent ramp exist? Volume on adjacent Ramp Position of adjacent Ramp Type of adjacent Ramp Distance to adjacent Ramp No vph ft Conversion to pc/h Under Base Conditions Junction Components Freeway Ramp Adjacent Ramp Volume, V (vph) vph Peak-hour factor, PHF Peak 15-min volume, v v Trucks and buses 9 2 % Recreational vehicles 0 0 % Terrain type: Level Level Grade % % % Length mi mi mi Trucks and buses PCE, ET Recreational vehicle PCE, ER
250 Heavy vehicle adjustment, fhv Driver population factor, fp Flow rate, vp pcph Estimation of V12 Merge Areas L = (Equation 13-6 or 13-7) EQ P = Using Equation 3 FM v = v (P ) = 2553 pc/h 12 F FM Capacity Checks Actual Maximum LOS F? v No FO v or v 1712 pc/h (Equation or 13-17) Is v or v > 2700 pc/h? No Is v or v > 1.5 v /2 Yes 12 If yes, v = 2553 (Equation 13-15, 13-16, 13-18, or 13-19) 12A Flow Entering Merge Influence Area Actual Max Desirable Violation? v No 12A Level of Service Determination (if not F) Density, D = v v L = 27.2 R R 12 A Level of service for ramp-freeway junction areas of influence C pc/mi/ln Speed Estimation Intermediate speed variable, M = S Space mean speed in ramp influence area, S = 56.0 mph R Space mean speed in outer lanes, S = 60.6 mph 0 Space mean speed for all vehicles, S = 57.5 mph
251 HCS 2010: Basic Freeway Segments Release 6.80 Phone: Fax: Operational Analysis Analyst: Makinzie Clark Agency or Company: Omni-Means Date Performed: 6/8/2016 Analysis Time Period: AM Peak Hour Freeway/Direction: I-80 Westbound From/To: South of Rocklin Road Jurisdiction: Caltrans Analysis Year: Existing Plus Approved Pending Description: Sierra Gateway Apartments TIS Flow Inputs and Adjustments Volume, V 4585 veh/h Peak-hour factor, PHF 0.92 Peak 15-min volume, v v Trucks and buses 9 % Recreational vehicles 0 % Terrain type: Level Grade - % Segment length - mi Trucks and buses PCE, ET 1.5 Recreational vehicle PCE, ER 1.2 Heavy vehicle adjustment, fhv Driver population factor, fp 1.00 Flow rate, vp 1736 pc/h/ln Speed Inputs and Adjustments Lane width - ft Right-side lateral clearance - ft Total ramp density, TRD - ramps/mi Number of lanes, N 3 Free-flow speed: Measured FFS or BFFS 65.0 mi/h Lane width adjustment, flw - mi/h Lateral clearance adjustment, flc - mi/h TRD adjustment - mi/h Free-flow speed, FFS 65.0 mi/h LOS and Performance Measures Flow rate, vp 1736 pc/h/ln Free-flow speed, FFS 65.0 mi/h Average passenger-car speed, S 63.4 mi/h Number of lanes, N 3 Density, D 27.4 pc/mi/ln Level of service, LOS D
252 HCS 2010: Basic Freeway Segments Release 6.70 Phone: Fax: Operational Analysis Analyst: Makinzie Clark Agency or Company: Omni-Means Date Performed: 6/8/2016 Analysis Time Period: AM Peak Freeway/Direction: I-80 Eastbound From/To: Rocklin Rd/Sierra College Blvd Jurisdiction: Caltrans Analysis Year: Existing Plus Approved Pending Description: Sierra Gateway Apartments TIS Flow Inputs and Adjustments Volume, V 2884 veh/h Peak-hour factor, PHF 0.92 Peak 15-min volume, v v Trucks and buses 9 % Recreational vehicles 0 % Terrain type: Level Grade - % Segment length - mi Trucks and buses PCE, ET 1.5 Recreational vehicle PCE, ER 1.2 Heavy vehicle adjustment, fhv Driver population factor, fp 1.00 Flow rate, vp 1092 pc/h/ln Speed Inputs and Adjustments Lane width - ft Right-side lateral clearance - ft Total ramp density, TRD - ramps/mi Number of lanes, N 3 Free-flow speed: Measured FFS or BFFS 65.0 mi/h Lane width adjustment, flw - mi/h Lateral clearance adjustment, flc - mi/h TRD adjustment - mi/h Free-flow speed, FFS 65.0 mi/h LOS and Performance Measures Flow rate, vp 1092 pc/h/ln Free-flow speed, FFS 65.0 mi/h Average passenger-car speed, S 65.0 mi/h Number of lanes, N 3 Density, D 16.8 pc/mi/ln Level of service, LOS B
253 HCS 2010: Freeway Merge and Diverge Segments Release 6.70 Phone: Fax: Diverge Analysis Analyst: Makinzie Clark Agency/Co.: Omni-Means Date performed: 6/8/2016 Analysis time period: AM Peak Hour Freeway/Dir of Travel: I-80 Eastound Junction: Sierra College Blvd Off Ramp Jurisdiction: Caltrans Analysis Year: Existing Plus Approved Pending Description: Sierra Gateway Apartments TIS Freeway Data Type of analysis Diverge Number of lanes in freeway 3 Free-flow speed on freeway 65.0 mph Volume on freeway 2884 vph Off Ramp Data Side of freeway Right Number of lanes in ramp 1 Free-Flow speed on ramp 35.0 mph Volume on ramp 680 vph Length of first accel/decel lane 150 ft Length of second accel/decel lane ft Adjacent Ramp Data (if one exists) Does adjacent ramp exist? Yes Volume on adjacent ramp 185 vph Position of adjacent ramp Downstream Type of adjacent ramp On Distance to adjacent ramp 1560 ft Conversion to pc/h Under Base Conditions Junction Components Freeway Ramp Adjacent Ramp Volume, V (vph) vph Peak-hour factor, PHF Peak 15-min volume, v v Trucks and buses % Recreational vehicles % Terrain type: Level Level Level Grade 0.00 % 0.00 % 0.00 % Length 0.00 mi 0.00 mi 0.00 mi Trucks and buses PCE, ET Recreational vehicle PCE, ER
254 Heavy vehicle adjustment, fhv Driver population factor, fp Flow rate, vp pcph Estimation of V12 Diverge Areas L = (Equation or 13-13) EQ P = Using Equation 9 FD v = v + (v - v ) P = 2383 pc/h 12 R F R FD Capacity Checks Actual Maximum LOS F? v = v No Fi F v = v - v No FO F R v No R v or v 893 pc/h (Equation or 13-17) Is v or v > 2700 pc/h? No Is v or v > 1.5 v /2 No 12 If yes, v = 2383 (Equation 13-15, 13-16, 13-18, or 13-19) 12A Flow Entering Diverge Influence Area Actual Max Desirable Violation? v No 12 Level of Service Determination (if not F) Density, D = v L = 23.4 pc/mi/ln R 12 D Level of service for ramp-freeway junction areas of influence C Speed Estimation Intermediate speed variable, D = S Space mean speed in ramp influence area, S = 53.5 mph R Space mean speed in outer lanes, S = 71.3 mph 0 Space mean speed for all vehicles, S = 57.4 mph
255 HCS 2010: Freeway Merge and Diverge Segments Release 6.70 Phone: Fax: Merge Analysis Analyst: Makinzie Clark Agency/Co.: Omni-Means Date performed: 6/8/2016 Analysis time period: AM Peak Hour Freeway/Dir of Travel: I-80 Eastbound Junction: Sierra College Blvd On Loop Jurisdiction: Caltrans Analysis Year: Existing Plus Approved Pending Description: Sierra Gateway Apartments TIS Freeway Data Type of analysis Merge Number of lanes in freeway 3 Free-flow speed on freeway 65.0 mph Volume on freeway 2204 vph On Ramp Data Side of freeway Right Number of lanes in ramp 1 Free-flow speed on ramp 25.0 mph Volume on ramp 185 vph Length of first accel/decel lane 800 ft Length of second accel/decel lane ft Adjacent Ramp Data (if one exists) Does adjacent ramp exist? Yes Volume on adjacent Ramp 450 vph Position of adjacent Ramp Downstream Type of adjacent Ramp On Distance to adjacent Ramp 1420 ft Conversion to pc/h Under Base Conditions Junction Components Freeway Ramp Adjacent Ramp Volume, V (vph) vph Peak-hour factor, PHF Peak 15-min volume, v v Trucks and buses % Recreational vehicles % Terrain type: Level Level Level Grade % % % Length mi mi mi Trucks and buses PCE, ET Recreational vehicle PCE, ER
256 Heavy vehicle adjustment, fhv Driver population factor, fp Flow rate, vp pcph Estimation of V12 Merge Areas L = (Equation 13-6 or 13-7) EQ P = Using Equation 3 FM v = v (P ) = 1502 pc/h 12 F FM Capacity Checks Actual Maximum LOS F? v No FO v or v 1001 pc/h (Equation or 13-17) Is v or v > 2700 pc/h? No Is v or v > 1.5 v /2 Yes 12 If yes, v = 1502 (Equation 13-15, 13-16, 13-18, or 13-19) 12A Flow Entering Merge Influence Area Actual Max Desirable Violation? v No 12A Level of Service Determination (if not F) Density, D = v v L = 13.7 pc/mi/ln R R 12 A Level of service for ramp-freeway junction areas of influence B Speed Estimation Intermediate speed variable, M = S Space mean speed in ramp influence area, S = 58.0 mph R Space mean speed in outer lanes, S = 63.2 mph 0 Space mean speed for all vehicles, S = 59.8 mph
257 HCS 2010: Freeway Merge and Diverge Segments Release 6.70 Phone: Fax: Merge Analysis Analyst: Makinzie Clark Agency/Co.: Omni-Means Date performed: 6/8/2016 Analysis time period: AM Peak Hour Freeway/Dir of Travel: I-80 Eastbound Junction: Sierra College Blvd On Ramp Jurisdiction: Caltrans Analysis Year: Existing Plus Approved Pending Description: Sierra Gateway Apartments TIS Freeway Data Type of analysis Merge Number of lanes in freeway 3 Free-flow speed on freeway 65.0 mph Volume on freeway 2389 vph On Ramp Data Side of freeway Right Number of lanes in ramp 1 Free-flow speed on ramp 35.0 mph Volume on ramp 450 vph Length of first accel/decel lane 700 ft Length of second accel/decel lane ft Adjacent Ramp Data (if one exists) Does adjacent ramp exist? Yes Volume on adjacent Ramp 185 vph Position of adjacent Ramp Upstream Type of adjacent Ramp On Distance to adjacent Ramp 1420 ft Conversion to pc/h Under Base Conditions Junction Components Freeway Ramp Adjacent Ramp Volume, V (vph) vph Peak-hour factor, PHF Peak 15-min volume, v v Trucks and buses % Recreational vehicles % Terrain type: Level Level Level Grade % % % Length mi mi mi Trucks and buses PCE, ET Recreational vehicle PCE, ER
258 Heavy vehicle adjustment, fhv Driver population factor, fp Flow rate, vp pcph Estimation of V12 Merge Areas L = (Equation 13-6 or 13-7) EQ P = Using Equation 3 FM v = v (P ) = 1621 pc/h 12 F FM Capacity Checks Actual Maximum LOS F? v No FO v or v 1093 pc/h (Equation or 13-17) Is v or v > 2700 pc/h? No Is v or v > 1.5 v /2 Yes 12 If yes, v = 1621 (Equation 13-15, 13-16, 13-18, or 13-19) 12A Flow Entering Merge Influence Area Actual Max Desirable Violation? v No 12A Level of Service Determination (if not F) Density, D = v v L = 17.5 pc/mi/ln R R 12 A Level of service for ramp-freeway junction areas of influence B Speed Estimation Intermediate speed variable, M = S Space mean speed in ramp influence area, S = 58.0 mph R Space mean speed in outer lanes, S = 62.9 mph 0 Space mean speed for all vehicles, S = 59.5 mph
259 HCS 2010: Basic Freeway Segments Release 6.70 Phone: Fax: Operational Analysis Analyst: Makinzie Clark Agency or Company: Omni-Means Date Performed: 6/8/2016 Analysis Time Period: AM Peak Hour Freeway/Direction: I-80 Eastbound From/To: North of Sierra College Blvd Jurisdiction: Caltrans Analysis Year: Existing Plus Approved Pending Description: Sierra Gateway Apartments TIS Flow Inputs and Adjustments Volume, V 2839 veh/h Peak-hour factor, PHF 0.92 Peak 15-min volume, v v Trucks and buses 9 % Recreational vehicles 0 % Terrain type: Level Grade - % Segment length - mi Trucks and buses PCE, ET 1.5 Recreational vehicle PCE, ER 1.2 Heavy vehicle adjustment, fhv Driver population factor, fp 1.00 Flow rate, vp 1075 pc/h/ln Speed Inputs and Adjustments Lane width - ft Right-side lateral clearance - ft Total ramp density, TRD - ramps/mi Number of lanes, N 3 Free-flow speed: Measured FFS or BFFS 65.0 mi/h Lane width adjustment, flw - mi/h Lateral clearance adjustment, flc - mi/h TRD adjustment - mi/h Free-flow speed, FFS 65.0 mi/h LOS and Performance Measures Flow rate, vp 1075 pc/h/ln Free-flow speed, FFS 65.0 mi/h Average passenger-car speed, S 65.0 mi/h Number of lanes, N 3 Density, D 16.5 pc/mi/ln Level of service, LOS B
260 HCS 2010: Basic Freeway Segments Release 6.70 Phone: Fax: Operational Analysis Analyst: Makinzie Clark Agency or Company: Omni-Means Date Performed: 6/8/2016 Analysis Time Period: AM Peak Hour Freeway/Direction: I-80 Westbound From/To: North of Sierra College Blvd Jurisdiction: Caltrans Analysis Year: Existing Plus Approved Pending Description: Sierra Gateway Apartments TIS Flow Inputs and Adjustments Volume, V 4456 veh/h Peak-hour factor, PHF 0.92 Peak 15-min volume, v v Trucks and buses 9 % Recreational vehicles 0 % Terrain type: Level Grade - % Segment length - mi Trucks and buses PCE, ET 1.5 Recreational vehicle PCE, ER 1.2 Heavy vehicle adjustment, fhv Driver population factor, fp 1.00 Flow rate, vp 1687 pc/h/ln Speed Inputs and Adjustments Lane width - ft Right-side lateral clearance - ft Total ramp density, TRD - ramps/mi Number of lanes, N 3 Free-flow speed: Measured FFS or BFFS 65.0 mi/h Lane width adjustment, flw - mi/h Lateral clearance adjustment, flc - mi/h TRD adjustment - mi/h Free-flow speed, FFS 65.0 mi/h LOS and Performance Measures Flow rate, vp 1687 pc/h/ln Free-flow speed, FFS 65.0 mi/h Average passenger-car speed, S 63.8 mi/h Number of lanes, N 3 Density, D 26.4 pc/mi/ln Level of service, LOS D
261 HCS 2010: Freeway Merge and Diverge Segments Release 6.70 Phone: Fax: Diverge Analysis Analyst: Makinzie Clark Agency/Co.: Omni-Means Date performed: 6/8/2016 Analysis time period: AM Peak Hour Freeway/Dir of Travel: I-80 Westbound Junction: Sierra College Blvd Off Ramp Jurisdiction: Caltrans Analysis Year: Existing Plus Approved Pending Description: Sierra Gateway Apartments TIS Freeway Data Type of analysis Diverge Number of lanes in freeway 3 Free-flow speed on freeway 65.0 mph Volume on freeway 4456 vph Off Ramp Data Side of freeway Right Number of lanes in ramp 1 Free-Flow speed on ramp 35.0 mph Volume on ramp 900 vph Length of first accel/decel lane 650 ft Length of second accel/decel lane ft Adjacent Ramp Data (if one exists) Does adjacent ramp exist? Yes Volume on adjacent ramp 150 vph Position of adjacent ramp Downstream Type of adjacent ramp On Distance to adjacent ramp 1650 ft Conversion to pc/h Under Base Conditions Junction Components Freeway Ramp Adjacent Ramp Volume, V (vph) vph Peak-hour factor, PHF Peak 15-min volume, v v Trucks and buses % Recreational vehicles % Terrain type: Level Level Level Grade 0.00 % 0.00 % 0.00 % Length 0.00 mi 0.00 mi 0.00 mi Trucks and buses PCE, ET Recreational vehicle PCE, ER
262 Heavy vehicle adjustment, fhv Driver population factor, fp Flow rate, vp pcph Estimation of V12 Diverge Areas L = (Equation or 13-13) EQ P = Using Equation 9 FD v = v + (v - v ) P = 3407 pc/h 12 R F R FD Capacity Checks Actual Maximum LOS F? v = v No Fi F v = v - v No FO F R v No R v or v 1654 pc/h (Equation or 13-17) Is v or v > 2700 pc/h? No Is v or v > 1.5 v /2 No 12 If yes, v = 3407 (Equation 13-15, 13-16, 13-18, or 13-19) 12A Flow Entering Diverge Influence Area Actual Max Desirable Violation? v No 12 Level of Service Determination (if not F) Density, D = v L = 27.7 pc/mi/ln R 12 D Level of service for ramp-freeway junction areas of influence C Speed Estimation Intermediate speed variable, D = S Space mean speed in ramp influence area, S = 52.9 mph R Space mean speed in outer lanes, S = 68.8 mph 0 Space mean speed for all vehicles, S = 57.2 mph
263 HCS 2010: Freeway Merge and Diverge Segments Release 6.70 Phone: Fax: Merge Analysis Analyst: Makinzie Clark Agency/Co.: Omni-Means Date performed: 6/8/2016 Analysis time period: AM Peak Hour Freeway/Dir of Travel: I-80 Westbound Junction: Sierra College Blvd On Loop Jurisdiction: Caltrans Analysis Year: Existing Plus Approved Pending Description: Sierra Gateway Apartments TIS Freeway Data Type of analysis Merge Number of lanes in freeway 3 Free-flow speed on freeway 65.0 mph Volume on freeway 3556 vph On Ramp Data Side of freeway Right Number of lanes in ramp 1 Free-flow speed on ramp 25.0 mph Volume on ramp 150 vph Length of first accel/decel lane 700 ft Length of second accel/decel lane ft Adjacent Ramp Data (if one exists) Does adjacent ramp exist? Yes Volume on adjacent Ramp 340 vph Position of adjacent Ramp Downstream Type of adjacent Ramp On Distance to adjacent Ramp 1560 ft Conversion to pc/h Under Base Conditions Junction Components Freeway Ramp Adjacent Ramp Volume, V (vph) vph Peak-hour factor, PHF Peak 15-min volume, v v Trucks and buses % Recreational vehicles % Terrain type: Level Level Level Grade % % % Length mi mi mi Trucks and buses PCE, ET Recreational vehicle PCE, ER
264 Heavy vehicle adjustment, fhv Driver population factor, fp Flow rate, vp pcph Estimation of V12 Merge Areas L = (Equation 13-6 or 13-7) EQ P = Using Equation 3 FM v = v (P ) = 2412 pc/h 12 F FM Capacity Checks Actual Maximum LOS F? v No FO v or v 1627 pc/h (Equation or 13-17) Is v or v > 2700 pc/h? No Is v or v > 1.5 v /2 Yes 12 If yes, v = 2412 (Equation 13-15, 13-16, 13-18, or 13-19) 12A Flow Entering Merge Influence Area Actual Max Desirable Violation? v No 12A Level of Service Determination (if not F) Density, D = v v L = 21.2 pc/mi/ln R R 12 A Level of service for ramp-freeway junction areas of influence C Speed Estimation Intermediate speed variable, M = S Space mean speed in ramp influence area, S = 57.2 mph R Space mean speed in outer lanes, S = 60.9 mph 0 Space mean speed for all vehicles, S = 58.6 mph
265 HCS 2010: Freeway Merge and Diverge Segments Release 6.70 Phone: Fax: Merge Analysis Analyst: Makinzie Clark Agency/Co.: Omni-Means Date performed: 6/8/2016 Analysis time period: AM Peak Hour Freeway/Dir of Travel: I-80 Westbound Junction: Sierra College Blvd On Ramp Jurisdiction: Caltrans Analysis Year: Existing Plus Approved Pending Description: Sierra Gateway Apartments TIS Freeway Data Type of analysis Merge Number of lanes in freeway 3 Free-flow speed on freeway 65.0 mph Volume on freeway 3706 vph On Ramp Data Side of freeway Right Number of lanes in ramp 1 Free-flow speed on ramp 35.0 mph Volume on ramp 340 vph Length of first accel/decel lane 700 ft Length of second accel/decel lane ft Adjacent Ramp Data (if one exists) Does adjacent ramp exist? Yes Volume on adjacent Ramp 150 vph Position of adjacent Ramp Upstream Type of adjacent Ramp On Distance to adjacent Ramp 1560 ft Conversion to pc/h Under Base Conditions Junction Components Freeway Ramp Adjacent Ramp Volume, V (vph) vph Peak-hour factor, PHF Peak 15-min volume, v v Trucks and buses % Recreational vehicles % Terrain type: Level Level Level Grade % % % Length mi mi mi Trucks and buses PCE, ET Recreational vehicle PCE, ER
266 Heavy vehicle adjustment, fhv Driver population factor, fp Flow rate, vp pcph Estimation of V12 Merge Areas L = (Equation 13-6 or 13-7) EQ P = Using Equation 3 FM v = v (P ) = 2514 pc/h 12 F FM Capacity Checks Actual Maximum LOS F? v No FO v or v 1696 pc/h (Equation or 13-17) Is v or v > 2700 pc/h? No Is v or v > 1.5 v /2 Yes 12 If yes, v = 2514 (Equation 13-15, 13-16, 13-18, or 13-19) 12A Flow Entering Merge Influence Area Actual Max Desirable Violation? v No 12A Level of Service Determination (if not F) Density, D = v v L = 23.7 pc/mi/ln R R 12 A Level of service for ramp-freeway junction areas of influence C Speed Estimation Intermediate speed variable, M = S Space mean speed in ramp influence area, S = 57.1 mph R Space mean speed in outer lanes, S = 60.7 mph 0 Space mean speed for all vehicles, S = 58.3 mph
267 HCS 2010: Basic Freeway Segments Release 6.70 Phone: Fax: Operational Analysis Analyst: Makinzie Clark Agency or Company: Omni-Means Date Performed: 6/8/2016 Analysis Time Period: AM Peak Hour Freeway/Direction: I-80 Westbound From/To: Sierra College Blvd/Rocklin Rd Jurisdiction: Caltrans Analysis Year: Existing Plus Approved Pending Description: Sierra Gateway Apartments TIS Flow Inputs and Adjustments Volume, V 4046 veh/h Peak-hour factor, PHF 0.92 Peak 15-min volume, v v Trucks and buses 9 % Recreational vehicles 0 % Terrain type: Level Grade - % Segment length - mi Trucks and buses PCE, ET 1.5 Recreational vehicle PCE, ER 1.2 Heavy vehicle adjustment, fhv Driver population factor, fp 1.00 Flow rate, vp 1532 pc/h/ln Speed Inputs and Adjustments Lane width - ft Right-side lateral clearance - ft Total ramp density, TRD - ramps/mi Number of lanes, N 3 Free-flow speed: Measured FFS or BFFS 65.0 mi/h Lane width adjustment, flw - mi/h Lateral clearance adjustment, flc - mi/h TRD adjustment - mi/h Free-flow speed, FFS 65.0 mi/h LOS and Performance Measures Flow rate, vp 1532 pc/h/ln Free-flow speed, FFS 65.0 mi/h Average passenger-car speed, S 64.8 mi/h Number of lanes, N 3 Density, D 23.7 pc/mi/ln Level of service, LOS C
268 HCS 2010: Basic Freeway Segments Release 6.80 Phone: Fax: Operational Analysis Analyst: Makinzie Clark Agency or Company: Omni-Means Date Performed: 6/8/2016 Analysis Time Period: PM Peak Hour Freeway/Direction: I-80 Eastbound From/To: South of Rocklin Road Jurisdiction: Caltrans Analysis Year: Existing Plus Approved Pending Description: Sierra Gateway Apartments TIS Flow Inputs and Adjustments Volume, V 5005 veh/h Peak-hour factor, PHF 0.92 Peak 15-min volume, v v Trucks and buses 9 % Recreational vehicles 0 % Terrain type: Level Grade - % Segment length - mi Trucks and buses PCE, ET 1.5 Recreational vehicle PCE, ER 1.2 Heavy vehicle adjustment, fhv Driver population factor, fp 1.00 Flow rate, vp 1895 pc/h/ln Speed Inputs and Adjustments Lane width - ft Right-side lateral clearance - ft Total ramp density, TRD - ramps/mi Number of lanes, N 3 Free-flow speed: Measured FFS or BFFS 65.0 mi/h Lane width adjustment, flw - mi/h Lateral clearance adjustment, flc - mi/h TRD adjustment - mi/h Free-flow speed, FFS 65.0 mi/h LOS and Performance Measures Flow rate, vp 1895 pc/h/ln Free-flow speed, FFS 65.0 mi/h Average passenger-car speed, S 61.5 mi/h Number of lanes, N 3 Density, D 30.8 pc/mi/ln Level of service, LOS D
269 HCS 2010: Freeway Merge and Diverge Segments Release 6.80 Phone: Fax: Diverge Analysis Analyst: Makinzie Clark Agency/Co.: Omni-Means Date performed: 6/8/2016 Analysis time period: PM Peak Hour Freeway/Dir of Travel: I-80 Eastbound Junction: Rocklin Road Off Ramp Jurisdiction: Caltrans Analysis Year: Existing Plus Approved Pending Description: Sierra Gateway Apartments TIS Freeway Data Type of analysis Diverge Number of lanes in freeway 3 Free-flow speed on freeway 65.0 mph Volume on freeway 5005 vph Off Ramp Data Side of freeway Right Number of lanes in ramp 1 Free-Flow speed on ramp 35.0 mph Volume on ramp 1082 vph Length of first accel/decel lane 892 ft Length of second accel/decel lane ft Adjacent Ramp Data (if one exists) Does adjacent ramp exist? Volume on adjacent ramp Position of adjacent ramp Type of adjacent ramp Distance to adjacent ramp No vph ft Conversion to pc/h Under Base Conditions Junction Components Freeway Ramp Adjacent Ramp Volume, V (vph) vph Peak-hour factor, PHF Peak 15-min volume, v v Trucks and buses 9 2 % Recreational vehicles 0 0 % Terrain type: Level Level Grade 0.00 % 0.00 % % Length 0.00 mi 0.00 mi mi Trucks and buses PCE, ET Recreational vehicle PCE, ER
270 Heavy vehicle adjustment, fhv Driver population factor, fp Flow rate, vp pcph Estimation of V12 Diverge Areas L = (Equation or 13-13) EQ P = Using Equation 9 FD v = v + (v - v ) P = 3709 pc/h 12 R F R FD Capacity Checks Actual Maximum LOS F? v = v No Fi F v = v - v No FO F R v No R v or v 1976 pc/h (Equation or 13-17) Is v or v > 2700 pc/h? No Is v or v > 1.5 v /2 No 12 If yes, v = 3709 (Equation 13-15, 13-16, 13-18, or 13-19) 12A Flow Entering Diverge Influence Area Actual Max Desirable Violation? v No 12 Level of Service Determination (if not F) Density, D = v L = 28.1 pc/mi/ln R 12 D Level of service for ramp-freeway junction areas of influence D Speed Estimation Intermediate speed variable, D = S Space mean speed in ramp influence area, S = 52.8 mph R Space mean speed in outer lanes, S = 67.5 mph 0 Space mean speed for all vehicles, S = 57.1 mph
271 HCS 2010: Freeway Merge and Diverge Segments Release 6.80 Phone: Fax: Merge Analysis Analyst: Makinzie Clark Agency/Co.: Omni-Means Date performed: 6/8/2016 Analysis time period: PM Peak Hour Freeway/Dir of Travel: I-80 Eastbound Junction: Rocklin Road On Ramp Jurisdiction: Caltrans Analysis Year: Existing Plus Approved Pending Description: Sierra Gateway Apartments TIS Freeway Data Type of analysis Merge Number of lanes in freeway 3 Free-flow speed on freeway 65.0 mph Volume on freeway 3923 vph On Ramp Data Side of freeway Right Number of lanes in ramp 1 Free-flow speed on ramp 35.0 mph Volume on ramp 282 vph Length of first accel/decel lane 360 ft Length of second accel/decel lane ft Adjacent Ramp Data (if one exists) Does adjacent ramp exist? Volume on adjacent Ramp Position of adjacent Ramp Type of adjacent Ramp Distance to adjacent Ramp No vph ft Conversion to pc/h Under Base Conditions Junction Components Freeway Ramp Adjacent Ramp Volume, V (vph) vph Peak-hour factor, PHF Peak 15-min volume, v v Trucks and buses 9 2 % Recreational vehicles 0 0 % Terrain type: Level Level Grade % % % Length mi mi mi Trucks and buses PCE, ET Recreational vehicle PCE, ER
272 Heavy vehicle adjustment, fhv Driver population factor, fp Flow rate, vp pcph Estimation of V12 Merge Areas L = (Equation 13-6 or 13-7) EQ P = Using Equation 3 FM v = v (P ) = 2618 pc/h 12 F FM Capacity Checks Actual Maximum LOS F? v No FO v or v 1838 pc/h (Equation or 13-17) Is v or v > 2700 pc/h? No Is v or v > 1.5 v /2 Yes 12 If yes, v = 2618 (Equation 13-15, 13-16, 13-18, or 13-19) 12A Flow Entering Merge Influence Area Actual Max Desirable Violation? v No 12A Level of Service Determination (if not F) Density, D = v v L = 25.8 R R 12 A Level of service for ramp-freeway junction areas of influence C pc/mi/ln Speed Estimation Intermediate speed variable, M = S Space mean speed in ramp influence area, S = 56.5 mph R Space mean speed in outer lanes, S = 60.2 mph 0 Space mean speed for all vehicles, S = 57.9 mph
273 HCS 2010: Freeway Merge and Diverge Segments Release 6.80 Phone: Fax: Diverge Analysis Analyst: Makinzie Clark Agency/Co.: Omni-Means Date performed: 6/8/2016 Analysis time period: PM Peak Hour Freeway/Dir of Travel: I-80 Westbound Junction: Rocklin Road Off Ramp Jurisdiction: Caltrans Analysis Year: Existing Plus Approved Pending Description: Sierra Gateway Apartments TIS Freeway Data Type of analysis Diverge Number of lanes in freeway 3 Free-flow speed on freeway 65.0 mph Volume on freeway 3504 vph Off Ramp Data Side of freeway Right Number of lanes in ramp 1 Free-Flow speed on ramp 35.0 mph Volume on ramp 363 vph Length of first accel/decel lane 150 ft Length of second accel/decel lane ft Adjacent Ramp Data (if one exists) Does adjacent ramp exist? Volume on adjacent ramp Position of adjacent ramp Type of adjacent ramp Distance to adjacent ramp No vph ft Conversion to pc/h Under Base Conditions Junction Components Freeway Ramp Adjacent Ramp Volume, V (vph) vph Peak-hour factor, PHF Peak 15-min volume, v v Trucks and buses 9 2 % Recreational vehicles 0 0 % Terrain type: Level Level Grade 0.00 % 0.00 % % Length 0.00 mi 0.00 mi mi Trucks and buses PCE, ET Recreational vehicle PCE, ER
274 Heavy vehicle adjustment, fhv Driver population factor, fp Flow rate, vp pcph Estimation of V12 Diverge Areas L = (Equation or 13-13) EQ P = Using Equation 9 FD v = v + (v - v ) P = 2693 pc/h 12 R F R FD Capacity Checks Actual Maximum LOS F? v = v No Fi F v = v - v No FO F R v No R v or v 1287 pc/h (Equation or 13-17) Is v or v > 2700 pc/h? No Is v or v > 1.5 v /2 No 12 If yes, v = 2693 (Equation 13-15, 13-16, 13-18, or 13-19) 12A Flow Entering Diverge Influence Area Actual Max Desirable Violation? v No 12 Level of Service Determination (if not F) Density, D = v L = 26.1 pc/mi/ln R 12 D Level of service for ramp-freeway junction areas of influence C Speed Estimation Intermediate speed variable, D = S Space mean speed in ramp influence area, S = 54.4 mph R Space mean speed in outer lanes, S = 70.2 mph 0 Space mean speed for all vehicles, S = 58.7 mph
275 HCS 2010: Freeway Merge and Diverge Segments Release 6.80 Phone: Fax: Merge Analysis Analyst: Makinzie Clark Agency/Co.: Omni-Means Date performed: 6/8/2016 Analysis time period: PM Peak Hour Freeway/Dir of Travel: I-80 Westbound Junction: Rocklin Road On Ramp Jurisdiction: Caltrans Analysis Year: Existing Plus Approved Pending Description: Sierra Gateway Apartments TIS Freeway Data Type of analysis Merge Number of lanes in freeway 3 Free-flow speed on freeway 65.0 mph Volume on freeway 3141 vph On Ramp Data Side of freeway Right Number of lanes in ramp 1 Free-flow speed on ramp 35.0 mph Volume on ramp 1203 vph Length of first accel/decel lane 760 ft Length of second accel/decel lane ft Adjacent Ramp Data (if one exists) Does adjacent ramp exist? Volume on adjacent Ramp Position of adjacent Ramp Type of adjacent Ramp Distance to adjacent Ramp No vph ft Conversion to pc/h Under Base Conditions Junction Components Freeway Ramp Adjacent Ramp Volume, V (vph) vph Peak-hour factor, PHF Peak 15-min volume, v v Trucks and buses 9 2 % Recreational vehicles 0 0 % Terrain type: Level Level Grade % % % Length mi mi mi Trucks and buses PCE, ET Recreational vehicle PCE, ER
276 Heavy vehicle adjustment, fhv Driver population factor, fp Flow rate, vp pcph Estimation of V12 Merge Areas L = (Equation 13-6 or 13-7) EQ P = Using Equation 3 FM v = v (P ) = 2136 pc/h 12 F FM Capacity Checks Actual Maximum LOS F? v No FO v or v 1432 pc/h (Equation or 13-17) Is v or v > 2700 pc/h? No Is v or v > 1.5 v /2 Yes 12 If yes, v = 2136 (Equation 13-15, 13-16, 13-18, or 13-19) 12A Flow Entering Merge Influence Area Actual Max Desirable Violation? v No 12A Level of Service Determination (if not F) Density, D = v v L = 26.4 R R 12 A Level of service for ramp-freeway junction areas of influence C pc/mi/ln Speed Estimation Intermediate speed variable, M = S Space mean speed in ramp influence area, S = 56.3 mph R Space mean speed in outer lanes, S = 61.6 mph 0 Space mean speed for all vehicles, S = 57.8 mph
277 HCS 2010: Basic Freeway Segments Release 6.80 Phone: Fax: Operational Analysis Analyst: Makinzie Clark Agency or Company: Omni-Means Date Performed: 6/8/2016 Analysis Time Period: PM Peak Hour Freeway/Direction: I-80 Westbound From/To: South of Rocklin Road Jurisdiction: Caltrans Analysis Year: Existing Plus Approved Pending Description: Sierra Gateway Apartments TIS Flow Inputs and Adjustments Volume, V 4344 veh/h Peak-hour factor, PHF 0.92 Peak 15-min volume, v v Trucks and buses 9 % Recreational vehicles 0 % Terrain type: Level Grade - % Segment length - mi Trucks and buses PCE, ET 1.5 Recreational vehicle PCE, ER 1.2 Heavy vehicle adjustment, fhv Driver population factor, fp 1.00 Flow rate, vp 1645 pc/h/ln Speed Inputs and Adjustments Lane width - ft Right-side lateral clearance - ft Total ramp density, TRD - ramps/mi Number of lanes, N 3 Free-flow speed: Measured FFS or BFFS 65.0 mi/h Lane width adjustment, flw - mi/h Lateral clearance adjustment, flc - mi/h TRD adjustment - mi/h Free-flow speed, FFS 65.0 mi/h LOS and Performance Measures Flow rate, vp 1645 pc/h/ln Free-flow speed, FFS 65.0 mi/h Average passenger-car speed, S 64.1 mi/h Number of lanes, N 3 Density, D 25.6 pc/mi/ln Level of service, LOS C
278 HCS 2010: Basic Freeway Segments Release 6.70 Phone: Fax: Operational Analysis Analyst: Makinzie Clark Agency or Company: Omni-Means Date Performed: 6/8/2016 Analysis Time Period: PM Peak Hour Freeway/Direction: I-80 Eastbound From/To: Rocklin Rd/Sierra College Blvd Jurisdiction: Caltrans Analysis Year: Existing Plus Approved Pending Description: Sierra Gateway Apartments TIS Flow Inputs and Adjustments Volume, V 4205 veh/h Peak-hour factor, PHF 0.92 Peak 15-min volume, v v Trucks and buses 9 % Recreational vehicles 0 % Terrain type: Level Grade - % Segment length - mi Trucks and buses PCE, ET 1.5 Recreational vehicle PCE, ER 1.2 Heavy vehicle adjustment, fhv Driver population factor, fp 1.00 Flow rate, vp 1592 pc/h/ln Speed Inputs and Adjustments Lane width - ft Right-side lateral clearance - ft Total ramp density, TRD - ramps/mi Number of lanes, N 3 Free-flow speed: Measured FFS or BFFS 65.0 mi/h Lane width adjustment, flw - mi/h Lateral clearance adjustment, flc - mi/h TRD adjustment - mi/h Free-flow speed, FFS 65.0 mi/h LOS and Performance Measures Flow rate, vp 1592 pc/h/ln Free-flow speed, FFS 65.0 mi/h Average passenger-car speed, S 64.5 mi/h Number of lanes, N 3 Density, D 24.7 pc/mi/ln Level of service, LOS C
279 HCS 2010: Freeway Merge and Diverge Segments Release 6.70 Phone: Fax: Diverge Analysis Analyst: Makinzie Clark Agency/Co.: Omni-Means Date performed: 6/8/2016 Analysis time period: PM Peak Hour Freeway/Dir of Travel: I-80 Eastound Junction: Sierra College Blvd Off Ramp Jurisdiction: Caltrans Analysis Year: Existing Plus Approved Pending Description: Sierra Gateway Apartments TIS Freeway Data Type of analysis Diverge Number of lanes in freeway 3 Free-flow speed on freeway 65.0 mph Volume on freeway 4205 vph Off Ramp Data Side of freeway Right Number of lanes in ramp 1 Free-Flow speed on ramp 35.0 mph Volume on ramp 615 vph Length of first accel/decel lane 150 ft Length of second accel/decel lane ft Adjacent Ramp Data (if one exists) Does adjacent ramp exist? Yes Volume on adjacent ramp 345 vph Position of adjacent ramp Downstream Type of adjacent ramp On Distance to adjacent ramp 1560 ft Conversion to pc/h Under Base Conditions Junction Components Freeway Ramp Adjacent Ramp Volume, V (vph) vph Peak-hour factor, PHF Peak 15-min volume, v v Trucks and buses % Recreational vehicles % Terrain type: Level Level Level Grade 0.00 % 0.00 % 0.00 % Length 0.00 mi 0.00 mi 0.00 mi Trucks and buses PCE, ET Recreational vehicle PCE, ER
280 Heavy vehicle adjustment, fhv Driver population factor, fp Flow rate, vp pcph Estimation of V12 Diverge Areas L = (Equation or 13-13) EQ P = Using Equation 9 FD v = v + (v - v ) P = 3171 pc/h 12 R F R FD Capacity Checks Actual Maximum LOS F? v = v No Fi F v = v - v No FO F R v No R v or v 1605 pc/h (Equation or 13-17) Is v or v > 2700 pc/h? No Is v or v > 1.5 v /2 No 12 If yes, v = 3171 (Equation 13-15, 13-16, 13-18, or 13-19) 12A Flow Entering Diverge Influence Area Actual Max Desirable Violation? v No 12 Level of Service Determination (if not F) Density, D = v L = 30.2 pc/mi/ln R 12 D Level of service for ramp-freeway junction areas of influence D Speed Estimation Intermediate speed variable, D = S Space mean speed in ramp influence area, S = 53.8 mph R Space mean speed in outer lanes, S = 68.9 mph 0 Space mean speed for all vehicles, S = 58.1 mph
281 HCS 2010: Freeway Merge and Diverge Segments Release 6.70 Phone: Fax: Merge Analysis Analyst: Makinzie Clark Agency/Co.: Omni-Means Date performed: 6/8/2016 Analysis time period: PM Peak Hour Freeway/Dir of Travel: I-80 Eastbound Junction: Sierra College Blvd On Loop Jurisdiction: Caltrans Analysis Year: Existing Plus Approved Pending Description: Sierra Gateway Apartments TIS Freeway Data Type of analysis Merge Number of lanes in freeway 3 Free-flow speed on freeway 65.0 mph Volume on freeway 3590 vph On Ramp Data Side of freeway Right Number of lanes in ramp 1 Free-flow speed on ramp 25.0 mph Volume on ramp 345 vph Length of first accel/decel lane 800 ft Length of second accel/decel lane ft Adjacent Ramp Data (if one exists) Does adjacent ramp exist? Yes Volume on adjacent Ramp 840 vph Position of adjacent Ramp Downstream Type of adjacent Ramp On Distance to adjacent Ramp 1420 ft Conversion to pc/h Under Base Conditions Junction Components Freeway Ramp Adjacent Ramp Volume, V (vph) vph Peak-hour factor, PHF Peak 15-min volume, v v Trucks and buses % Recreational vehicles % Terrain type: Level Level Level Grade % % % Length mi mi mi Trucks and buses PCE, ET Recreational vehicle PCE, ER
282 Heavy vehicle adjustment, fhv Driver population factor, fp Flow rate, vp pcph Estimation of V12 Merge Areas L = (Equation 13-6 or 13-7) EQ P = Using Equation 3 FM v = v (P ) = 2446 pc/h 12 F FM Capacity Checks Actual Maximum LOS F? v No FO v or v 1632 pc/h (Equation or 13-17) Is v or v > 2700 pc/h? No Is v or v > 1.5 v /2 Yes 12 If yes, v = 2446 (Equation 13-15, 13-16, 13-18, or 13-19) 12A Flow Entering Merge Influence Area Actual Max Desirable Violation? v No 12A Level of Service Determination (if not F) Density, D = v v L = 22.2 pc/mi/ln R R 12 A Level of service for ramp-freeway junction areas of influence C Speed Estimation Intermediate speed variable, M = S Space mean speed in ramp influence area, S = 57.0 mph R Space mean speed in outer lanes, S = 60.9 mph 0 Space mean speed for all vehicles, S = 58.4 mph
283 HCS 2010: Freeway Merge and Diverge Segments Release 6.70 Phone: Fax: Merge Analysis Analyst: Makinzie Clark Agency/Co.: Omni-Means Date performed: 6/8/2016 Analysis time period: PM Peak Hour Freeway/Dir of Travel: I-80 Eastbound Junction: Sierra College Blvd On Ramp Jurisdiction: Caltrans Analysis Year: Existing Plus Approved Pending Description: Sierra Gateway Apartments TIS Freeway Data Type of analysis Merge Number of lanes in freeway 3 Free-flow speed on freeway 65.0 mph Volume on freeway 3935 vph On Ramp Data Side of freeway Right Number of lanes in ramp 1 Free-flow speed on ramp 35.0 mph Volume on ramp 840 vph Length of first accel/decel lane 700 ft Length of second accel/decel lane ft Adjacent Ramp Data (if one exists) Does adjacent ramp exist? Yes Volume on adjacent Ramp 345 vph Position of adjacent Ramp Upstream Type of adjacent Ramp On Distance to adjacent Ramp 1420 ft Conversion to pc/h Under Base Conditions Junction Components Freeway Ramp Adjacent Ramp Volume, V (vph) vph Peak-hour factor, PHF Peak 15-min volume, v v Trucks and buses % Recreational vehicles % Terrain type: Level Level Level Grade % % % Length mi mi mi Trucks and buses PCE, ET Recreational vehicle PCE, ER
284 Heavy vehicle adjustment, fhv Driver population factor, fp Flow rate, vp pcph Estimation of V12 Merge Areas L = (Equation 13-6 or 13-7) EQ P = Using Equation 3 FM v = v (P ) = 2669 pc/h 12 F FM Capacity Checks Actual Maximum LOS F? v No FO v or v 1801 pc/h (Equation or 13-17) Is v or v > 2700 pc/h? No Is v or v > 1.5 v /2 Yes 12 If yes, v = 2669 (Equation 13-15, 13-16, 13-18, or 13-19) 12A Flow Entering Merge Influence Area Actual Max Desirable Violation? v No 12A Level of Service Determination (if not F) Density, D = v v L = 28.5 pc/mi/ln R R 12 A Level of service for ramp-freeway junction areas of influence D Speed Estimation Intermediate speed variable, M = S Space mean speed in ramp influence area, S = 55.6 mph R Space mean speed in outer lanes, S = 60.3 mph 0 Space mean speed for all vehicles, S = 57.1 mph
285 HCS 2010: Basic Freeway Segments Release 6.70 Phone: Fax: Operational Analysis Analyst: Makinzie Clark Agency or Company: Omni-Means Date Performed: 6/8/2016 Analysis Time Period: PM Peak Hour Freeway/Direction: I-80 Eastbound From/To: North of Sierra College Blvd Jurisdiction: Caltrans Analysis Year: Existing Plus Approved Pending Description: Sierra Gateway Apartments TIS Flow Inputs and Adjustments Volume, V 4775 veh/h Peak-hour factor, PHF 0.92 Peak 15-min volume, v v Trucks and buses 9 % Recreational vehicles 0 % Terrain type: Level Grade - % Segment length - mi Trucks and buses PCE, ET 1.5 Recreational vehicle PCE, ER 1.2 Heavy vehicle adjustment, fhv Driver population factor, fp 1.00 Flow rate, vp 1808 pc/h/ln Speed Inputs and Adjustments Lane width - ft Right-side lateral clearance - ft Total ramp density, TRD - ramps/mi Number of lanes, N 3 Free-flow speed: Measured FFS or BFFS 65.0 mi/h Lane width adjustment, flw - mi/h Lateral clearance adjustment, flc - mi/h TRD adjustment - mi/h Free-flow speed, FFS 65.0 mi/h LOS and Performance Measures Flow rate, vp 1808 pc/h/ln Free-flow speed, FFS 65.0 mi/h Average passenger-car speed, S 62.6 mi/h Number of lanes, N 3 Density, D 28.9 pc/mi/ln Level of service, LOS D
286 HCS 2010: Basic Freeway Segments Release 6.70 Phone: Fax: Operational Analysis Analyst: Makinzie Clark Agency or Company: Omni-Means Date Performed: 6/8/2016 Analysis Time Period: PM Peak Hour Freeway/Direction: I-80 Westbound From/To: North of Sierra College Blvd Jurisdiction: Caltrans Analysis Year: Existing Plus Approved Pending Description: Sierra Gateway Apartments TIS Flow Inputs and Adjustments Volume, V 3544 veh/h Peak-hour factor, PHF 0.92 Peak 15-min volume, v v Trucks and buses 9 % Recreational vehicles 0 % Terrain type: Level Grade - % Segment length - mi Trucks and buses PCE, ET 1.5 Recreational vehicle PCE, ER 1.2 Heavy vehicle adjustment, fhv Driver population factor, fp 1.00 Flow rate, vp 1342 pc/h/ln Speed Inputs and Adjustments Lane width - ft Right-side lateral clearance - ft Total ramp density, TRD - ramps/mi Number of lanes, N 3 Free-flow speed: Measured FFS or BFFS 65.0 mi/h Lane width adjustment, flw - mi/h Lateral clearance adjustment, flc - mi/h TRD adjustment - mi/h Free-flow speed, FFS 65.0 mi/h LOS and Performance Measures Flow rate, vp 1342 pc/h/ln Free-flow speed, FFS 65.0 mi/h Average passenger-car speed, S 65.0 mi/h Number of lanes, N 3 Density, D 20.6 pc/mi/ln Level of service, LOS C
287 HCS 2010: Freeway Merge and Diverge Segments Release 6.70 Phone: Fax: Diverge Analysis Analyst: Makinzie Clark Agency/Co.: Omni-Means Date performed: 6/8/2016 Analysis time period: PM Peak Hour Freeway/Dir of Travel: I-80 Westbound Junction: Sierra College Blvd Off Ramp Jurisdiction: Caltrans Analysis Year: Existing Plus Approved Pending Description: Sierra Gateway Apartments TIS Freeway Data Type of analysis Diverge Number of lanes in freeway 3 Free-flow speed on freeway 65.0 mph Volume on freeway 3544 vph Off Ramp Data Side of freeway Right Number of lanes in ramp 1 Free-Flow speed on ramp 35.0 mph Volume on ramp 745 vph Length of first accel/decel lane 650 ft Length of second accel/decel lane ft Adjacent Ramp Data (if one exists) Does adjacent ramp exist? Yes Volume on adjacent ramp 295 vph Position of adjacent ramp Downstream Type of adjacent ramp On Distance to adjacent ramp 1650 ft Conversion to pc/h Under Base Conditions Junction Components Freeway Ramp Adjacent Ramp Volume, V (vph) vph Peak-hour factor, PHF Peak 15-min volume, v v Trucks and buses % Recreational vehicles % Terrain type: Level Level Level Grade 0.00 % 0.00 % 0.00 % Length 0.00 mi 0.00 mi 0.00 mi Trucks and buses PCE, ET Recreational vehicle PCE, ER
288 Heavy vehicle adjustment, fhv Driver population factor, fp Flow rate, vp pcph Estimation of V12 Diverge Areas L = (Equation or 13-13) EQ P = Using Equation 9 FD v = v + (v - v ) P = 2807 pc/h 12 R F R FD Capacity Checks Actual Maximum LOS F? v = v No Fi F v = v - v No FO F R v No R v or v 1219 pc/h (Equation or 13-17) Is v or v > 2700 pc/h? No Is v or v > 1.5 v /2 No 12 If yes, v = 2807 (Equation 13-15, 13-16, 13-18, or 13-19) 12A Flow Entering Diverge Influence Area Actual Max Desirable Violation? v No 12 Level of Service Determination (if not F) Density, D = v L = 22.5 pc/mi/ln R 12 D Level of service for ramp-freeway junction areas of influence C Speed Estimation Intermediate speed variable, D = S Space mean speed in ramp influence area, S = 53.5 mph R Space mean speed in outer lanes, S = 70.5 mph 0 Space mean speed for all vehicles, S = 57.7 mph
289 HCS 2010: Freeway Merge and Diverge Segments Release 6.70 Phone: Fax: Merge Analysis Analyst: Makinzie Clark Agency/Co.: Omni-Means Date performed: 6/8/2016 Analysis time period: PM Peak Hour Freeway/Dir of Travel: I-80 Westbound Junction: Sierra College Blvd On Loop Jurisdiction: Caltrans Analysis Year: Existing Plus Approved Pending Description: Sierra Gateway Apartments TIS Freeway Data Type of analysis Merge Number of lanes in freeway 3 Free-flow speed on freeway 65.0 mph Volume on freeway 2799 vph On Ramp Data Side of freeway Right Number of lanes in ramp 1 Free-flow speed on ramp 25.0 mph Volume on ramp 295 vph Length of first accel/decel lane 700 ft Length of second accel/decel lane ft Adjacent Ramp Data (if one exists) Does adjacent ramp exist? Yes Volume on adjacent Ramp 410 vph Position of adjacent Ramp Downstream Type of adjacent Ramp On Distance to adjacent Ramp 1560 ft Conversion to pc/h Under Base Conditions Junction Components Freeway Ramp Adjacent Ramp Volume, V (vph) vph Peak-hour factor, PHF Peak 15-min volume, v v Trucks and buses % Recreational vehicles % Terrain type: Level Level Level Grade % % % Length mi mi mi Trucks and buses PCE, ET Recreational vehicle PCE, ER
290 Heavy vehicle adjustment, fhv Driver population factor, fp Flow rate, vp pcph Estimation of V12 Merge Areas L = (Equation 13-6 or 13-7) EQ P = Using Equation 3 FM v = v (P ) = 1898 pc/h 12 F FM Capacity Checks Actual Maximum LOS F? v No FO v or v 1281 pc/h (Equation or 13-17) Is v or v > 2700 pc/h? No Is v or v > 1.5 v /2 Yes 12 If yes, v = 1898 (Equation 13-15, 13-16, 13-18, or 13-19) 12A Flow Entering Merge Influence Area Actual Max Desirable Violation? v No 12A Level of Service Determination (if not F) Density, D = v v L = 18.2 pc/mi/ln R R 12 A Level of service for ramp-freeway junction areas of influence B Speed Estimation Intermediate speed variable, M = S Space mean speed in ramp influence area, S = 57.6 mph R Space mean speed in outer lanes, S = 62.2 mph 0 Space mean speed for all vehicles, S = 59.2 mph
291 HCS 2010: Freeway Merge and Diverge Segments Release 6.70 Phone: Fax: Merge Analysis Analyst: Makinzie Clark Agency/Co.: Omni-Means Date performed: 6/8/2016 Analysis time period: PM Peak Hour Freeway/Dir of Travel: I-80 Westbound Junction: Sierra Collge Blvd On Ramp Jurisdiction: Caltrans Analysis Year: Existing Plus Approved Pending Description: Sierra Gateway Apartments TIS Freeway Data Type of analysis Merge Number of lanes in freeway 3 Free-flow speed on freeway 65.0 mph Volume on freeway 3094 vph On Ramp Data Side of freeway Right Number of lanes in ramp 1 Free-flow speed on ramp 35.0 mph Volume on ramp 410 vph Length of first accel/decel lane 700 ft Length of second accel/decel lane ft Adjacent Ramp Data (if one exists) Does adjacent ramp exist? Yes Volume on adjacent Ramp 295 vph Position of adjacent Ramp Upstream Type of adjacent Ramp On Distance to adjacent Ramp 1560 ft Conversion to pc/h Under Base Conditions Junction Components Freeway Ramp Adjacent Ramp Volume, V (vph) vph Peak-hour factor, PHF Peak 15-min volume, v v Trucks and buses % Recreational vehicles % Terrain type: Level Level Level Grade % % % Length mi mi mi Trucks and buses PCE, ET Recreational vehicle PCE, ER
292 Heavy vehicle adjustment, fhv Driver population factor, fp Flow rate, vp pcph Estimation of V12 Merge Areas L = (Equation 13-6 or 13-7) EQ P = Using Equation 3 FM v = v (P ) = 2098 pc/h 12 F FM Capacity Checks Actual Maximum LOS F? v No FO v or v 1416 pc/h (Equation or 13-17) Is v or v > 2700 pc/h? No Is v or v > 1.5 v /2 Yes 12 If yes, v = 2098 (Equation 13-15, 13-16, 13-18, or 13-19) 12A Flow Entering Merge Influence Area Actual Max Desirable Violation? v No 12A Level of Service Determination (if not F) Density, D = v v L = 20.7 pc/mi/ln R R 12 A Level of service for ramp-freeway junction areas of influence C Speed Estimation Intermediate speed variable, M = S Space mean speed in ramp influence area, S = 57.6 mph R Space mean speed in outer lanes, S = 61.7 mph 0 Space mean speed for all vehicles, S = 59.0 mph
293 HCS 2010: Basic Freeway Segments Release 6.70 Phone: Fax: Operational Analysis Analyst: Makinzie Clark Agency or Company: Omni-Means Date Performed: 6/8/2016 Analysis Time Period: PM Peak Hour Freeway/Direction: I-80 Westbound From/To: Sierra College Blvd/Rocklin Rd Jurisdiction: Caltrans Analysis Year: Existing Plus Approved Pending Description: Sierra Gateway Apartments TIS Flow Inputs and Adjustments Volume, V 3504 veh/h Peak-hour factor, PHF 0.92 Peak 15-min volume, v v Trucks and buses 9 % Recreational vehicles 0 % Terrain type: Level Grade - % Segment length - mi Trucks and buses PCE, ET 1.5 Recreational vehicle PCE, ER 1.2 Heavy vehicle adjustment, fhv Driver population factor, fp 1.00 Flow rate, vp 1327 pc/h/ln Speed Inputs and Adjustments Lane width - ft Right-side lateral clearance - ft Total ramp density, TRD - ramps/mi Number of lanes, N 3 Free-flow speed: Measured FFS or BFFS 65.0 mi/h Lane width adjustment, flw - mi/h Lateral clearance adjustment, flc - mi/h TRD adjustment - mi/h Free-flow speed, FFS 65.0 mi/h LOS and Performance Measures Flow rate, vp 1327 pc/h/ln Free-flow speed, FFS 65.0 mi/h Average passenger-car speed, S 65.0 mi/h Number of lanes, N 3 Density, D 20.4 pc/mi/ln Level of service, LOS C
294 HCS 2010: Basic Freeway Segments Release 6.80 Phone: Fax: Operational Analysis Analyst: Makinzie Clark Agency or Company: Omni-Means Date Performed: 6/8/2016 Analysis Time Period: AM Peak Hour Freeway/Direction: I-80 Eastbound From/To: South of Rocklin Road Jurisdiction: Caltrans Analysis Year: Existing + AP + Project Description: Sierra Gateway Apartments TIS Flow Inputs and Adjustments Volume, V 4102 veh/h Peak-hour factor, PHF 0.92 Peak 15-min volume, v v Trucks and buses 9 % Recreational vehicles 0 % Terrain type: Level Grade - % Segment length - mi Trucks and buses PCE, ET 1.5 Recreational vehicle PCE, ER 1.2 Heavy vehicle adjustment, fhv Driver population factor, fp 1.00 Flow rate, vp 1553 pc/h/ln Speed Inputs and Adjustments Lane width - ft Right-side lateral clearance - ft Total ramp density, TRD - ramps/mi Number of lanes, N 3 Free-flow speed: Measured FFS or BFFS 65.0 mi/h Lane width adjustment, flw - mi/h Lateral clearance adjustment, flc - mi/h TRD adjustment - mi/h Free-flow speed, FFS 65.0 mi/h LOS and Performance Measures Flow rate, vp 1553 pc/h/ln Free-flow speed, FFS 65.0 mi/h Average passenger-car speed, S 64.7 mi/h Number of lanes, N 3 Density, D 24.0 pc/mi/ln Level of service, LOS C
295 HCS 2010: Freeway Merge and Diverge Segments Release 6.80 Phone: Fax: Diverge Analysis Analyst: Makinzie Clark Agency/Co.: Omni-Means Date performed: 6/8/2016 Analysis time period: AM Peak Hour Freeway/Dir of Travel: I-80 Eastbound Junction: Rocklin Road Off Ramp Jurisdiction: Caltrans Analysis Year: Existing + AP + Project Description: Sierra Gateway Apartments TIS Freeway Data Type of analysis Diverge Number of lanes in freeway 3 Free-flow speed on freeway 65.0 mph Volume on freeway 4102 vph Off Ramp Data Side of freeway Right Number of lanes in ramp 1 Free-Flow speed on ramp 35.0 mph Volume on ramp 1501 vph Length of first accel/decel lane 1050 ft Length of second accel/decel lane ft Adjacent Ramp Data (if one exists) Does adjacent ramp exist? Volume on adjacent ramp Position of adjacent ramp Type of adjacent ramp Distance to adjacent ramp No vph ft Conversion to pc/h Under Base Conditions Junction Components Freeway Ramp Adjacent Ramp Volume, V (vph) vph Peak-hour factor, PHF Peak 15-min volume, v v Trucks and buses 9 2 % Recreational vehicles 0 0 % Terrain type: Level Level Grade 0.00 % 0.00 % % Length 0.00 mi 0.00 mi mi Trucks and buses PCE, ET Recreational vehicle PCE, ER
296 Heavy vehicle adjustment, fhv Driver population factor, fp Flow rate, vp pcph Estimation of V12 Diverge Areas L = (Equation or 13-13) EQ P = Using Equation 9 FD v = v + (v - v ) P = 3347 pc/h 12 R F R FD Capacity Checks Actual Maximum LOS F? v = v No Fi F v = v - v No FO F R v No R v or v 1312 pc/h (Equation or 13-17) Is v or v > 2700 pc/h? No Is v or v > 1.5 v /2 No 12 If yes, v = 3347 (Equation 13-15, 13-16, 13-18, or 13-19) 12A Flow Entering Diverge Influence Area Actual Max Desirable Violation? v No 12 Level of Service Determination (if not F) Density, D = v L = 23.6 pc/mi/ln R 12 D Level of service for ramp-freeway junction areas of influence C Speed Estimation Intermediate speed variable, D = S Space mean speed in ramp influence area, S = 51.8 mph R Space mean speed in outer lanes, S = 70.1 mph 0 Space mean speed for all vehicles, S = 55.9 mph
297 HCS 2010: Freeway Merge and Diverge Segments Release 6.80 Phone: Fax: Merge Analysis Analyst: Makinzie Clark Agency/Co.: Omni-Means Date performed: 6/8/2016 Analysis time period: AM Peak Hour Freeway/Dir of Travel: I-80 Eastbound Junction: Rocklin Road On Ramp Jurisdiction: Caltrans Analysis Year: Existing + AP + Project Description: Sierra Gateway Apartments TIS Freeway Data Type of analysis Merge Number of lanes in freeway 3 Free-flow speed on freeway 65.0 mph Volume on freeway 2601 vph On Ramp Data Side of freeway Right Number of lanes in ramp 1 Free-flow speed on ramp 35.0 mph Volume on ramp 223 vph Length of first accel/decel lane 360 ft Length of second accel/decel lane ft Adjacent Ramp Data (if one exists) Does adjacent ramp exist? Volume on adjacent Ramp Position of adjacent Ramp Type of adjacent Ramp Distance to adjacent Ramp No vph ft Conversion to pc/h Under Base Conditions Junction Components Freeway Ramp Adjacent Ramp Volume, V (vph) vph Peak-hour factor, PHF Peak 15-min volume, v v Trucks and buses 9 2 % Recreational vehicles 0 0 % Terrain type: Level Level Grade % % % Length mi mi mi Trucks and buses PCE, ET Recreational vehicle PCE, ER
298 Heavy vehicle adjustment, fhv Driver population factor, fp Flow rate, vp pcph Estimation of V12 Merge Areas L = (Equation 13-6 or 13-7) EQ P = Using Equation 3 FM v = v (P ) = 1736 pc/h 12 F FM Capacity Checks Actual Maximum LOS F? v No FO v or v 1218 pc/h (Equation or 13-17) Is v or v > 2700 pc/h? No Is v or v > 1.5 v /2 Yes 12 If yes, v = 1736 (Equation 13-15, 13-16, 13-18, or 13-19) 12A Flow Entering Merge Influence Area Actual Max Desirable Violation? v No 12A Level of Service Determination (if not F) Density, D = v v L = 18.5 R R 12 A Level of service for ramp-freeway junction areas of influence B pc/mi/ln Speed Estimation Intermediate speed variable, M = S Space mean speed in ramp influence area, S = 57.5 mph R Space mean speed in outer lanes, S = 62.4 mph 0 Space mean speed for all vehicles, S = 59.3 mph
299 HCS 2010: Freeway Merge and Diverge Segments Release 6.80 Phone: Fax: Diverge Analysis Analyst: Makinzie Clark Agency/Co.: Omni-Means Date performed: 6/8/2016 Analysis time period: AM Peak Hour Freeway/Dir of Travel: I-80 Westbound Junction: Rocklin Road Off Ramp Jurisdiction: Caltrans Analysis Year: Existing + AP + Project Description: Sierra Gateway Apartments TIS Freeway Data Type of analysis Diverge Number of lanes in freeway 3 Free-flow speed on freeway 65.0 mph Volume on freeway 4049 vph Off Ramp Data Side of freeway Right Number of lanes in ramp 1 Free-Flow speed on ramp 35.0 mph Volume on ramp 292 vph Length of first accel/decel lane 150 ft Length of second accel/decel lane ft Adjacent Ramp Data (if one exists) Does adjacent ramp exist? Volume on adjacent ramp Position of adjacent ramp Type of adjacent ramp Distance to adjacent ramp No vph ft Conversion to pc/h Under Base Conditions Junction Components Freeway Ramp Adjacent Ramp Volume, V (vph) vph Peak-hour factor, PHF Peak 15-min volume, v v Trucks and buses 9 2 % Recreational vehicles 0 0 % Terrain type: Level Level Grade 0.00 % 0.00 % % Length 0.00 mi 0.00 mi mi Trucks and buses PCE, ET Recreational vehicle PCE, ER
300 Heavy vehicle adjustment, fhv Driver population factor, fp Flow rate, vp pcph Estimation of V12 Diverge Areas L = (Equation or 13-13) EQ P = Using Equation 9 FD v = v + (v - v ) P = 3016 pc/h 12 R F R FD Capacity Checks Actual Maximum LOS F? v = v No Fi F v = v - v No FO F R v No R v or v 1583 pc/h (Equation or 13-17) Is v or v > 2700 pc/h? No Is v or v > 1.5 v /2 No 12 If yes, v = 3016 (Equation 13-15, 13-16, 13-18, or 13-19) 12A Flow Entering Diverge Influence Area Actual Max Desirable Violation? v No 12 Level of Service Determination (if not F) Density, D = v L = 28.8 pc/mi/ln R 12 D Level of service for ramp-freeway junction areas of influence D Speed Estimation Intermediate speed variable, D = S Space mean speed in ramp influence area, S = 54.5 mph R Space mean speed in outer lanes, S = 69.0 mph 0 Space mean speed for all vehicles, S = 58.8 mph
301 HCS 2010: Freeway Merge and Diverge Segments Release 6.80 Phone: Fax: Merge Analysis Analyst: Makinzie Clark Agency/Co.: Omni-Means Date performed: 6/8/2016 Analysis time period: AM Peak Hour Freeway/Dir of Travel: I-80 Westbound Junction: Rocklin Road On Ramp Jurisdiction: Caltrans Analysis Year: Existing + AP + Project Description: Sierra Gateway Apartments TIS Freeway Data Type of analysis Merge Number of lanes in freeway 3 Free-flow speed on freeway 65.0 mph Volume on freeway 3757 vph On Ramp Data Side of freeway Right Number of lanes in ramp 1 Free-flow speed on ramp 35.0 mph Volume on ramp 842 vph Length of first accel/decel lane 750 ft Length of second accel/decel lane ft Adjacent Ramp Data (if one exists) Does adjacent ramp exist? Volume on adjacent Ramp Position of adjacent Ramp Type of adjacent Ramp Distance to adjacent Ramp No vph ft Conversion to pc/h Under Base Conditions Junction Components Freeway Ramp Adjacent Ramp Volume, V (vph) vph Peak-hour factor, PHF Peak 15-min volume, v v Trucks and buses 9 2 % Recreational vehicles 0 0 % Terrain type: Level Level Grade % % % Length mi mi mi Trucks and buses PCE, ET Recreational vehicle PCE, ER
302 Heavy vehicle adjustment, fhv Driver population factor, fp Flow rate, vp pcph Estimation of V12 Merge Areas L = (Equation 13-6 or 13-7) EQ P = Using Equation 3 FM v = v (P ) = 2554 pc/h 12 F FM Capacity Checks Actual Maximum LOS F? v No FO v or v 1713 pc/h (Equation or 13-17) Is v or v > 2700 pc/h? No Is v or v > 1.5 v /2 Yes 12 If yes, v = 2554 (Equation 13-15, 13-16, 13-18, or 13-19) 12A Flow Entering Merge Influence Area Actual Max Desirable Violation? v No 12A Level of Service Determination (if not F) Density, D = v v L = 27.3 R R 12 A Level of service for ramp-freeway junction areas of influence C pc/mi/ln Speed Estimation Intermediate speed variable, M = S Space mean speed in ramp influence area, S = 56.0 mph R Space mean speed in outer lanes, S = 60.6 mph 0 Space mean speed for all vehicles, S = 57.4 mph
303 HCS 2010: Basic Freeway Segments Release 6.80 Phone: Fax: Operational Analysis Analyst: Makinzie Clark Agency or Company: Omni-Means Date Performed: 6/8/2016 Analysis Time Period: AM Peak Hour Freeway/Direction: I-80 Westbound From/To: South of Rocklin Road Jurisdiction: Caltrans Analysis Year: Existing + AP + Project Description: Sierra Gateway Apartments TIS Flow Inputs and Adjustments Volume, V 4599 veh/h Peak-hour factor, PHF 0.92 Peak 15-min volume, v v Trucks and buses 9 % Recreational vehicles 0 % Terrain type: Level Grade - % Segment length - mi Trucks and buses PCE, ET 1.5 Recreational vehicle PCE, ER 1.2 Heavy vehicle adjustment, fhv Driver population factor, fp 1.00 Flow rate, vp 1741 pc/h/ln Speed Inputs and Adjustments Lane width - ft Right-side lateral clearance - ft Total ramp density, TRD - ramps/mi Number of lanes, N 3 Free-flow speed: Measured FFS or BFFS 65.0 mi/h Lane width adjustment, flw - mi/h Lateral clearance adjustment, flc - mi/h TRD adjustment - mi/h Free-flow speed, FFS 65.0 mi/h LOS and Performance Measures Flow rate, vp 1741 pc/h/ln Free-flow speed, FFS 65.0 mi/h Average passenger-car speed, S 63.4 mi/h Number of lanes, N 3 Density, D 27.5 pc/mi/ln Level of service, LOS D
304 HCS 2010: Basic Freeway Segments Release 6.70 Phone: Fax: Operational Analysis Analyst: Makinzie Clark Agency or Company: Omni-Means Date Performed: 6/8/2016 Analysis Time Period: AM Peak Freeway/Direction: I-80 Eastbound From/To: Rocklin Rd/Sierra College Blvd Jurisdiction: Caltrans Analysis Year: Existing + AP + Project Description: Sierra Gateway Apartments TIS Flow Inputs and Adjustments Volume, V 2824 veh/h Peak-hour factor, PHF 0.92 Peak 15-min volume, v v Trucks and buses 9 % Recreational vehicles 0 % Terrain type: Level Grade - % Segment length - mi Trucks and buses PCE, ET 1.5 Recreational vehicle PCE, ER 1.2 Heavy vehicle adjustment, fhv Driver population factor, fp 1.00 Flow rate, vp 1069 pc/h/ln Speed Inputs and Adjustments Lane width - ft Right-side lateral clearance - ft Total ramp density, TRD - ramps/mi Number of lanes, N 3 Free-flow speed: Measured FFS or BFFS 65.0 mi/h Lane width adjustment, flw - mi/h Lateral clearance adjustment, flc - mi/h TRD adjustment - mi/h Free-flow speed, FFS 65.0 mi/h LOS and Performance Measures Flow rate, vp 1069 pc/h/ln Free-flow speed, FFS 65.0 mi/h Average passenger-car speed, S 65.0 mi/h Number of lanes, N 3 Density, D 16.4 pc/mi/ln Level of service, LOS B
305 HCS 2010: Freeway Merge and Diverge Segments Release 6.70 Phone: Fax: Diverge Analysis Analyst: Makinzie Clark Agency/Co.: Omni-Means Date performed: 6/8/2016 Analysis time period: AM Peak Hour Freeway/Dir of Travel: I-80 Eastound Junction: Sierra College Blvd Off Ramp Jurisdiction: Caltrans Analysis Year: Existing + AP + Project Description: Sierra Gateway Apartments TIS Freeway Data Type of analysis Diverge Number of lanes in freeway 3 Free-flow speed on freeway 65.0 mph Volume on freeway 2824 vph Off Ramp Data Side of freeway Right Number of lanes in ramp 1 Free-Flow speed on ramp 35.0 mph Volume on ramp 681 vph Length of first accel/decel lane 150 ft Length of second accel/decel lane ft Adjacent Ramp Data (if one exists) Does adjacent ramp exist? Yes Volume on adjacent ramp 185 vph Position of adjacent ramp Downstream Type of adjacent ramp On Distance to adjacent ramp 1560 ft Conversion to pc/h Under Base Conditions Junction Components Freeway Ramp Adjacent Ramp Volume, V (vph) vph Peak-hour factor, PHF Peak 15-min volume, v v Trucks and buses % Recreational vehicles % Terrain type: Level Level Level Grade 0.00 % 0.00 % 0.00 % Length 0.00 mi 0.00 mi 0.00 mi Trucks and buses PCE, ET Recreational vehicle PCE, ER
306 Heavy vehicle adjustment, fhv Driver population factor, fp Flow rate, vp pcph Estimation of V12 Diverge Areas L = (Equation or 13-13) EQ P = Using Equation 9 FD v = v + (v - v ) P = 2343 pc/h 12 R F R FD Capacity Checks Actual Maximum LOS F? v = v No Fi F v = v - v No FO F R v No R v or v 865 pc/h (Equation or 13-17) Is v or v > 2700 pc/h? No Is v or v > 1.5 v /2 No 12 If yes, v = 2343 (Equation 13-15, 13-16, 13-18, or 13-19) 12A Flow Entering Diverge Influence Area Actual Max Desirable Violation? v No 12 Level of Service Determination (if not F) Density, D = v L = 23.1 pc/mi/ln R 12 D Level of service for ramp-freeway junction areas of influence C Speed Estimation Intermediate speed variable, D = S Space mean speed in ramp influence area, S = 53.5 mph R Space mean speed in outer lanes, S = 71.3 mph 0 Space mean speed for all vehicles, S = 57.4 mph
307 HCS 2010: Freeway Merge and Diverge Segments Release 6.70 Phone: Fax: Merge Analysis Analyst: Makinzie Clark Agency/Co.: Omni-Means Date performed: 6/8/2016 Analysis time period: AM Peak Hour Freeway/Dir of Travel: I-80 Eastbound Junction: Sierra College Blvd On Loop Jurisdiction: Caltrans Analysis Year: Existing + AP + Project Description: Sierra Gateway Apartments TIS Freeway Data Type of analysis Merge Number of lanes in freeway 3 Free-flow speed on freeway 65.0 mph Volume on freeway 2143 vph On Ramp Data Side of freeway Right Number of lanes in ramp 1 Free-flow speed on ramp 25.0 mph Volume on ramp 185 vph Length of first accel/decel lane 800 ft Length of second accel/decel lane ft Adjacent Ramp Data (if one exists) Does adjacent ramp exist? Yes Volume on adjacent Ramp 524 vph Position of adjacent Ramp Downstream Type of adjacent Ramp On Distance to adjacent Ramp 1420 ft Conversion to pc/h Under Base Conditions Junction Components Freeway Ramp Adjacent Ramp Volume, V (vph) vph Peak-hour factor, PHF Peak 15-min volume, v v Trucks and buses % Recreational vehicles % Terrain type: Level Level Level Grade % % % Length mi mi mi Trucks and buses PCE, ET Recreational vehicle PCE, ER
308 Heavy vehicle adjustment, fhv Driver population factor, fp Flow rate, vp pcph Estimation of V12 Merge Areas L = (Equation 13-6 or 13-7) EQ P = Using Equation 3 FM v = v (P ) = 1460 pc/h 12 F FM Capacity Checks Actual Maximum LOS F? v No FO v or v 974 pc/h (Equation or 13-17) Is v or v > 2700 pc/h? No Is v or v > 1.5 v /2 Yes 12 If yes, v = 1460 (Equation 13-15, 13-16, 13-18, or 13-19) 12A Flow Entering Merge Influence Area Actual Max Desirable Violation? v No 12A Level of Service Determination (if not F) Density, D = v v L = 13.4 pc/mi/ln R R 12 A Level of service for ramp-freeway junction areas of influence B Speed Estimation Intermediate speed variable, M = S Space mean speed in ramp influence area, S = 58.1 mph R Space mean speed in outer lanes, S = 63.3 mph 0 Space mean speed for all vehicles, S = 59.9 mph
309 HCS 2010: Freeway Merge and Diverge Segments Release 6.70 Phone: Fax: Merge Analysis Analyst: Makinzie Clark Agency/Co.: Omni-Means Date performed: 6/8/2016 Analysis time period: AM Peak Hour Freeway/Dir of Travel: I-80 Eastbound Junction: Sierra College Blvd On Ramp Jurisdiction: Caltrans Analysis Year: Existing + AP + Project Description: Sierra Gateway Apartments TIS Freeway Data Type of analysis Merge Number of lanes in freeway 3 Free-flow speed on freeway 65.0 mph Volume on freeway 2328 vph On Ramp Data Side of freeway Right Number of lanes in ramp 1 Free-flow speed on ramp 35.0 mph Volume on ramp 524 vph Length of first accel/decel lane 700 ft Length of second accel/decel lane ft Adjacent Ramp Data (if one exists) Does adjacent ramp exist? Yes Volume on adjacent Ramp 185 vph Position of adjacent Ramp Upstream Type of adjacent Ramp On Distance to adjacent Ramp 1420 ft Conversion to pc/h Under Base Conditions Junction Components Freeway Ramp Adjacent Ramp Volume, V (vph) vph Peak-hour factor, PHF Peak 15-min volume, v v Trucks and buses % Recreational vehicles % Terrain type: Level Level Level Grade % % % Length mi mi mi Trucks and buses PCE, ET Recreational vehicle PCE, ER
310 Heavy vehicle adjustment, fhv Driver population factor, fp Flow rate, vp pcph Estimation of V12 Merge Areas L = (Equation 13-6 or 13-7) EQ P = Using Equation 3 FM v = v (P ) = 1579 pc/h 12 F FM Capacity Checks Actual Maximum LOS F? v No FO v or v 1065 pc/h (Equation or 13-17) Is v or v > 2700 pc/h? No Is v or v > 1.5 v /2 Yes 12 If yes, v = 1579 (Equation 13-15, 13-16, 13-18, or 13-19) 12A Flow Entering Merge Influence Area Actual Max Desirable Violation? v No 12A Level of Service Determination (if not F) Density, D = v v L = 17.8 pc/mi/ln R R 12 A Level of service for ramp-freeway junction areas of influence B Speed Estimation Intermediate speed variable, M = S Space mean speed in ramp influence area, S = 58.0 mph R Space mean speed in outer lanes, S = 63.0 mph 0 Space mean speed for all vehicles, S = 59.5 mph
311 HCS 2010: Basic Freeway Segments Release 6.70 Phone: Fax: Operational Analysis Analyst: Makinzie Clark Agency or Company: Omni-Means Date Performed: 6/8/2016 Analysis Time Period: AM Peak Hour Freeway/Direction: I-80 Eastbound From/To: North of Sierra College Blvd Jurisdiction: Caltrans Analysis Year: Existing + AP + Project Description: Sierra Gateway Apartments TIS Flow Inputs and Adjustments Volume, V 2852 veh/h Peak-hour factor, PHF 0.92 Peak 15-min volume, v v Trucks and buses 9 % Recreational vehicles 0 % Terrain type: Level Grade - % Segment length - mi Trucks and buses PCE, ET 1.5 Recreational vehicle PCE, ER 1.2 Heavy vehicle adjustment, fhv Driver population factor, fp 1.00 Flow rate, vp 1080 pc/h/ln Speed Inputs and Adjustments Lane width - ft Right-side lateral clearance - ft Total ramp density, TRD - ramps/mi Number of lanes, N 3 Free-flow speed: Measured FFS or BFFS 65.0 mi/h Lane width adjustment, flw - mi/h Lateral clearance adjustment, flc - mi/h TRD adjustment - mi/h Free-flow speed, FFS 65.0 mi/h LOS and Performance Measures Flow rate, vp 1080 pc/h/ln Free-flow speed, FFS 65.0 mi/h Average passenger-car speed, S 65.0 mi/h Number of lanes, N 3 Density, D 16.6 pc/mi/ln Level of service, LOS B
312 HCS 2010: Basic Freeway Segments Release 6.70 Phone: Fax: Operational Analysis Analyst: Makinzie Clark Agency or Company: Omni-Means Date Performed: 6/8/2016 Analysis Time Period: AM Peak Hour Freeway/Direction: I-80 Westbound From/To: North of Sierra College Blvd Jurisdiction: Caltrans Analysis Year: Existing + AP + Project Description: Sierra Gateway Apartments TIS Flow Inputs and Adjustments Volume, V 4460 veh/h Peak-hour factor, PHF 0.92 Peak 15-min volume, v v Trucks and buses 9 % Recreational vehicles 0 % Terrain type: Level Grade - % Segment length - mi Trucks and buses PCE, ET 1.5 Recreational vehicle PCE, ER 1.2 Heavy vehicle adjustment, fhv Driver population factor, fp 1.00 Flow rate, vp 1689 pc/h/ln Speed Inputs and Adjustments Lane width - ft Right-side lateral clearance - ft Total ramp density, TRD - ramps/mi Number of lanes, N 3 Free-flow speed: Measured FFS or BFFS 65.0 mi/h Lane width adjustment, flw - mi/h Lateral clearance adjustment, flc - mi/h TRD adjustment - mi/h Free-flow speed, FFS 65.0 mi/h LOS and Performance Measures Flow rate, vp 1689 pc/h/ln Free-flow speed, FFS 65.0 mi/h Average passenger-car speed, S 63.8 mi/h Number of lanes, N 3 Density, D 26.5 pc/mi/ln Level of service, LOS D
313 HCS 2010: Freeway Merge and Diverge Segments Release 6.70 Phone: Fax: Diverge Analysis Analyst: Makinzie Clark Agency/Co.: Omni-Means Date performed: 6/8/2016 Analysis time period: AM Peak Hour Freeway/Dir of Travel: I-80 Westbound Junction: Sierra College Blvd Off Ramp Jurisdiction: Caltrans Analysis Year: Existing + AP + Project Description: Sierra Gateway Apartments TIS Freeway Data Type of analysis Diverge Number of lanes in freeway 3 Free-flow speed on freeway 65.0 mph Volume on freeway 4460 vph Off Ramp Data Side of freeway Right Number of lanes in ramp 1 Free-Flow speed on ramp 35.0 mph Volume on ramp 903 vph Length of first accel/decel lane 650 ft Length of second accel/decel lane ft Adjacent Ramp Data (if one exists) Does adjacent ramp exist? Yes Volume on adjacent ramp 152 vph Position of adjacent ramp Downstream Type of adjacent ramp On Distance to adjacent ramp 1650 ft Conversion to pc/h Under Base Conditions Junction Components Freeway Ramp Adjacent Ramp Volume, V (vph) vph Peak-hour factor, PHF Peak 15-min volume, v v Trucks and buses % Recreational vehicles % Terrain type: Level Level Level Grade 0.00 % 0.00 % 0.00 % Length 0.00 mi 0.00 mi 0.00 mi Trucks and buses PCE, ET Recreational vehicle PCE, ER
314 Heavy vehicle adjustment, fhv Driver population factor, fp Flow rate, vp pcph Estimation of V12 Diverge Areas L = (Equation or 13-13) EQ P = Using Equation 9 FD v = v + (v - v ) P = 3410 pc/h 12 R F R FD Capacity Checks Actual Maximum LOS F? v = v No Fi F v = v - v No FO F R v No R v or v 1656 pc/h (Equation or 13-17) Is v or v > 2700 pc/h? No Is v or v > 1.5 v /2 No 12 If yes, v = 3410 (Equation 13-15, 13-16, 13-18, or 13-19) 12A Flow Entering Diverge Influence Area Actual Max Desirable Violation? v No 12 Level of Service Determination (if not F) Density, D = v L = 27.7 pc/mi/ln R 12 D Level of service for ramp-freeway junction areas of influence C Speed Estimation Intermediate speed variable, D = S Space mean speed in ramp influence area, S = 52.9 mph R Space mean speed in outer lanes, S = 68.7 mph 0 Space mean speed for all vehicles, S = 57.2 mph
315 HCS 2010: Freeway Merge and Diverge Segments Release 6.70 Phone: Fax: Merge Analysis Analyst: Makinzie Clark Agency/Co.: Omni-Means Date performed: 6/8/2016 Analysis time period: AM Peak Hour Freeway/Dir of Travel: I-80 Westbound Junction: Sierra College Blvd On Loop Jurisdiction: Caltrans Analysis Year: Existing + AP + Project Description: Sierra Gateway Apartments TIS Freeway Data Type of analysis Merge Number of lanes in freeway 3 Free-flow speed on freeway 65.0 mph Volume on freeway 3557 vph On Ramp Data Side of freeway Right Number of lanes in ramp 1 Free-flow speed on ramp 25.0 mph Volume on ramp 152 vph Length of first accel/decel lane 700 ft Length of second accel/decel lane ft Adjacent Ramp Data (if one exists) Does adjacent ramp exist? Yes Volume on adjacent Ramp 340 vph Position of adjacent Ramp Downstream Type of adjacent Ramp On Distance to adjacent Ramp 1560 ft Conversion to pc/h Under Base Conditions Junction Components Freeway Ramp Adjacent Ramp Volume, V (vph) vph Peak-hour factor, PHF Peak 15-min volume, v v Trucks and buses % Recreational vehicles % Terrain type: Level Level Level Grade % % % Length mi mi mi Trucks and buses PCE, ET Recreational vehicle PCE, ER
316 Heavy vehicle adjustment, fhv Driver population factor, fp Flow rate, vp pcph Estimation of V12 Merge Areas L = (Equation 13-6 or 13-7) EQ P = Using Equation 3 FM v = v (P ) = 2412 pc/h 12 F FM Capacity Checks Actual Maximum LOS F? v No FO v or v 1628 pc/h (Equation or 13-17) Is v or v > 2700 pc/h? No Is v or v > 1.5 v /2 Yes 12 If yes, v = 2412 (Equation 13-15, 13-16, 13-18, or 13-19) 12A Flow Entering Merge Influence Area Actual Max Desirable Violation? v No 12A Level of Service Determination (if not F) Density, D = v v L = 21.3 pc/mi/ln R R 12 A Level of service for ramp-freeway junction areas of influence C Speed Estimation Intermediate speed variable, M = S Space mean speed in ramp influence area, S = 57.2 mph R Space mean speed in outer lanes, S = 60.9 mph 0 Space mean speed for all vehicles, S = 58.6 mph
317 HCS 2010: Freeway Merge and Diverge Segments Release 6.70 Phone: Fax: Merge Analysis Analyst: Makinzie Clark Agency/Co.: Omni-Means Date performed: 6/8/2016 Analysis time period: AM Peak Hour Freeway/Dir of Travel: I-80 Westbound Junction: Sierra College Blvd On Ramp Jurisdiction: Caltrans Analysis Year: Existing + AP + Project Description: Sierra Gateway Apartments TIS Freeway Data Type of analysis Merge Number of lanes in freeway 3 Free-flow speed on freeway 65.0 mph Volume on freeway 3709 vph On Ramp Data Side of freeway Right Number of lanes in ramp 1 Free-flow speed on ramp 35.0 mph Volume on ramp 340 vph Length of first accel/decel lane 700 ft Length of second accel/decel lane ft Adjacent Ramp Data (if one exists) Does adjacent ramp exist? Yes Volume on adjacent Ramp 152 vph Position of adjacent Ramp Upstream Type of adjacent Ramp On Distance to adjacent Ramp 1560 ft Conversion to pc/h Under Base Conditions Junction Components Freeway Ramp Adjacent Ramp Volume, V (vph) vph Peak-hour factor, PHF Peak 15-min volume, v v Trucks and buses % Recreational vehicles % Terrain type: Level Level Level Grade % % % Length mi mi mi Trucks and buses PCE, ET Recreational vehicle PCE, ER
318 Heavy vehicle adjustment, fhv Driver population factor, fp Flow rate, vp pcph Estimation of V12 Merge Areas L = (Equation 13-6 or 13-7) EQ P = Using Equation 3 FM v = v (P ) = 2516 pc/h 12 F FM Capacity Checks Actual Maximum LOS F? v No FO v or v 1697 pc/h (Equation or 13-17) Is v or v > 2700 pc/h? No Is v or v > 1.5 v /2 Yes 12 If yes, v = 2516 (Equation 13-15, 13-16, 13-18, or 13-19) 12A Flow Entering Merge Influence Area Actual Max Desirable Violation? v No 12A Level of Service Determination (if not F) Density, D = v v L = 23.7 pc/mi/ln R R 12 A Level of service for ramp-freeway junction areas of influence C Speed Estimation Intermediate speed variable, M = S Space mean speed in ramp influence area, S = 57.1 mph R Space mean speed in outer lanes, S = 60.7 mph 0 Space mean speed for all vehicles, S = 58.3 mph
319 HCS 2010: Basic Freeway Segments Release 6.70 Phone: Fax: Operational Analysis Analyst: Makinzie Clark Agency or Company: Omni-Means Date Performed: 6/8/2016 Analysis Time Period: AM Peak Hour Freeway/Direction: I-80 Westbound From/To: Sierra College Blvd/Rocklin Rd Jurisdiction: Caltrans Analysis Year: Existing + AP + Project Description: Sierra Gateway Apartments TIS Flow Inputs and Adjustments Volume, V 4049 veh/h Peak-hour factor, PHF 0.92 Peak 15-min volume, v v Trucks and buses 9 % Recreational vehicles 0 % Terrain type: Level Grade - % Segment length - mi Trucks and buses PCE, ET 1.5 Recreational vehicle PCE, ER 1.2 Heavy vehicle adjustment, fhv Driver population factor, fp 1.00 Flow rate, vp 1533 pc/h/ln Speed Inputs and Adjustments Lane width - ft Right-side lateral clearance - ft Total ramp density, TRD - ramps/mi Number of lanes, N 3 Free-flow speed: Measured FFS or BFFS 65.0 mi/h Lane width adjustment, flw - mi/h Lateral clearance adjustment, flc - mi/h TRD adjustment - mi/h Free-flow speed, FFS 65.0 mi/h LOS and Performance Measures Flow rate, vp 1533 pc/h/ln Free-flow speed, FFS 65.0 mi/h Average passenger-car speed, S 64.7 mi/h Number of lanes, N 3 Density, D 23.7 pc/mi/ln Level of service, LOS C
320 HCS 2010: Basic Freeway Segments Release 6.80 Phone: Fax: Operational Analysis Analyst: Makinzie Clark Agency or Company: Omni-Means Date Performed: 6/8/2016 Analysis Time Period: PM Peak Hour Freeway/Direction: I-80 Eastbound From/To: South of Rocklin Road Jurisdiction: Caltrans Analysis Year: Existing + AP + Project Description: Sierra Gateway Apartments TIS Flow Inputs and Adjustments Volume, V 5019 veh/h Peak-hour factor, PHF 0.92 Peak 15-min volume, v v Trucks and buses 9 % Recreational vehicles 0 % Terrain type: Level Grade - % Segment length - mi Trucks and buses PCE, ET 1.5 Recreational vehicle PCE, ER 1.2 Heavy vehicle adjustment, fhv Driver population factor, fp 1.00 Flow rate, vp 1900 pc/h/ln Speed Inputs and Adjustments Lane width - ft Right-side lateral clearance - ft Total ramp density, TRD - ramps/mi Number of lanes, N 3 Free-flow speed: Measured FFS or BFFS 65.0 mi/h Lane width adjustment, flw - mi/h Lateral clearance adjustment, flc - mi/h TRD adjustment - mi/h Free-flow speed, FFS 65.0 mi/h LOS and Performance Measures Flow rate, vp 1900 pc/h/ln Free-flow speed, FFS 65.0 mi/h Average passenger-car speed, S 61.5 mi/h Number of lanes, N 3 Density, D 30.9 pc/mi/ln Level of service, LOS D
321 HCS 2010: Freeway Merge and Diverge Segments Release 6.80 Phone: Fax: Diverge Analysis Analyst: Makinzie Clark Agency/Co.: Omni-Means Date performed: 6/8/2016 Analysis time period: PM Peak Hour Freeway/Dir of Travel: I-80 Eastbound Junction: Rocklin Road Off Ramp Jurisdiction: Caltrans Analysis Year: Existing + AP + Project Description: Sierra Gateway Apartments TIS Freeway Data Type of analysis Diverge Number of lanes in freeway 3 Free-flow speed on freeway 65.0 mph Volume on freeway 5019 vph Off Ramp Data Side of freeway Right Number of lanes in ramp 1 Free-Flow speed on ramp 35.0 mph Volume on ramp 1074 vph Length of first accel/decel lane 892 ft Length of second accel/decel lane ft Adjacent Ramp Data (if one exists) Does adjacent ramp exist? Volume on adjacent ramp Position of adjacent ramp Type of adjacent ramp Distance to adjacent ramp No vph ft Conversion to pc/h Under Base Conditions Junction Components Freeway Ramp Adjacent Ramp Volume, V (vph) vph Peak-hour factor, PHF Peak 15-min volume, v v Trucks and buses 9 2 % Recreational vehicles 0 0 % Terrain type: Level Level Grade 0.00 % 0.00 % % Length 0.00 mi 0.00 mi mi Trucks and buses PCE, ET Recreational vehicle PCE, ER
322 Heavy vehicle adjustment, fhv Driver population factor, fp Flow rate, vp pcph Estimation of V12 Diverge Areas L = (Equation or 13-13) EQ P = Using Equation 9 FD v = v + (v - v ) P = 3715 pc/h 12 R F R FD Capacity Checks Actual Maximum LOS F? v = v No Fi F v = v - v No FO F R v No R v or v 1986 pc/h (Equation or 13-17) Is v or v > 2700 pc/h? No Is v or v > 1.5 v /2 No 12 If yes, v = 3715 (Equation 13-15, 13-16, 13-18, or 13-19) 12A Flow Entering Diverge Influence Area Actual Max Desirable Violation? v No 12 Level of Service Determination (if not F) Density, D = v L = 28.2 pc/mi/ln R 12 D Level of service for ramp-freeway junction areas of influence D Speed Estimation Intermediate speed variable, D = S Space mean speed in ramp influence area, S = 52.8 mph R Space mean speed in outer lanes, S = 67.5 mph 0 Space mean speed for all vehicles, S = 57.1 mph
323 HCS 2010: Freeway Merge and Diverge Segments Release 6.80 Phone: Fax: Merge Analysis Analyst: Makinzie Clark Agency/Co.: Omni-Means Date performed: 6/8/2016 Analysis time period: PM Peak Hour Freeway/Dir of Travel: I-80 Eastbound Junction: Rocklin Road On Ramp Jurisdiction: Caltrans Analysis Year: Existing + AP + Project Description: Sierra Gateway Apartments TIS Freeway Data Type of analysis Merge Number of lanes in freeway 3 Free-flow speed on freeway 65.0 mph Volume on freeway 3925 vph On Ramp Data Side of freeway Right Number of lanes in ramp 1 Free-flow speed on ramp 35.0 mph Volume on ramp 283 vph Length of first accel/decel lane 360 ft Length of second accel/decel lane ft Adjacent Ramp Data (if one exists) Does adjacent ramp exist? Volume on adjacent Ramp Position of adjacent Ramp Type of adjacent Ramp Distance to adjacent Ramp No vph ft Conversion to pc/h Under Base Conditions Junction Components Freeway Ramp Adjacent Ramp Volume, V (vph) vph Peak-hour factor, PHF Peak 15-min volume, v v Trucks and buses 9 2 % Recreational vehicles 0 0 % Terrain type: Level Level Grade % % % Length mi mi mi Trucks and buses PCE, ET Recreational vehicle PCE, ER
324 Heavy vehicle adjustment, fhv Driver population factor, fp Flow rate, vp pcph Estimation of V12 Merge Areas L = (Equation 13-6 or 13-7) EQ P = Using Equation 3 FM v = v (P ) = 2619 pc/h 12 F FM Capacity Checks Actual Maximum LOS F? v No FO v or v 1839 pc/h (Equation or 13-17) Is v or v > 2700 pc/h? No Is v or v > 1.5 v /2 Yes 12 If yes, v = 2619 (Equation 13-15, 13-16, 13-18, or 13-19) 12A Flow Entering Merge Influence Area Actual Max Desirable Violation? v No 12A Level of Service Determination (if not F) Density, D = v v L = 25.8 R R 12 A Level of service for ramp-freeway junction areas of influence C pc/mi/ln Speed Estimation Intermediate speed variable, M = S Space mean speed in ramp influence area, S = 56.5 mph R Space mean speed in outer lanes, S = 60.2 mph 0 Space mean speed for all vehicles, S = 57.9 mph
325 HCS 2010: Freeway Merge and Diverge Segments Release 6.80 Phone: Fax: Diverge Analysis Analyst: Makinzie Clark Agency/Co.: Omni-Means Date performed: 6/8/2016 Analysis time period: PM Peak Hour Freeway/Dir of Travel: I-80 Westbound Junction: Rocklin Road Off Ramp Jurisdiction: Caltrans Analysis Year: Existing + AP + Project Description: Sierra Gateway Apartments TIS Freeway Data Type of analysis Diverge Number of lanes in freeway 3 Free-flow speed on freeway 65.0 mph Volume on freeway 3507 vph Off Ramp Data Side of freeway Right Number of lanes in ramp 1 Free-Flow speed on ramp 35.0 mph Volume on ramp 365 vph Length of first accel/decel lane 150 ft Length of second accel/decel lane ft Adjacent Ramp Data (if one exists) Does adjacent ramp exist? Volume on adjacent ramp Position of adjacent ramp Type of adjacent ramp Distance to adjacent ramp No vph ft Conversion to pc/h Under Base Conditions Junction Components Freeway Ramp Adjacent Ramp Volume, V (vph) vph Peak-hour factor, PHF Peak 15-min volume, v v Trucks and buses 9 2 % Recreational vehicles 0 0 % Terrain type: Level Level Grade 0.00 % 0.00 % % Length 0.00 mi 0.00 mi mi Trucks and buses PCE, ET Recreational vehicle PCE, ER
326 Heavy vehicle adjustment, fhv Driver population factor, fp Flow rate, vp pcph Estimation of V12 Diverge Areas L = (Equation or 13-13) EQ P = Using Equation 9 FD v = v + (v - v ) P = 2695 pc/h 12 R F R FD Capacity Checks Actual Maximum LOS F? v = v No Fi F v = v - v No FO F R v No R v or v 1288 pc/h (Equation or 13-17) Is v or v > 2700 pc/h? No Is v or v > 1.5 v /2 No 12 If yes, v = 2695 (Equation 13-15, 13-16, 13-18, or 13-19) 12A Flow Entering Diverge Influence Area Actual Max Desirable Violation? v No 12 Level of Service Determination (if not F) Density, D = v L = 26.1 pc/mi/ln R 12 D Level of service for ramp-freeway junction areas of influence C Speed Estimation Intermediate speed variable, D = S Space mean speed in ramp influence area, S = 54.4 mph R Space mean speed in outer lanes, S = 70.2 mph 0 Space mean speed for all vehicles, S = 58.7 mph
327 HCS 2010: Freeway Merge and Diverge Segments Release 6.80 Phone: Fax: Merge Analysis Analyst: Makinzie Clark Agency/Co.: Omni-Means Date performed: 6/8/2016 Analysis time period: PM Peak Hour Freeway/Dir of Travel: I-80 Westbound Junction: Rocklin Road On Ramp Jurisdiction: Caltrans Analysis Year: Existing + AP + Project Description: Sierra Gateway Apartments TIS Freeway Data Type of analysis Merge Number of lanes in freeway 3 Free-flow speed on freeway 65.0 mph Volume on freeway 3142 vph On Ramp Data Side of freeway Right Number of lanes in ramp 1 Free-flow speed on ramp 35.0 mph Volume on ramp 1210 vph Length of first accel/decel lane 760 ft Length of second accel/decel lane ft Adjacent Ramp Data (if one exists) Does adjacent ramp exist? Volume on adjacent Ramp Position of adjacent Ramp Type of adjacent Ramp Distance to adjacent Ramp No vph ft Conversion to pc/h Under Base Conditions Junction Components Freeway Ramp Adjacent Ramp Volume, V (vph) vph Peak-hour factor, PHF Peak 15-min volume, v v Trucks and buses 9 2 % Recreational vehicles 0 0 % Terrain type: Level Level Grade % % % Length mi mi mi Trucks and buses PCE, ET Recreational vehicle PCE, ER
328 Heavy vehicle adjustment, fhv Driver population factor, fp Flow rate, vp pcph Estimation of V12 Merge Areas L = (Equation 13-6 or 13-7) EQ P = Using Equation 3 FM v = v (P ) = 2137 pc/h 12 F FM Capacity Checks Actual Maximum LOS F? v No FO v or v 1432 pc/h (Equation or 13-17) Is v or v > 2700 pc/h? No Is v or v > 1.5 v /2 Yes 12 If yes, v = 2137 (Equation 13-15, 13-16, 13-18, or 13-19) 12A Flow Entering Merge Influence Area Actual Max Desirable Violation? v No 12A Level of Service Determination (if not F) Density, D = v v L = 26.4 R R 12 A Level of service for ramp-freeway junction areas of influence C pc/mi/ln Speed Estimation Intermediate speed variable, M = S Space mean speed in ramp influence area, S = 56.2 mph R Space mean speed in outer lanes, S = 61.6 mph 0 Space mean speed for all vehicles, S = 57.7 mph
329 HCS 2010: Basic Freeway Segments Release 6.80 Phone: Fax: Operational Analysis Analyst: Makinzie Clark Agency or Company: Omni-Means Date Performed: 6/8/2016 Analysis Time Period: PM Peak Hour Freeway/Direction: I-80 Westbound From/To: South of Rocklin Road Jurisdiction: Caltrans Analysis Year: Existing + AP + Project Description: Sierra Gateway Apartments TIS Flow Inputs and Adjustments Volume, V 4352 veh/h Peak-hour factor, PHF 0.92 Peak 15-min volume, v v Trucks and buses 9 % Recreational vehicles 0 % Terrain type: Level Grade - % Segment length - mi Trucks and buses PCE, ET 1.5 Recreational vehicle PCE, ER 1.2 Heavy vehicle adjustment, fhv Driver population factor, fp 1.00 Flow rate, vp 1648 pc/h/ln Speed Inputs and Adjustments Lane width - ft Right-side lateral clearance - ft Total ramp density, TRD - ramps/mi Number of lanes, N 3 Free-flow speed: Measured FFS or BFFS 65.0 mi/h Lane width adjustment, flw - mi/h Lateral clearance adjustment, flc - mi/h TRD adjustment - mi/h Free-flow speed, FFS 65.0 mi/h LOS and Performance Measures Flow rate, vp 1648 pc/h/ln Free-flow speed, FFS 65.0 mi/h Average passenger-car speed, S 64.1 mi/h Number of lanes, N 3 Density, D 25.7 pc/mi/ln Level of service, LOS C
330 HCS 2010: Basic Freeway Segments Release 6.70 Phone: Fax: Operational Analysis Analyst: Makinzie Clark Agency or Company: Omni-Means Date Performed: 6/8/2016 Analysis Time Period: PM Peak Hour Freeway/Direction: I-80 Eastbound From/To: Rocklin Rd/Sierra College Blvd Jurisdiction: Caltrans Analysis Year: Existing + AP + Project Description: Sierra Gateway Apartments TIS Flow Inputs and Adjustments Volume, V 4208 veh/h Peak-hour factor, PHF 0.92 Peak 15-min volume, v v Trucks and buses 9 % Recreational vehicles 0 % Terrain type: Level Grade - % Segment length - mi Trucks and buses PCE, ET 1.5 Recreational vehicle PCE, ER 1.2 Heavy vehicle adjustment, fhv Driver population factor, fp 1.00 Flow rate, vp 1593 pc/h/ln Speed Inputs and Adjustments Lane width - ft Right-side lateral clearance - ft Total ramp density, TRD - ramps/mi Number of lanes, N 3 Free-flow speed: Measured FFS or BFFS 65.0 mi/h Lane width adjustment, flw - mi/h Lateral clearance adjustment, flc - mi/h TRD adjustment - mi/h Free-flow speed, FFS 65.0 mi/h LOS and Performance Measures Flow rate, vp 1593 pc/h/ln Free-flow speed, FFS 65.0 mi/h Average passenger-car speed, S 64.5 mi/h Number of lanes, N 3 Density, D 24.7 pc/mi/ln Level of service, LOS C
331 HCS 2010: Freeway Merge and Diverge Segments Release 6.70 Phone: Fax: Diverge Analysis Analyst: Makinzie Clark Agency/Co.: Omni-Means Date performed: 6/8/2016 Analysis time period: PM Peak Hour Freeway/Dir of Travel: I-80 Eastound Junction: Sierra College Blvd Off Ramp Jurisdiction: Caltrans Analysis Year: Existing + AP + Project Description: Sierra Gateway Apartments TIS Freeway Data Type of analysis Diverge Number of lanes in freeway 3 Free-flow speed on freeway 65.0 mph Volume on freeway 4208 vph Off Ramp Data Side of freeway Right Number of lanes in ramp 1 Free-Flow speed on ramp 35.0 mph Volume on ramp 617 vph Length of first accel/decel lane 150 ft Length of second accel/decel lane ft Adjacent Ramp Data (if one exists) Does adjacent ramp exist? Yes Volume on adjacent ramp 345 vph Position of adjacent ramp Downstream Type of adjacent ramp On Distance to adjacent ramp 1560 ft Conversion to pc/h Under Base Conditions Junction Components Freeway Ramp Adjacent Ramp Volume, V (vph) vph Peak-hour factor, PHF Peak 15-min volume, v v Trucks and buses % Recreational vehicles % Terrain type: Level Level Level Grade 0.00 % 0.00 % 0.00 % Length 0.00 mi 0.00 mi 0.00 mi Trucks and buses PCE, ET Recreational vehicle PCE, ER
332 Heavy vehicle adjustment, fhv Driver population factor, fp Flow rate, vp pcph Estimation of V12 Diverge Areas L = (Equation or 13-13) EQ P = Using Equation 9 FD v = v + (v - v ) P = 3174 pc/h 12 R F R FD Capacity Checks Actual Maximum LOS F? v = v No Fi F v = v - v No FO F R v No R v or v 1606 pc/h (Equation or 13-17) Is v or v > 2700 pc/h? No Is v or v > 1.5 v /2 No 12 If yes, v = 3174 (Equation 13-15, 13-16, 13-18, or 13-19) 12A Flow Entering Diverge Influence Area Actual Max Desirable Violation? v No 12 Level of Service Determination (if not F) Density, D = v L = 30.2 pc/mi/ln R 12 D Level of service for ramp-freeway junction areas of influence D Speed Estimation Intermediate speed variable, D = S Space mean speed in ramp influence area, S = 53.8 mph R Space mean speed in outer lanes, S = 68.9 mph 0 Space mean speed for all vehicles, S = 58.1 mph
333 HCS 2010: Freeway Merge and Diverge Segments Release 6.70 Phone: Fax: Merge Analysis Analyst: Makinzie Clark Agency/Co.: Omni-Means Date performed: 6/8/2016 Analysis time period: PM Peak Hour Freeway/Dir of Travel: I-80 Eastbound Junction: Sierra College Blvd On Loop Jurisdiction: Caltrans Analysis Year: Existing + AP + Project Description: Sierra Gateway Apartments TIS Freeway Data Type of analysis Merge Number of lanes in freeway 3 Free-flow speed on freeway 65.0 mph Volume on freeway 3591 vph On Ramp Data Side of freeway Right Number of lanes in ramp 1 Free-flow speed on ramp 25.0 mph Volume on ramp 345 vph Length of first accel/decel lane 800 ft Length of second accel/decel lane ft Adjacent Ramp Data (if one exists) Does adjacent ramp exist? Yes Volume on adjacent Ramp 846 vph Position of adjacent Ramp Downstream Type of adjacent Ramp On Distance to adjacent Ramp 1420 ft Conversion to pc/h Under Base Conditions Junction Components Freeway Ramp Adjacent Ramp Volume, V (vph) vph Peak-hour factor, PHF Peak 15-min volume, v v Trucks and buses % Recreational vehicles % Terrain type: Level Level Level Grade % % % Length mi mi mi Trucks and buses PCE, ET Recreational vehicle PCE, ER
334 Heavy vehicle adjustment, fhv Driver population factor, fp Flow rate, vp pcph Estimation of V12 Merge Areas L = (Equation 13-6 or 13-7) EQ P = Using Equation 3 FM v = v (P ) = 2447 pc/h 12 F FM Capacity Checks Actual Maximum LOS F? v No FO v or v 1632 pc/h (Equation or 13-17) Is v or v > 2700 pc/h? No Is v or v > 1.5 v /2 Yes 12 If yes, v = 2447 (Equation 13-15, 13-16, 13-18, or 13-19) 12A Flow Entering Merge Influence Area Actual Max Desirable Violation? v No 12A Level of Service Determination (if not F) Density, D = v v L = 22.3 pc/mi/ln R R 12 A Level of service for ramp-freeway junction areas of influence C Speed Estimation Intermediate speed variable, M = S Space mean speed in ramp influence area, S = 57.0 mph R Space mean speed in outer lanes, S = 60.9 mph 0 Space mean speed for all vehicles, S = 58.4 mph
335 HCS 2010: Freeway Merge and Diverge Segments Release 6.70 Phone: Fax: Merge Analysis Analyst: Makinzie Clark Agency/Co.: Omni-Means Date performed: 6/8/2016 Analysis time period: PM Peak Hour Freeway/Dir of Travel: I-80 Eastbound Junction: Sierra College Blvd On Ramp Jurisdiction: Caltrans Analysis Year: Existing + AP + Project Description: Sierra Gateway Apartments TIS Freeway Data Type of analysis Merge Number of lanes in freeway 3 Free-flow speed on freeway 65.0 mph Volume on freeway 3936 vph On Ramp Data Side of freeway Right Number of lanes in ramp 1 Free-flow speed on ramp 35.0 mph Volume on ramp 846 vph Length of first accel/decel lane 700 ft Length of second accel/decel lane ft Adjacent Ramp Data (if one exists) Does adjacent ramp exist? Yes Volume on adjacent Ramp 345 vph Position of adjacent Ramp Upstream Type of adjacent Ramp On Distance to adjacent Ramp 1420 ft Conversion to pc/h Under Base Conditions Junction Components Freeway Ramp Adjacent Ramp Volume, V (vph) vph Peak-hour factor, PHF Peak 15-min volume, v v Trucks and buses % Recreational vehicles % Terrain type: Level Level Level Grade % % % Length mi mi mi Trucks and buses PCE, ET Recreational vehicle PCE, ER
336 Heavy vehicle adjustment, fhv Driver population factor, fp Flow rate, vp pcph Estimation of V12 Merge Areas L = (Equation 13-6 or 13-7) EQ P = Using Equation 3 FM v = v (P ) = 2670 pc/h 12 F FM Capacity Checks Actual Maximum LOS F? v No FO v or v 1801 pc/h (Equation or 13-17) Is v or v > 2700 pc/h? No Is v or v > 1.5 v /2 Yes 12 If yes, v = 2670 (Equation 13-15, 13-16, 13-18, or 13-19) 12A Flow Entering Merge Influence Area Actual Max Desirable Violation? v No 12A Level of Service Determination (if not F) Density, D = v v L = 28.5 pc/mi/ln R R 12 A Level of service for ramp-freeway junction areas of influence D Speed Estimation Intermediate speed variable, M = S Space mean speed in ramp influence area, S = 55.5 mph R Space mean speed in outer lanes, S = 60.3 mph 0 Space mean speed for all vehicles, S = 57.1 mph
337 HCS 2010: Basic Freeway Segments Release 6.70 Phone: Fax: Operational Analysis Analyst: Makinzie Clark Agency or Company: Omni-Means Date Performed: 6/8/2016 Analysis Time Period: PM Peak Hour Freeway/Direction: I-80 Eastbound From/To: North of Sierra College Blvd Jurisdiction: Caltrans Analysis Year: Existing + AP + Project Description: Sierra Gateway Apartments TIS Flow Inputs and Adjustments Volume, V 4872 veh/h Peak-hour factor, PHF 0.92 Peak 15-min volume, v v Trucks and buses 9 % Recreational vehicles 0 % Terrain type: Level Grade - % Segment length - mi Trucks and buses PCE, ET 1.5 Recreational vehicle PCE, ER 1.2 Heavy vehicle adjustment, fhv Driver population factor, fp 1.00 Flow rate, vp 1845 pc/h/ln Speed Inputs and Adjustments Lane width - ft Right-side lateral clearance - ft Total ramp density, TRD - ramps/mi Number of lanes, N 3 Free-flow speed: Measured FFS or BFFS 65.0 mi/h Lane width adjustment, flw - mi/h Lateral clearance adjustment, flc - mi/h TRD adjustment - mi/h Free-flow speed, FFS 65.0 mi/h LOS and Performance Measures Flow rate, vp 1845 pc/h/ln Free-flow speed, FFS 65.0 mi/h Average passenger-car speed, S 62.2 mi/h Number of lanes, N 3 Density, D 29.7 pc/mi/ln Level of service, LOS D
338 HCS 2010: Basic Freeway Segments Release 6.70 Phone: Fax: Operational Analysis Analyst: Makinzie Clark Agency or Company: Omni-Means Date Performed: 6/8/2016 Analysis Time Period: PM Peak Hour Freeway/Direction: I-80 Westbound From/To: North of Sierra College Blvd Jurisdiction: Caltrans Analysis Year: Existing + AP + Project Description: Sierra Gateway Apartments TIS Flow Inputs and Adjustments Volume, V 3557 veh/h Peak-hour factor, PHF 0.92 Peak 15-min volume, v v Trucks and buses 9 % Recreational vehicles 0 % Terrain type: Level Grade - % Segment length - mi Trucks and buses PCE, ET 1.5 Recreational vehicle PCE, ER 1.2 Heavy vehicle adjustment, fhv Driver population factor, fp 1.00 Flow rate, vp 1347 pc/h/ln Speed Inputs and Adjustments Lane width - ft Right-side lateral clearance - ft Total ramp density, TRD - ramps/mi Number of lanes, N 3 Free-flow speed: Measured FFS or BFFS 65.0 mi/h Lane width adjustment, flw - mi/h Lateral clearance adjustment, flc - mi/h TRD adjustment - mi/h Free-flow speed, FFS 65.0 mi/h LOS and Performance Measures Flow rate, vp 1347 pc/h/ln Free-flow speed, FFS 65.0 mi/h Average passenger-car speed, S 65.0 mi/h Number of lanes, N 3 Density, D 20.7 pc/mi/ln Level of service, LOS C
339 HCS 2010: Freeway Merge and Diverge Segments Release 6.70 Phone: Fax: Diverge Analysis Analyst: Makinzie Clark Agency/Co.: Omni-Means Date performed: 6/8/2016 Analysis time period: PM Peak Hour Freeway/Dir of Travel: I-80 Westbound Junction: Sierra College Blvd Off Ramp Jurisdiction: Caltrans Analysis Year: Existing + AP + Project Description: Sierra Gateway Apartments TIS Freeway Data Type of analysis Diverge Number of lanes in freeway 3 Free-flow speed on freeway 65.0 mph Volume on freeway 3557 vph Off Ramp Data Side of freeway Right Number of lanes in ramp 1 Free-Flow speed on ramp 35.0 mph Volume on ramp 756 vph Length of first accel/decel lane 650 ft Length of second accel/decel lane ft Adjacent Ramp Data (if one exists) Does adjacent ramp exist? Yes Volume on adjacent ramp 296 vph Position of adjacent ramp Downstream Type of adjacent ramp On Distance to adjacent ramp 1650 ft Conversion to pc/h Under Base Conditions Junction Components Freeway Ramp Adjacent Ramp Volume, V (vph) vph Peak-hour factor, PHF Peak 15-min volume, v v Trucks and buses % Recreational vehicles % Terrain type: Level Level Level Grade 0.00 % 0.00 % 0.00 % Length 0.00 mi 0.00 mi 0.00 mi Trucks and buses PCE, ET Recreational vehicle PCE, ER
340 Heavy vehicle adjustment, fhv Driver population factor, fp Flow rate, vp pcph Estimation of V12 Diverge Areas L = (Equation or 13-13) EQ P = Using Equation 9 FD v = v + (v - v ) P = 2818 pc/h 12 R F R FD Capacity Checks Actual Maximum LOS F? v = v No Fi F v = v - v No FO F R v No R v or v 1222 pc/h (Equation or 13-17) Is v or v > 2700 pc/h? No Is v or v > 1.5 v /2 No 12 If yes, v = 2818 (Equation 13-15, 13-16, 13-18, or 13-19) 12A Flow Entering Diverge Influence Area Actual Max Desirable Violation? v No 12 Level of Service Determination (if not F) Density, D = v L = 22.6 pc/mi/ln R 12 D Level of service for ramp-freeway junction areas of influence C Speed Estimation Intermediate speed variable, D = S Space mean speed in ramp influence area, S = 53.5 mph R Space mean speed in outer lanes, S = 70.4 mph 0 Space mean speed for all vehicles, S = 57.7 mph
341 HCS 2010: Freeway Merge and Diverge Segments Release 6.70 Phone: Fax: Merge Analysis Analyst: Makinzie Clark Agency/Co.: Omni-Means Date performed: 6/8/2016 Analysis time period: PM Peak Hour Freeway/Dir of Travel: I-80 Westbound Junction: Sierra College Blvd On Loop Jurisdiction: Caltrans Analysis Year: Existing + AP + Project Description: Sierra Gateway Apartments TIS Freeway Data Type of analysis Merge Number of lanes in freeway 3 Free-flow speed on freeway 65.0 mph Volume on freeway 2801 vph On Ramp Data Side of freeway Right Number of lanes in ramp 1 Free-flow speed on ramp 25.0 mph Volume on ramp 296 vph Length of first accel/decel lane 700 ft Length of second accel/decel lane ft Adjacent Ramp Data (if one exists) Does adjacent ramp exist? Yes Volume on adjacent Ramp 410 vph Position of adjacent Ramp Downstream Type of adjacent Ramp On Distance to adjacent Ramp 1560 ft Conversion to pc/h Under Base Conditions Junction Components Freeway Ramp Adjacent Ramp Volume, V (vph) vph Peak-hour factor, PHF Peak 15-min volume, v v Trucks and buses % Recreational vehicles % Terrain type: Level Level Level Grade % % % Length mi mi mi Trucks and buses PCE, ET Recreational vehicle PCE, ER
342 Heavy vehicle adjustment, fhv Driver population factor, fp Flow rate, vp pcph Estimation of V12 Merge Areas L = (Equation 13-6 or 13-7) EQ P = Using Equation 3 FM v = v (P ) = 1900 pc/h 12 F FM Capacity Checks Actual Maximum LOS F? v No FO v or v 1282 pc/h (Equation or 13-17) Is v or v > 2700 pc/h? No Is v or v > 1.5 v /2 Yes 12 If yes, v = 1900 (Equation 13-15, 13-16, 13-18, or 13-19) 12A Flow Entering Merge Influence Area Actual Max Desirable Violation? v No 12A Level of Service Determination (if not F) Density, D = v v L = 18.2 pc/mi/ln R R 12 A Level of service for ramp-freeway junction areas of influence B Speed Estimation Intermediate speed variable, M = S Space mean speed in ramp influence area, S = 57.6 mph R Space mean speed in outer lanes, S = 62.2 mph 0 Space mean speed for all vehicles, S = 59.2 mph
343 HCS 2010: Freeway Merge and Diverge Segments Release 6.70 Phone: Fax: Merge Analysis Analyst: Makinzie Clark Agency/Co.: Omni-Means Date performed: 6/8/2016 Analysis time period: PM Peak Hour Freeway/Dir of Travel: I-80 Westbound Junction: Sierra Collge Blvd On Ramp Jurisdiction: Caltrans Analysis Year: Existing + AP + Project Description: Sierra Gateway Apartments TIS Freeway Data Type of analysis Merge Number of lanes in freeway 3 Free-flow speed on freeway 65.0 mph Volume on freeway 3097 vph On Ramp Data Side of freeway Right Number of lanes in ramp 1 Free-flow speed on ramp 35.0 mph Volume on ramp 410 vph Length of first accel/decel lane 700 ft Length of second accel/decel lane ft Adjacent Ramp Data (if one exists) Does adjacent ramp exist? Yes Volume on adjacent Ramp 410 vph Position of adjacent Ramp Upstream Type of adjacent Ramp On Distance to adjacent Ramp 1560 ft Conversion to pc/h Under Base Conditions Junction Components Freeway Ramp Adjacent Ramp Volume, V (vph) vph Peak-hour factor, PHF Peak 15-min volume, v v Trucks and buses % Recreational vehicles % Terrain type: Level Level Level Grade % % % Length mi mi mi Trucks and buses PCE, ET Recreational vehicle PCE, ER
344 Heavy vehicle adjustment, fhv Driver population factor, fp Flow rate, vp pcph Estimation of V12 Merge Areas L = (Equation 13-6 or 13-7) EQ P = Using Equation 3 FM v = v (P ) = 2101 pc/h 12 F FM Capacity Checks Actual Maximum LOS F? v No FO v or v 1417 pc/h (Equation or 13-17) Is v or v > 2700 pc/h? No Is v or v > 1.5 v /2 Yes 12 If yes, v = 2101 (Equation 13-15, 13-16, 13-18, or 13-19) 12A Flow Entering Merge Influence Area Actual Max Desirable Violation? v No 12A Level of Service Determination (if not F) Density, D = v v L = 20.7 pc/mi/ln R R 12 A Level of service for ramp-freeway junction areas of influence C Speed Estimation Intermediate speed variable, M = S Space mean speed in ramp influence area, S = 57.6 mph R Space mean speed in outer lanes, S = 61.7 mph 0 Space mean speed for all vehicles, S = 59.0 mph
345 HCS 2010: Basic Freeway Segments Release 6.70 Phone: Fax: Operational Analysis Analyst: Makinzie Clark Agency or Company: Omni-Means Date Performed: 6/8/2016 Analysis Time Period: PM Peak Hour Freeway/Direction: I-80 Westbound From/To: Sierra College Blvd/Rocklin Rd Jurisdiction: Caltrans Analysis Year: Existing + AP + Project Description: Sierra Gateway Apartments TIS Flow Inputs and Adjustments Volume, V 3507 veh/h Peak-hour factor, PHF 0.92 Peak 15-min volume, v v Trucks and buses 9 % Recreational vehicles 0 % Terrain type: Level Grade - % Segment length - mi Trucks and buses PCE, ET 1.5 Recreational vehicle PCE, ER 1.2 Heavy vehicle adjustment, fhv Driver population factor, fp 1.00 Flow rate, vp 1328 pc/h/ln Speed Inputs and Adjustments Lane width - ft Right-side lateral clearance - ft Total ramp density, TRD - ramps/mi Number of lanes, N 3 Free-flow speed: Measured FFS or BFFS 65.0 mi/h Lane width adjustment, flw - mi/h Lateral clearance adjustment, flc - mi/h TRD adjustment - mi/h Free-flow speed, FFS 65.0 mi/h LOS and Performance Measures Flow rate, vp 1328 pc/h/ln Free-flow speed, FFS 65.0 mi/h Average passenger-car speed, S 65.0 mi/h Number of lanes, N 3 Density, D 20.4 pc/mi/ln Level of service, LOS C
346 HCS 2010: Basic Freeway Segments Release 6.70 Phone: Fax: Operational Analysis Analyst: Makinzie Clark Agency or Company: Omni-Means Date Performed: 6/14/16 Analysis Time Period: AM Peak Hour Freeway/Direction: I-80 Eastbound From/To: South of Rocklin Road Jurisdiction: Caltrans Analysis Year: Cumulative Description: Sierra Gateway Apartments TIS Flow Inputs and Adjustments Volume, V 5516 veh/h Peak-hour factor, PHF 0.92 Peak 15-min volume, v v Trucks and buses 9 % Recreational vehicles 0 % Terrain type: Level Grade - % Segment length - mi Trucks and buses PCE, ET 1.5 Recreational vehicle PCE, ER 1.2 Heavy vehicle adjustment, fhv Driver population factor, fp 1.00 Flow rate, vp 2088 pc/h/ln Speed Inputs and Adjustments Lane width - ft Right-side lateral clearance - ft Total ramp density, TRD - ramps/mi Number of lanes, N 3 Free-flow speed: Measured FFS or BFFS 65.0 mi/h Lane width adjustment, flw - mi/h Lateral clearance adjustment, flc - mi/h TRD adjustment - mi/h Free-flow speed, FFS 65.0 mi/h LOS and Performance Measures Flow rate, vp 2088 pc/h/ln Free-flow speed, FFS 65.0 mi/h Average passenger-car speed, S 58.3 mi/h Number of lanes, N 3 Density, D 35.8 pc/mi/ln Level of service, LOS E
347 HCS 2010: Freeway Merge and Diverge Segments Release 6.70 Phone: Fax: Diverge Analysis Analyst: Makinzie Clark Agency/Co.: Omni-Means Date performed: 6/14/16 Analysis time period: AM Peak Hour Freeway/Dir of Travel: I-80 Eastbound Junction: Rocklin Road Off Ramp Jurisdiction: Caltrans Analysis Year: Cumulative Description: Sierra Gateway Apartments TIS Freeway Data Type of analysis Diverge Number of lanes in freeway 3 Free-flow speed on freeway 65.0 mph Volume on freeway 5516 vph Off Ramp Data Side of freeway Right Number of lanes in ramp 1 Free-Flow speed on ramp 35.0 mph Volume on ramp 1810 vph Length of first accel/decel lane 1050 ft Length of second accel/decel lane ft Adjacent Ramp Data (if one exists) Does adjacent ramp exist? Volume on adjacent ramp Position of adjacent ramp Type of adjacent ramp Distance to adjacent ramp No vph ft Conversion to pc/h Under Base Conditions Junction Components Freeway Ramp Adjacent Ramp Volume, V (vph) vph Peak-hour factor, PHF Peak 15-min volume, v v Trucks and buses 9 2 % Recreational vehicles 0 0 % Terrain type: Level Level Grade 0.00 % 0.00 % % Length 0.00 mi 0.00 mi mi Trucks and buses PCE, ET Recreational vehicle PCE, ER
348 Heavy vehicle adjustment, fhv Driver population factor, fp Flow rate, vp pcph Estimation of V12 Diverge Areas L = (Equation or 13-13) EQ P = Using Equation 9 FD v = v + (v - v ) P = 4165 pc/h 12 R F R FD Capacity Checks Actual Maximum LOS F? v = v No Fi F v = v - v No FO F R v No R v or v 2100 pc/h (Equation or 13-17) Is v or v > 2700 pc/h? No Is v or v > 1.5 v /2 No 12 If yes, v = 4165 (Equation 13-15, 13-16, 13-18, or 13-19) 12A Flow Entering Diverge Influence Area Actual Max Desirable Violation? v No 12 Level of Service Determination (if not F) Density, D = v L = 30.6 pc/mi/ln R 12 D Level of service for ramp-freeway junction areas of influence D Speed Estimation Intermediate speed variable, D = S Space mean speed in ramp influence area, S = 51.1 mph R Space mean speed in outer lanes, S = 67.0 mph 0 Space mean speed for all vehicles, S = 55.5 mph
349 HCS 2010: Freeway Merge and Diverge Segments Release 6.70 Phone: Fax: Merge Analysis Analyst: Makinzie Clark Agency/Co.: Omni-Means Date performed: 6/14/16 Analysis time period: AM Peak Freeway/Dir of Travel: I-80 Eastbound Junction: Rocklin Road On Ramp Jurisdiction: Caltrans Analysis Year: Cumulative Description: Sierra Gateway Apartments TIS Freeway Data Type of analysis Merge Number of lanes in freeway 3 Free-flow speed on freeway 65.0 mph Volume on freeway 3706 vph On Ramp Data Side of freeway Right Number of lanes in ramp 1 Free-flow speed on ramp 35.0 mph Volume on ramp 355 vph Length of first accel/decel lane 360 ft Length of second accel/decel lane ft Adjacent Ramp Data (if one exists) Does adjacent ramp exist? Volume on adjacent Ramp Position of adjacent Ramp Type of adjacent Ramp Distance to adjacent Ramp No vph ft Conversion to pc/h Under Base Conditions Junction Components Freeway Ramp Adjacent Ramp Volume, V (vph) vph Peak-hour factor, PHF Peak 15-min volume, v v Trucks and buses 9 2 % Recreational vehicles 0 0 % Terrain type: Level Level Grade % % % Length mi mi mi Trucks and buses PCE, ET Recreational vehicle PCE, ER
350 Heavy vehicle adjustment, fhv Driver population factor, fp Flow rate, vp pcph Estimation of V12 Merge Areas L = (Equation 13-6 or 13-7) EQ P = Using Equation 3 FM v = v (P ) = 2474 pc/h 12 F FM Capacity Checks Actual Maximum LOS F? v No FO v or v 1736 pc/h (Equation or 13-17) Is v or v > 2700 pc/h? No Is v or v > 1.5 v /2 Yes 12 If yes, v = 2474 (Equation 13-15, 13-16, 13-18, or 13-19) 12A Flow Entering Merge Influence Area Actual Max Desirable Violation? v No 12A Level of Service Determination (if not F) Density, D = v v L = 25.3 pc/mi/ln R R 12 A Level of service for ramp-freeway junction areas of influence C Speed Estimation Intermediate speed variable, M = S Space mean speed in ramp influence area, S = 56.6 mph R Space mean speed in outer lanes, S = 60.6 mph 0 Space mean speed for all vehicles, S = 58.1 mph
351 HCS 2010: Freeway Merge and Diverge Segments Release 6.70 Phone: Fax: Diverge Analysis Analyst: Makinzie Clark Agency/Co.: Omni-Means Date performed: 6/14/16 Analysis time period: AM Peak Hour Freeway/Dir of Travel: I-80 Westbound Junction: Rocklin Road Off Ramp Jurisdiction: Caltrans Analysis Year: Cumulative Description: Sierra Gateway Apartments TIS Freeway Data Type of analysis Diverge Number of lanes in freeway 3 Free-flow speed on freeway 65.0 mph Volume on freeway 5420 vph Off Ramp Data Side of freeway Right Number of lanes in ramp 1 Free-Flow speed on ramp 35.0 mph Volume on ramp 635 vph Length of first accel/decel lane 150 ft Length of second accel/decel lane ft Adjacent Ramp Data (if one exists) Does adjacent ramp exist? Volume on adjacent ramp Position of adjacent ramp Type of adjacent ramp Distance to adjacent ramp No vph ft Conversion to pc/h Under Base Conditions Junction Components Freeway Ramp Adjacent Ramp Volume, V (vph) vph Peak-hour factor, PHF Peak 15-min volume, v v Trucks and buses 9 3 % Recreational vehicles 0 0 % Terrain type: Level Level Grade 0.00 % 0.00 % % Length 0.00 mi 0.00 mi mi Trucks and buses PCE, ET Recreational vehicle PCE, ER
352 Heavy vehicle adjustment, fhv Driver population factor, fp Flow rate, vp pcph Estimation of V12 Diverge Areas L = (Equation or 13-13) EQ P = Using Equation 9 FD v = v + (v - v ) P = 3829 pc/h 12 R F R FD Capacity Checks Actual Maximum LOS F? v = v No Fi F v = v - v No FO F R v No R v or v 2327 pc/h (Equation or 13-17) Is v or v > 2700 pc/h? No Is v or v > 1.5 v /2 No 12 If yes, v = 3829 (Equation 13-15, 13-16, 13-18, or 13-19) 12A Flow Entering Diverge Influence Area Actual Max Desirable Violation? v No 12 Level of Service Determination (if not F) Density, D = v L = 35.8 pc/mi/ln R 12 D Level of service for ramp-freeway junction areas of influence E Speed Estimation Intermediate speed variable, D = S Space mean speed in ramp influence area, S = 53.7 mph R Space mean speed in outer lanes, S = 66.1 mph 0 Space mean speed for all vehicles, S = 57.8 mph
353 HCS 2010: Freeway Merge and Diverge Segments Release 6.70 Phone: Fax: Merge Analysis Analyst: Makinzie Clark Agency/Co.: Omni-Means Date performed: 6/14/16 Analysis time period: AM Peak Hour Freeway/Dir of Travel: I-80 Westbound Junction: Rocklin Road On Ramp Jurisdiction: Caltrans Analysis Year: Cumulative Description: Sierra Gateway Apartments TIS Freeway Data Type of analysis Merge Number of lanes in freeway 3 Free-flow speed on freeway 65.0 mph Volume on freeway 4785 vph On Ramp Data Side of freeway Right Number of lanes in ramp 1 Free-flow speed on ramp 35.0 mph Volume on ramp 970 vph Length of first accel/decel lane 750 ft Length of second accel/decel lane ft Adjacent Ramp Data (if one exists) Does adjacent ramp exist? Volume on adjacent Ramp Position of adjacent Ramp Type of adjacent Ramp Distance to adjacent Ramp No vph ft Conversion to pc/h Under Base Conditions Junction Components Freeway Ramp Adjacent Ramp Volume, V (vph) vph Peak-hour factor, PHF Peak 15-min volume, v v Trucks and buses 9 3 % Recreational vehicles 0 0 % Terrain type: Level Level Grade % % % Length mi mi mi Trucks and buses PCE, ET Recreational vehicle PCE, ER
354 Heavy vehicle adjustment, fhv Driver population factor, fp Flow rate, vp pcph Estimation of V12 Merge Areas L = (Equation 13-6 or 13-7) EQ P = Using Equation 3 FM v = v (P ) = 3253 pc/h 12 F FM Capacity Checks Actual Maximum LOS F? v No FO v or v 2182 pc/h (Equation or 13-17) Is v or v > 2700 pc/h? No Is v or v > 1.5 v /2 Yes 12 If yes, v = 3253 (Equation 13-15, 13-16, 13-18, or 13-19) 12A Flow Entering Merge Influence Area Actual Max Desirable Violation? v No 12A Level of Service Determination (if not F) Density, D = v v L = 33.8 pc/mi/ln R R 12 A Level of service for ramp-freeway junction areas of influence D Speed Estimation Intermediate speed variable, M = S Space mean speed in ramp influence area, S = 52.2 mph R Space mean speed in outer lanes, S = 58.9 mph 0 Space mean speed for all vehicles, S = 54.3 mph
355 HCS 2010: Basic Freeway Segments Release 6.70 Phone: Fax: Operational Analysis Analyst: Makinzie Clark Agency or Company: Omni-Means Date Performed: 6/14/16 Analysis Time Period: AM Peak Hour Freeway/Direction: I-80 Westbound From/To: South of Rocklin Road Jurisdiction: Caltrans Analysis Year: Cumulative Description: Sierra Gateway Apartments TIS Flow Inputs and Adjustments Volume, V 5755 veh/h Peak-hour factor, PHF 0.92 Peak 15-min volume, v v Trucks and buses 9 % Recreational vehicles 0 % Terrain type: Level Grade - % Segment length - mi Trucks and buses PCE, ET 1.5 Recreational vehicle PCE, ER 1.2 Heavy vehicle adjustment, fhv Driver population factor, fp 1.00 Flow rate, vp 2179 pc/h/ln Speed Inputs and Adjustments Lane width - ft Right-side lateral clearance - ft Total ramp density, TRD - ramps/mi Number of lanes, N 3 Free-flow speed: Measured FFS or BFFS 65.0 mi/h Lane width adjustment, flw - mi/h Lateral clearance adjustment, flc - mi/h TRD adjustment - mi/h Free-flow speed, FFS 65.0 mi/h LOS and Performance Measures Flow rate, vp 2179 pc/h/ln Free-flow speed, FFS 65.0 mi/h Average passenger-car speed, S 56.4 mi/h Number of lanes, N 3 Density, D 38.6 pc/mi/ln Level of service, LOS E
356 HCS 2010: Basic Freeway Segments Release 6.70 Phone: Fax: Operational Analysis Analyst: Makinzie Clark Agency or Company: Omni-Means Date Performed: 6/14/16 Analysis Time Period: AM Peak Hour Freeway/Direction: I-80 Eastbound From/To: Rocklin Rd/Sierra College Blvd Jurisdiction: Caltrans Analysis Year: Cumulative Description: Sierra Gateway Apartments TIS Flow Inputs and Adjustments Volume, V 4061 veh/h Peak-hour factor, PHF 0.92 Peak 15-min volume, v v Trucks and buses 9 % Recreational vehicles 0 % Terrain type: Level Grade - % Segment length - mi Trucks and buses PCE, ET 1.5 Recreational vehicle PCE, ER 1.2 Heavy vehicle adjustment, fhv Driver population factor, fp 1.00 Flow rate, vp 1538 pc/h/ln Speed Inputs and Adjustments Lane width - ft Right-side lateral clearance - ft Total ramp density, TRD - ramps/mi Number of lanes, N 3 Free-flow speed: Measured FFS or BFFS 65.0 mi/h Lane width adjustment, flw - mi/h Lateral clearance adjustment, flc - mi/h TRD adjustment - mi/h Free-flow speed, FFS 65.0 mi/h LOS and Performance Measures Flow rate, vp 1538 pc/h/ln Free-flow speed, FFS 65.0 mi/h Average passenger-car speed, S 64.7 mi/h Number of lanes, N 3 Density, D 23.8 pc/mi/ln Level of service, LOS C
357 HCS 2010: Freeway Merge and Diverge Segments Release 6.70 Phone: Fax: Diverge Analysis Analyst: Makinzie Clark Agency/Co.: Omni-Means Date performed: 6/14/16 Analysis time period: AM Peak Hour Freeway/Dir of Travel: I-80 Eastound Junction: Sierra College Blvd Off Ramp Jurisdiction: Caltrans Analysis Year: Cumulative Description: Sierra Gateway Apartments TIS Freeway Data Type of analysis Diverge Number of lanes in freeway 3 Free-flow speed on freeway 65.0 mph Volume on freeway 4061 vph Off Ramp Data Side of freeway Right Number of lanes in ramp 1 Free-Flow speed on ramp 35.0 mph Volume on ramp 1650 vph Length of first accel/decel lane 150 ft Length of second accel/decel lane ft Adjacent Ramp Data (if one exists) Does adjacent ramp exist? Yes Volume on adjacent ramp 195 vph Position of adjacent ramp Downstream Type of adjacent ramp On Distance to adjacent ramp 1560 ft Conversion to pc/h Under Base Conditions Junction Components Freeway Ramp Adjacent Ramp Volume, V (vph) vph Peak-hour factor, PHF Peak 15-min volume, v v Trucks and buses % Recreational vehicles % Terrain type: Level Level Level Grade 0.00 % 0.00 % 0.00 % Length 0.00 mi 0.00 mi 0.00 mi Trucks and buses PCE, ET Recreational vehicle PCE, ER
358 Heavy vehicle adjustment, fhv Driver population factor, fp Flow rate, vp pcph Estimation of V12 Diverge Areas L = (Equation or 13-13) EQ P = Using Equation 9 FD v = v + (v - v ) P = 3390 pc/h 12 R F R FD Capacity Checks Actual Maximum LOS F? v = v No Fi F v = v - v No FO F R v No R v or v 1223 pc/h (Equation or 13-17) Is v or v > 2700 pc/h? No Is v or v > 1.5 v /2 No 12 If yes, v = 3390 (Equation 13-15, 13-16, 13-18, or 13-19) 12A Flow Entering Diverge Influence Area Actual Max Desirable Violation? v No 12 Level of Service Determination (if not F) Density, D = v L = 32.1 pc/mi/ln R 12 D Level of service for ramp-freeway junction areas of influence D Speed Estimation Intermediate speed variable, D = S Space mean speed in ramp influence area, S = 51.4 mph R Space mean speed in outer lanes, S = 70.4 mph 0 Space mean speed for all vehicles, S = 55.3 mph
359 HCS 2010: Freeway Merge and Diverge Segments Release 6.70 Phone: Fax: Merge Analysis Analyst: Makinzie Clark Agency/Co.: Omni-Means Date performed: 6/14/16 Analysis time period: AM Peak Hour Freeway/Dir of Travel: I-80 Eastbound Junction: Sierra College Blvd On Loop Jurisdiction: Caltrans Analysis Year: Cumulative Description: Sierra Gateway Apartments TIS Freeway Data Type of analysis Merge Number of lanes in freeway 3 Free-flow speed on freeway 65.0 mph Volume on freeway 2411 vph On Ramp Data Side of freeway Right Number of lanes in ramp 1 Free-flow speed on ramp 25.0 mph Volume on ramp 195 vph Length of first accel/decel lane 800 ft Length of second accel/decel lane ft Adjacent Ramp Data (if one exists) Does adjacent ramp exist? Yes Volume on adjacent Ramp 560 vph Position of adjacent Ramp Downstream Type of adjacent Ramp On Distance to adjacent Ramp 1420 ft Conversion to pc/h Under Base Conditions Junction Components Freeway Ramp Adjacent Ramp Volume, V (vph) vph Peak-hour factor, PHF Peak 15-min volume, v v Trucks and buses % Recreational vehicles % Terrain type: Level Level Level Grade % % % Length mi mi mi Trucks and buses PCE, ET Recreational vehicle PCE, ER
360 Heavy vehicle adjustment, fhv Driver population factor, fp Flow rate, vp pcph Estimation of V12 Merge Areas L = (Equation 13-6 or 13-7) EQ P = Using Equation 3 FM v = v (P ) = 1643 pc/h 12 F FM Capacity Checks Actual Maximum LOS F? v No FO v or v 1096 pc/h (Equation or 13-17) Is v or v > 2700 pc/h? No Is v or v > 1.5 v /2 Yes 12 If yes, v = 1643 (Equation 13-15, 13-16, 13-18, or 13-19) 12A Flow Entering Merge Influence Area Actual Max Desirable Violation? v No 12A Level of Service Determination (if not F) Density, D = v v L = 14.9 pc/mi/ln R R 12 A Level of service for ramp-freeway junction areas of influence B Speed Estimation Intermediate speed variable, M = S Space mean speed in ramp influence area, S = 58.0 mph R Space mean speed in outer lanes, S = 62.9 mph 0 Space mean speed for all vehicles, S = 59.7 mph
361 HCS 2010: Freeway Merge and Diverge Segments Release 6.70 Phone: Fax: Merge Analysis Analyst: Makinzie Clark Agency/Co.: Omni-Means Date performed: 6/14/16 Analysis time period: AM Peak Hour Freeway/Dir of Travel: I-80 Eastbound Junction: Sierra College Blvd On Ramp Jurisdiction: Caltrans Analysis Year: Cumulative Description: Sierra Gateway Apartments TIS Freeway Data Type of analysis Merge Number of lanes in freeway 3 Free-flow speed on freeway 65.0 mph Volume on freeway 2606 vph On Ramp Data Side of freeway Right Number of lanes in ramp 1 Free-flow speed on ramp 35.0 mph Volume on ramp 560 vph Length of first accel/decel lane 700 ft Length of second accel/decel lane ft Adjacent Ramp Data (if one exists) Does adjacent ramp exist? Yes Volume on adjacent Ramp 195 vph Position of adjacent Ramp Upstream Type of adjacent Ramp On Distance to adjacent Ramp 1420 ft Conversion to pc/h Under Base Conditions Junction Components Freeway Ramp Adjacent Ramp Volume, V (vph) vph Peak-hour factor, PHF Peak 15-min volume, v v Trucks and buses % Recreational vehicles % Terrain type: Level Level Level Grade % % % Length mi mi mi Trucks and buses PCE, ET Recreational vehicle PCE, ER
362 Heavy vehicle adjustment, fhv Driver population factor, fp Flow rate, vp pcph Estimation of V12 Merge Areas L = (Equation 13-6 or 13-7) EQ P = Using Equation 3 FM v = v (P ) = 1767 pc/h 12 F FM Capacity Checks Actual Maximum LOS F? v No FO v or v 1193 pc/h (Equation or 13-17) Is v or v > 2700 pc/h? No Is v or v > 1.5 v /2 Yes 12 If yes, v = 1767 (Equation 13-15, 13-16, 13-18, or 13-19) 12A Flow Entering Merge Influence Area Actual Max Desirable Violation? v No 12A Level of Service Determination (if not F) Density, D = v v L = 19.4 pc/mi/ln R R 12 A Level of service for ramp-freeway junction areas of influence B Speed Estimation Intermediate speed variable, M = S Space mean speed in ramp influence area, S = 57.8 mph R Space mean speed in outer lanes, S = 62.5 mph 0 Space mean speed for all vehicles, S = 59.3 mph
363 HCS 2010: Basic Freeway Segments Release 6.70 Phone: Fax: Operational Analysis Analyst: Makinzie Clark Agency or Company: Omni-Means Date Performed: 6/14/16 Analysis Time Period: AM Peak Hour Freeway/Direction: I-80 Eastbound From/To: North of Sierra College Blvd Jurisdiction: Caltrans Analysis Year: Cumulative Description: Sierra Gateway Apartments TIS Flow Inputs and Adjustments Volume, V 3166 veh/h Peak-hour factor, PHF 0.92 Peak 15-min volume, v v Trucks and buses 9 % Recreational vehicles 0 % Terrain type: Level Grade - % Segment length - mi Trucks and buses PCE, ET 1.5 Recreational vehicle PCE, ER 1.2 Heavy vehicle adjustment, fhv Driver population factor, fp 1.00 Flow rate, vp 1199 pc/h/ln Speed Inputs and Adjustments Lane width - ft Right-side lateral clearance - ft Total ramp density, TRD - ramps/mi Number of lanes, N 3 Free-flow speed: Measured FFS or BFFS 65.0 mi/h Lane width adjustment, flw - mi/h Lateral clearance adjustment, flc - mi/h TRD adjustment - mi/h Free-flow speed, FFS 65.0 mi/h LOS and Performance Measures Flow rate, vp 1199 pc/h/ln Free-flow speed, FFS 65.0 mi/h Average passenger-car speed, S 65.0 mi/h Number of lanes, N 3 Density, D 18.4 pc/mi/ln Level of service, LOS C
364 HCS 2010: Basic Freeway Segments Release 6.70 Phone: Fax: Operational Analysis Analyst: Makinzie Clark Agency or Company: Omni-Means Date Performed: 6/14/16 Analysis Time Period: AM Peak Hour Freeway/Direction: I-80 Westbound From/To: North of Sierra College Blvd Jurisdiction: Caltrans Analysis Year: Cumulative Description: Sierra Gateway Apartments TIS Flow Inputs and Adjustments Volume, V 6070 veh/h Peak-hour factor, PHF 0.92 Peak 15-min volume, v v Trucks and buses 9 % Recreational vehicles 0 % Terrain type: Level Grade - % Segment length - mi Trucks and buses PCE, ET 1.5 Recreational vehicle PCE, ER 1.2 Heavy vehicle adjustment, fhv Driver population factor, fp 1.00 Flow rate, vp 2298 pc/h/ln Speed Inputs and Adjustments Lane width - ft Right-side lateral clearance - ft Total ramp density, TRD - ramps/mi Number of lanes, N 3 Free-flow speed: Measured FFS or BFFS 65.0 mi/h Lane width adjustment, flw - mi/h Lateral clearance adjustment, flc - mi/h TRD adjustment - mi/h Free-flow speed, FFS 65.0 mi/h LOS and Performance Measures Flow rate, vp 2298 pc/h/ln Free-flow speed, FFS 65.0 mi/h Average passenger-car speed, S 53.6 mi/h Number of lanes, N 3 Density, D 42.9 pc/mi/ln Level of service, LOS E
365 HCS 2010: Freeway Merge and Diverge Segments Release 6.70 Phone: Fax: Diverge Analysis Analyst: Makinzie Clark Agency/Co.: Omni-Means Date performed: 6/14/16 Analysis time period: AM Peak Hour Freeway/Dir of Travel: I-80 Westbound Junction: Sierra College Blvd Off Ramp Jurisdiction: Caltrans Analysis Year: Cumulative Description: Sierra Gateway Apartments TIS Freeway Data Type of analysis Diverge Number of lanes in freeway 3 Free-flow speed on freeway 65.0 mph Volume on freeway 6070 vph Off Ramp Data Side of freeway Right Number of lanes in ramp 1 Free-Flow speed on ramp 35.0 mph Volume on ramp 1485 vph Length of first accel/decel lane 650 ft Length of second accel/decel lane ft Adjacent Ramp Data (if one exists) Does adjacent ramp exist? Yes Volume on adjacent ramp 150 vph Position of adjacent ramp Downstream Type of adjacent ramp On Distance to adjacent ramp 1650 ft Conversion to pc/h Under Base Conditions Junction Components Freeway Ramp Adjacent Ramp Volume, V (vph) vph Peak-hour factor, PHF Peak 15-min volume, v v Trucks and buses % Recreational vehicles % Terrain type: Level Level Level Grade 0.00 % 0.00 % 0.00 % Length 0.00 mi 0.00 mi 0.00 mi Trucks and buses PCE, ET Recreational vehicle PCE, ER
366 Heavy vehicle adjustment, fhv Driver population factor, fp Flow rate, vp pcph Estimation of V12 Diverge Areas L = (Equation or 13-13) EQ P = Using Equation 9 FD v = v + (v - v ) P = 4329 pc/h 12 R F R FD Capacity Checks Actual Maximum LOS F? v = v No Fi F v = v - v No FO F R v No R v or v 2566 pc/h (Equation or 13-17) Is v or v > 2700 pc/h? No Is v or v > 1.5 v /2 No 12 If yes, v = 4329 (Equation 13-15, 13-16, 13-18, or 13-19) 12A Flow Entering Diverge Influence Area Actual Max Desirable Violation? v No 12 Level of Service Determination (if not F) Density, D = v L = 35.6 pc/mi/ln R 12 D Level of service for ramp-freeway junction areas of influence E Speed Estimation Intermediate speed variable, D = S Space mean speed in ramp influence area, S = 51.8 mph R Space mean speed in outer lanes, S = 65.2 mph 0 Space mean speed for all vehicles, S = 56.1 mph
367 HCS 2010: Freeway Merge and Diverge Segments Release 6.70 Phone: Fax: Merge Analysis Analyst: Makinzie Clark Agency/Co.: Omni-Means Date performed: 6/14/16 Analysis time period: AM Peak Hour Freeway/Dir of Travel: I-80 Westbound Junction: Sierra College Blvd On Loop Jurisdiction: Caltrans Analysis Year: Cumulative Description: Sierra Gateway Apartments TIS Freeway Data Type of analysis Merge Number of lanes in freeway 3 Free-flow speed on freeway 65.0 mph Volume on freeway 4735 vph On Ramp Data Side of freeway Right Number of lanes in ramp 1 Free-flow speed on ramp 25.0 mph Volume on ramp 150 vph Length of first accel/decel lane 700 ft Length of second accel/decel lane ft Adjacent Ramp Data (if one exists) Does adjacent ramp exist? Yes Volume on adjacent Ramp 685 vph Position of adjacent Ramp Downstream Type of adjacent Ramp On Distance to adjacent Ramp 1560 ft Conversion to pc/h Under Base Conditions Junction Components Freeway Ramp Adjacent Ramp Volume, V (vph) vph Peak-hour factor, PHF Peak 15-min volume, v v Trucks and buses % Recreational vehicles % Terrain type: Level Level Level Grade % % % Length mi mi mi Trucks and buses PCE, ET Recreational vehicle PCE, ER
368 Heavy vehicle adjustment, fhv Driver population factor, fp Flow rate, vp pcph Estimation of V12 Merge Areas L = (Equation 13-6 or 13-7) EQ P = Using Equation 3 FM v = v (P ) = 3211 pc/h 12 F FM Capacity Checks Actual Maximum LOS F? v No FO v or v 2167 pc/h (Equation or 13-17) Is v or v > 2700 pc/h? No Is v or v > 1.5 v /2 Yes 12 If yes, v = 3211 (Equation 13-15, 13-16, 13-18, or 13-19) 12A Flow Entering Merge Influence Area Actual Max Desirable Violation? v No 12A Level of Service Determination (if not F) Density, D = v v L = 27.3 pc/mi/ln R R 12 A Level of service for ramp-freeway junction areas of influence C Speed Estimation Intermediate speed variable, M = S Space mean speed in ramp influence area, S = 55.8 mph R Space mean speed in outer lanes, S = 59.0 mph 0 Space mean speed for all vehicles, S = 57.0 mph
369 HCS 2010: Freeway Merge and Diverge Segments Release 6.70 Phone: Fax: Merge Analysis Analyst: Makinzie Clark Agency/Co.: Omni-Means Date performed: 6/14/16 Analysis time period: AM Peak Hour Freeway/Dir of Travel: I-80 Westbound Junction: Sierra College Blvd On Ramp Jurisdiction: Caltrans Analysis Year: Cumulative Description: Sierra Gateway Apartments TIS Freeway Data Type of analysis Merge Number of lanes in freeway 3 Free-flow speed on freeway 65.0 mph Volume on freeway 4735 vph On Ramp Data Side of freeway Right Number of lanes in ramp 1 Free-flow speed on ramp 35.0 mph Volume on ramp 685 vph Length of first accel/decel lane 700 ft Length of second accel/decel lane ft Adjacent Ramp Data (if one exists) Does adjacent ramp exist? Yes Volume on adjacent Ramp 150 vph Position of adjacent Ramp Upstream Type of adjacent Ramp On Distance to adjacent Ramp 1560 ft Conversion to pc/h Under Base Conditions Junction Components Freeway Ramp Adjacent Ramp Volume, V (vph) vph Peak-hour factor, PHF Peak 15-min volume, v v Trucks and buses % Recreational vehicles % Terrain type: Level Level Level Grade % % % Length mi mi mi Trucks and buses PCE, ET Recreational vehicle PCE, ER
370 Heavy vehicle adjustment, fhv Driver population factor, fp Flow rate, vp pcph Estimation of V12 Merge Areas L = (Equation 13-6 or 13-7) EQ P = Using Equation 3 FM v = v (P ) = 3211 pc/h 12 F FM Capacity Checks Actual Maximum LOS F? v No FO v or v 2167 pc/h (Equation or 13-17) Is v or v > 2700 pc/h? No Is v or v > 1.5 v /2 Yes 12 If yes, v = 3211 (Equation 13-15, 13-16, 13-18, or 13-19) 12A Flow Entering Merge Influence Area Actual Max Desirable Violation? v No 12A Level of Service Determination (if not F) Density, D = v v L = 31.6 pc/mi/ln R R 12 A Level of service for ramp-freeway junction areas of influence D Speed Estimation Intermediate speed variable, M = S Space mean speed in ramp influence area, S = 54.1 mph R Space mean speed in outer lanes, S = 59.0 mph 0 Space mean speed for all vehicles, S = 55.7 mph
371 HCS 2010: Basic Freeway Segments Release 6.70 Phone: Fax: Operational Analysis Analyst: Makinzie Clark Agency or Company: Omni-Means Date Performed: 6/14/16 Analysis Time Period: AM Peak Hour Freeway/Direction: I-80 Westbound From/To: Sierra College Blvd/Rocklin Rd Jurisdiction: Caltrans Analysis Year: Cumulative Description: Sierra Gateway Apartments TIS Flow Inputs and Adjustments Volume, V 5420 veh/h Peak-hour factor, PHF 0.92 Peak 15-min volume, v v Trucks and buses 9 % Recreational vehicles 0 % Terrain type: Level Grade - % Segment length - mi Trucks and buses PCE, ET 1.5 Recreational vehicle PCE, ER 1.2 Heavy vehicle adjustment, fhv Driver population factor, fp 1.00 Flow rate, vp 2052 pc/h/ln Speed Inputs and Adjustments Lane width - ft Right-side lateral clearance - ft Total ramp density, TRD - ramps/mi Number of lanes, N 3 Free-flow speed: Measured FFS or BFFS 65.0 mi/h Lane width adjustment, flw - mi/h Lateral clearance adjustment, flc - mi/h TRD adjustment - mi/h Free-flow speed, FFS 65.0 mi/h LOS and Performance Measures Flow rate, vp 2052 pc/h/ln Free-flow speed, FFS 65.0 mi/h Average passenger-car speed, S 59.0 mi/h Number of lanes, N 3 Density, D 34.8 pc/mi/ln Level of service, LOS D
372 HCS 2010: Basic Freeway Segments Release 6.70 Phone: Fax: Operational Analysis Analyst: Makinzie Clark Agency or Company: Omni-Means Date Performed: 6/14/16 Analysis Time Period: PM Peak Hour Freeway/Direction: I-80 Eastbound From/To: South of Rocklin Road Jurisdiction: Caltrans Analysis Year: Cumulative Description: Sierra Gateway Apartments TIS Flow Inputs and Adjustments Volume, V 6033 veh/h Peak-hour factor, PHF 0.92 Peak 15-min volume, v v Trucks and buses 9 % Recreational vehicles 0 % Terrain type: Level Grade - % Segment length - mi Trucks and buses PCE, ET 1.5 Recreational vehicle PCE, ER 1.2 Heavy vehicle adjustment, fhv Driver population factor, fp 1.00 Flow rate, vp 2284 pc/h/ln Speed Inputs and Adjustments Lane width - ft Right-side lateral clearance - ft Total ramp density, TRD - ramps/mi Number of lanes, N 3 Free-flow speed: Measured FFS or BFFS 65.0 mi/h Lane width adjustment, flw - mi/h Lateral clearance adjustment, flc - mi/h TRD adjustment - mi/h Free-flow speed, FFS 65.0 mi/h LOS and Performance Measures Flow rate, vp 2284 pc/h/ln Free-flow speed, FFS 65.0 mi/h Average passenger-car speed, S 53.9 mi/h Number of lanes, N 3 Density, D 42.4 pc/mi/ln Level of service, LOS E
373 HCS 2010: Freeway Merge and Diverge Segments Release 6.70 Phone: Fax: Diverge Analysis Analyst: Makinzie Clark Agency/Co.: Omni-Means Date performed: 6/14/16 Analysis time period: PM Peak Hour Freeway/Dir of Travel: I-80 Eastbound Junction: Rocklin Road Off Ramp Jurisdiction: Caltrans Analysis Year: Cumulative Description: Sierra Gateway Apartments TIS Freeway Data Type of analysis Diverge Number of lanes in freeway 3 Free-flow speed on freeway 65.0 mph Volume on freeway 6033 vph Off Ramp Data Side of freeway Right Number of lanes in ramp 1 Free-Flow speed on ramp 35.0 mph Volume on ramp 1195 vph Length of first accel/decel lane 1050 ft Length of second accel/decel lane ft Adjacent Ramp Data (if one exists) Does adjacent ramp exist? Volume on adjacent ramp Position of adjacent ramp Type of adjacent ramp Distance to adjacent ramp No vph ft Conversion to pc/h Under Base Conditions Junction Components Freeway Ramp Adjacent Ramp Volume, V (vph) vph Peak-hour factor, PHF Peak 15-min volume, v v Trucks and buses 9 2 % Recreational vehicles 0 0 % Terrain type: Level Level Grade 0.00 % 0.00 % % Length 0.00 mi 0.00 mi mi Trucks and buses PCE, ET Recreational vehicle PCE, ER
374 Heavy vehicle adjustment, fhv Driver population factor, fp Flow rate, vp pcph Estimation of V12 Diverge Areas L = (Equation or 13-13) EQ P = Using Equation 9 FD v = v + (v - v ) P = 4228 pc/h 12 R F R FD Capacity Checks Actual Maximum LOS F? v = v No Fi F v = v - v No FO F R v No R v or v 2625 pc/h (Equation or 13-17) Is v or v > 2700 pc/h? No Is v or v > 1.5 v /2 No 12 If yes, v = 4228 (Equation 13-15, 13-16, 13-18, or 13-19) 12A Flow Entering Diverge Influence Area Actual Max Desirable Violation? v No 12 Level of Service Determination (if not F) Density, D = v L = 31.2 pc/mi/ln R 12 D Level of service for ramp-freeway junction areas of influence D Speed Estimation Intermediate speed variable, D = S Space mean speed in ramp influence area, S = 52.6 mph R Space mean speed in outer lanes, S = 65.0 mph 0 Space mean speed for all vehicles, S = 56.7 mph
375 HCS 2010: Freeway Merge and Diverge Segments Release 6.70 Phone: Fax: Merge Analysis Analyst: Makinzie Clark Agency/Co.: Omni-Means Date performed: 6/14/16 Analysis time period: PM Peak Hour Freeway/Dir of Travel: I-80 Eastbound Junction: Rocklin Road On Ramp Jurisdiction: Caltrans Analysis Year: Cumulative Description: Sierra Gateway Apartments TIS Freeway Data Type of analysis Merge Number of lanes in freeway 3 Free-flow speed on freeway 65.0 mph Volume on freeway 4838 vph On Ramp Data Side of freeway Right Number of lanes in ramp 1 Free-flow speed on ramp 35.0 mph Volume on ramp 640 vph Length of first accel/decel lane 360 ft Length of second accel/decel lane ft Adjacent Ramp Data (if one exists) Does adjacent ramp exist? Volume on adjacent Ramp Position of adjacent Ramp Type of adjacent Ramp Distance to adjacent Ramp No vph ft Conversion to pc/h Under Base Conditions Junction Components Freeway Ramp Adjacent Ramp Volume, V (vph) vph Peak-hour factor, PHF Peak 15-min volume, v v Trucks and buses 9 2 % Recreational vehicles 0 0 % Terrain type: Level Level Grade % % % Length mi mi mi Trucks and buses PCE, ET Recreational vehicle PCE, ER
376 Heavy vehicle adjustment, fhv Driver population factor, fp Flow rate, vp pcph Estimation of V12 Merge Areas L = (Equation 13-6 or 13-7) EQ P = Using Equation 3 FM v = v (P ) = 3229 pc/h 12 F FM Capacity Checks Actual Maximum LOS F? v No FO v or v 2266 pc/h (Equation or 13-17) Is v or v > 2700 pc/h? No Is v or v > 1.5 v /2 Yes 12 If yes, v = 3229 (Equation 13-15, 13-16, 13-18, or 13-19) 12A Flow Entering Merge Influence Area Actual Max Desirable Violation? v No 12A Level of Service Determination (if not F) Density, D = v v L = 33.3 pc/mi/ln R R 12 A Level of service for ramp-freeway junction areas of influence D Speed Estimation Intermediate speed variable, M = S Space mean speed in ramp influence area, S = 53.8 mph R Space mean speed in outer lanes, S = 58.6 mph 0 Space mean speed for all vehicles, S = 55.5 mph
377 HCS 2010: Freeway Merge and Diverge Segments Release 6.70 Phone: Fax: Diverge Analysis Analyst: Makinzie Clark Agency/Co.: Omni-Means Date performed: 6/14/16 Analysis time period: PM Peak Hour Freeway/Dir of Travel: I-80 Westbound Junction: Rocklin Road Off Ramp Jurisdiction: Caltrans Analysis Year: Cumulative Description: Sierra Gateway Apartments TIS Freeway Data Type of analysis Diverge Number of lanes in freeway 3 Free-flow speed on freeway 65.0 mph Volume on freeway 4844 vph Off Ramp Data Side of freeway Right Number of lanes in ramp 1 Free-Flow speed on ramp 35.0 mph Volume on ramp 535 vph Length of first accel/decel lane 150 ft Length of second accel/decel lane ft Adjacent Ramp Data (if one exists) Does adjacent ramp exist? Volume on adjacent ramp Position of adjacent ramp Type of adjacent ramp Distance to adjacent ramp No vph ft Conversion to pc/h Under Base Conditions Junction Components Freeway Ramp Adjacent Ramp Volume, V (vph) vph Peak-hour factor, PHF Peak 15-min volume, v v Trucks and buses 9 2 % Recreational vehicles 0 0 % Terrain type: Level Level Grade 0.00 % 0.00 % % Length 0.00 mi 0.00 mi mi Trucks and buses PCE, ET Recreational vehicle PCE, ER
378 Heavy vehicle adjustment, fhv Driver population factor, fp Flow rate, vp pcph Estimation of V12 Diverge Areas L = (Equation or 13-13) EQ P = Using Equation 9 FD v = v + (v - v ) P = 3506 pc/h 12 R F R FD Capacity Checks Actual Maximum LOS F? v = v No Fi F v = v - v No FO F R v No R v or v 1996 pc/h (Equation or 13-17) Is v or v > 2700 pc/h? No Is v or v > 1.5 v /2 No 12 If yes, v = 3506 (Equation 13-15, 13-16, 13-18, or 13-19) 12A Flow Entering Diverge Influence Area Actual Max Desirable Violation? v No 12 Level of Service Determination (if not F) Density, D = v L = 33.1 pc/mi/ln R 12 D Level of service for ramp-freeway junction areas of influence D Speed Estimation Intermediate speed variable, D = S Space mean speed in ramp influence area, S = 54.0 mph R Space mean speed in outer lanes, S = 67.4 mph 0 Space mean speed for all vehicles, S = 58.2 mph
379 HCS 2010: Freeway Merge and Diverge Segments Release 6.70 Phone: Fax: Merge Analysis Analyst: Makinzie Clark Agency/Co.: Omni-Means Date performed: 6/14/16 Analysis time period: PM Peak Hour Freeway/Dir of Travel: I-80 Westbound Junction: Rocklin Road On Ramp Jurisdiction: Caltrans Analysis Year: Cumulative Description: Sierra Gateway Apartments TIS Freeway Data Type of analysis Merge Number of lanes in freeway 3 Free-flow speed on freeway 65.0 mph Volume on freeway 4309 vph On Ramp Data Side of freeway Right Number of lanes in ramp 1 Free-flow speed on ramp 35.0 mph Volume on ramp 1375 vph Length of first accel/decel lane 760 ft Length of second accel/decel lane ft Adjacent Ramp Data (if one exists) Does adjacent ramp exist? Volume on adjacent Ramp Position of adjacent Ramp Type of adjacent Ramp Distance to adjacent Ramp No vph ft Conversion to pc/h Under Base Conditions Junction Components Freeway Ramp Adjacent Ramp Volume, V (vph) vph Peak-hour factor, PHF Peak 15-min volume, v v Trucks and buses 9 2 % Recreational vehicles 0 0 % Terrain type: Level Level Grade % % % Length mi mi mi Trucks and buses PCE, ET Recreational vehicle PCE, ER
380 Heavy vehicle adjustment, fhv Driver population factor, fp Flow rate, vp pcph Estimation of V12 Merge Areas L = (Equation 13-6 or 13-7) EQ P = Using Equation 3 FM v = v (P ) = 2930 pc/h 12 F FM Capacity Checks Actual Maximum LOS F? v No FO v or v 1964 pc/h (Equation or 13-17) Is v or v > 2700 pc/h? No Is v or v > 1.5 v /2 Yes 12 If yes, v = 2930 (Equation 13-15, 13-16, 13-18, or 13-19) 12A Flow Entering Merge Influence Area Actual Max Desirable Violation? v No 12A Level of Service Determination (if not F) Density, D = v v L = 33.9 pc/mi/ln R R 12 A Level of service for ramp-freeway junction areas of influence D Speed Estimation Intermediate speed variable, M = S Space mean speed in ramp influence area, S = 52.0 mph R Space mean speed in outer lanes, S = 59.7 mph 0 Space mean speed for all vehicles, S = 54.2 mph
381 HCS 2010: Basic Freeway Segments Release 6.70 Phone: Fax: Operational Analysis Analyst: Makinzie Clark Agency or Company: Omni-Means Date Performed: 6/14/16 Analysis Time Period: PM Peak Hour Freeway/Direction: I-80 Westbound From/To: South of Rocklin Road Jurisdiction: Caltrans Analysis Year: Cumulative Description: Sierra Gateway Apartments TIS Flow Inputs and Adjustments Volume, V 5684 veh/h Peak-hour factor, PHF 0.92 Peak 15-min volume, v v Trucks and buses 9 % Recreational vehicles 0 % Terrain type: Level Grade - % Segment length - mi Trucks and buses PCE, ET 1.5 Recreational vehicle PCE, ER 1.2 Heavy vehicle adjustment, fhv Driver population factor, fp 1.00 Flow rate, vp 2152 pc/h/ln Speed Inputs and Adjustments Lane width - ft Right-side lateral clearance - ft Total ramp density, TRD - ramps/mi Number of lanes, N 3 Free-flow speed: Measured FFS or BFFS 65.0 mi/h Lane width adjustment, flw - mi/h Lateral clearance adjustment, flc - mi/h TRD adjustment - mi/h Free-flow speed, FFS 65.0 mi/h LOS and Performance Measures Flow rate, vp 2152 pc/h/ln Free-flow speed, FFS 65.0 mi/h Average passenger-car speed, S 57.0 mi/h Number of lanes, N 3 Density, D 37.8 pc/mi/ln Level of service, LOS E
382 HCS 2010: Basic Freeway Segments Release 6.70 Phone: Fax: Operational Analysis Analyst: Makinzie Clark Agency or Company: Omni-Means Date Performed: 6/14/16 Analysis Time Period: PM Peak Hour Freeway/Direction: I-80 Eastbound From/To: Rocklin Rd/Sierra College Blvd Jurisdiction: Caltrans Analysis Year: Cumulative Description: Sierra Gateway Apartments TIS Flow Inputs and Adjustments Volume, V 5478 veh/h Peak-hour factor, PHF 0.92 Peak 15-min volume, v v Trucks and buses 9 % Recreational vehicles 0 % Terrain type: Level Grade - % Segment length - mi Trucks and buses PCE, ET 1.5 Recreational vehicle PCE, ER 1.2 Heavy vehicle adjustment, fhv Driver population factor, fp 1.00 Flow rate, vp 2074 pc/h/ln Speed Inputs and Adjustments Lane width - ft Right-side lateral clearance - ft Total ramp density, TRD - ramps/mi Number of lanes, N 3 Free-flow speed: Measured FFS or BFFS 65.0 mi/h Lane width adjustment, flw - mi/h Lateral clearance adjustment, flc - mi/h TRD adjustment - mi/h Free-flow speed, FFS 65.0 mi/h LOS and Performance Measures Flow rate, vp 2074 pc/h/ln Free-flow speed, FFS 65.0 mi/h Average passenger-car speed, S 58.6 mi/h Number of lanes, N 3 Density, D 35.4 pc/mi/ln Level of service, LOS E
383 HCS 2010: Freeway Merge and Diverge Segments Release 6.70 Phone: Fax: Diverge Analysis Analyst: Makinzie Clark Agency/Co.: Omni-Means Date performed: 6/14/15 Analysis time period: PM Peak Hour Freeway/Dir of Travel: I-80 Eastound Junction: Sierra College Blvd Off Ramp Jurisdiction: Caltrans Analysis Year: Cumulative Description: Sierra Gateway Apartments TIS Freeway Data Type of analysis Diverge Number of lanes in freeway 3 Free-flow speed on freeway 65.0 mph Volume on freeway 5478 vph Off Ramp Data Side of freeway Right Number of lanes in ramp 1 Free-Flow speed on ramp 35.0 mph Volume on ramp 780 vph Length of first accel/decel lane 150 ft Length of second accel/decel lane ft Adjacent Ramp Data (if one exists) Does adjacent ramp exist? Yes Volume on adjacent ramp 350 vph Position of adjacent ramp Downstream Type of adjacent ramp On Distance to adjacent ramp 1560 ft Conversion to pc/h Under Base Conditions Junction Components Freeway Ramp Adjacent Ramp Volume, V (vph) vph Peak-hour factor, PHF Peak 15-min volume, v v Trucks and buses % Recreational vehicles % Terrain type: Level Level Level Grade 0.00 % 0.00 % 0.00 % Length 0.00 mi 0.00 mi 0.00 mi Trucks and buses PCE, ET Recreational vehicle PCE, ER
384 Heavy vehicle adjustment, fhv Driver population factor, fp Flow rate, vp pcph Estimation of V12 Diverge Areas L = (Equation or 13-13) EQ P = Using Equation 9 FD v = v + (v - v ) P = 3883 pc/h 12 R F R FD Capacity Checks Actual Maximum LOS F? v = v No Fi F v = v - v No FO F R v No R v or v 2339 pc/h (Equation or 13-17) Is v or v > 2700 pc/h? No Is v or v > 1.5 v /2 No 12 If yes, v = 3883 (Equation 13-15, 13-16, 13-18, or 13-19) 12A Flow Entering Diverge Influence Area Actual Max Desirable Violation? v No 12 Level of Service Determination (if not F) Density, D = v L = 36.3 pc/mi/ln R 12 D Level of service for ramp-freeway junction areas of influence E Speed Estimation Intermediate speed variable, D = S Space mean speed in ramp influence area, S = 53.4 mph R Space mean speed in outer lanes, S = 66.1 mph 0 Space mean speed for all vehicles, S = 57.6 mph
385 HCS 2010: Freeway Merge and Diverge Segments Release 6.70 Phone: Fax: Merge Analysis Analyst: Makinzie Clark Agency/Co.: Omni-Means Date performed: 6/14/16 Analysis time period: PM Peak Hour Freeway/Dir of Travel: I-80 Eastbound Junction: Sierra College Blvd On Loop Jurisdiction: Caltrans Analysis Year: Cumulative Description: Sierra Gateway Apartments TIS Freeway Data Type of analysis Merge Number of lanes in freeway 3 Free-flow speed on freeway 65.0 mph Volume on freeway 4698 vph On Ramp Data Side of freeway Right Number of lanes in ramp 1 Free-flow speed on ramp 25.0 mph Volume on ramp 350 vph Length of first accel/decel lane 800 ft Length of second accel/decel lane ft Adjacent Ramp Data (if one exists) Does adjacent ramp exist? Yes Volume on adjacent Ramp 875 vph Position of adjacent Ramp Downstream Type of adjacent Ramp On Distance to adjacent Ramp 1420 ft Conversion to pc/h Under Base Conditions Junction Components Freeway Ramp Adjacent Ramp Volume, V (vph) vph Peak-hour factor, PHF Peak 15-min volume, v v Trucks and buses % Recreational vehicles % Terrain type: Level Level Level Grade % % % Length mi mi mi Trucks and buses PCE, ET Recreational vehicle PCE, ER
386 Heavy vehicle adjustment, fhv Driver population factor, fp Flow rate, vp pcph Estimation of V12 Merge Areas L = (Equation 13-6 or 13-7) EQ P = Using Equation 3 FM v = v (P ) = 3201 pc/h 12 F FM Capacity Checks Actual Maximum LOS F? v No FO v or v 2135 pc/h (Equation or 13-17) Is v or v > 2700 pc/h? No Is v or v > 1.5 v /2 Yes 12 If yes, v = 3201 (Equation 13-15, 13-16, 13-18, or 13-19) 12A Flow Entering Merge Influence Area Actual Max Desirable Violation? v No 12A Level of Service Determination (if not F) Density, D = v v L = 28.2 pc/mi/ln R R 12 A Level of service for ramp-freeway junction areas of influence D Speed Estimation Intermediate speed variable, M = S Space mean speed in ramp influence area, S = 55.3 mph R Space mean speed in outer lanes, S = 59.1 mph 0 Space mean speed for all vehicles, S = 56.7 mph
387 HCS 2010: Freeway Merge and Diverge Segments Release 6.70 Phone: Fax: Merge Analysis Analyst: Makinzie Clark Agency/Co.: Omni-Means Date performed: 6/14/16 Analysis time period: PM Peak Hour Freeway/Dir of Travel: I-80 Eastbound Junction: Sierra College Blvd On Ramp Jurisdiction: Caltrans Analysis Year: Cumulative Description: Sierra Gateway Apartments TIS Freeway Data Type of analysis Merge Number of lanes in freeway 3 Free-flow speed on freeway 65.0 mph Volume on freeway 5048 vph On Ramp Data Side of freeway Right Number of lanes in ramp 1 Free-flow speed on ramp 35.0 mph Volume on ramp 875 vph Length of first accel/decel lane 700 ft Length of second accel/decel lane ft Adjacent Ramp Data (if one exists) Does adjacent ramp exist? Yes Volume on adjacent Ramp 350 vph Position of adjacent Ramp Upstream Type of adjacent Ramp On Distance to adjacent Ramp 1420 ft Conversion to pc/h Under Base Conditions Junction Components Freeway Ramp Adjacent Ramp Volume, V (vph) vph Peak-hour factor, PHF Peak 15-min volume, v v Trucks and buses % Recreational vehicles % Terrain type: Level Level Level Grade % % % Length mi mi mi Trucks and buses PCE, ET Recreational vehicle PCE, ER
388 Heavy vehicle adjustment, fhv Driver population factor, fp Flow rate, vp pcph Estimation of V12 Merge Areas L = (Equation 13-6 or 13-7) EQ P = Using Equation 3 FM v = v (P ) = 3424 pc/h 12 F FM Capacity Checks Actual Maximum LOS F? v No FO v or v 2310 pc/h (Equation or 13-17) Is v or v > 2700 pc/h? No Is v or v > 1.5 v /2 Yes 12 If yes, v = 3424 (Equation 13-15, 13-16, 13-18, or 13-19) 12A Flow Entering Merge Influence Area Actual Max Desirable Violation? v No 12A Level of Service Determination (if not F) Density, D = v v L = 34.6 pc/mi/ln R R 12 A Level of service for ramp-freeway junction areas of influence D Speed Estimation Intermediate speed variable, M = S Space mean speed in ramp influence area, S = 51.8 mph R Space mean speed in outer lanes, S = 58.4 mph 0 Space mean speed for all vehicles, S = 53.9 mph
389 HCS 2010: Basic Freeway Segments Release 6.70 Phone: Fax: Operational Analysis Analyst: Makinzie Clark Agency or Company: Omni-Means Date Performed: 6/14/16 Analysis Time Period: PM Peak Hour Freeway/Direction: I-80 Eastbound From/To: North of Sierra College Blvd Jurisdiction: Caltrans Analysis Year: Cumulative Description: Sierra Gateway Apartments TIS Flow Inputs and Adjustments Volume, V 5923 veh/h Peak-hour factor, PHF 0.92 Peak 15-min volume, v v Trucks and buses 9 % Recreational vehicles 0 % Terrain type: Level Grade - % Segment length - mi Trucks and buses PCE, ET 1.5 Recreational vehicle PCE, ER 1.2 Heavy vehicle adjustment, fhv Driver population factor, fp 1.00 Flow rate, vp 2243 pc/h/ln Speed Inputs and Adjustments Lane width - ft Right-side lateral clearance - ft Total ramp density, TRD - ramps/mi Number of lanes, N 3 Free-flow speed: Measured FFS or BFFS 65.0 mi/h Lane width adjustment, flw - mi/h Lateral clearance adjustment, flc - mi/h TRD adjustment - mi/h Free-flow speed, FFS 65.0 mi/h LOS and Performance Measures Flow rate, vp 2243 pc/h/ln Free-flow speed, FFS 65.0 mi/h Average passenger-car speed, S 54.9 mi/h Number of lanes, N 3 Density, D 40.8 pc/mi/ln Level of service, LOS E
390 HCS 2010: Basic Freeway Segments Release 6.70 Phone: Fax: Operational Analysis Analyst: Makinzie Clark Agency or Company: Omni-Means Date Performed: 6/14/16 Analysis Time Period: PM Peak Hour Freeway/Direction: I-80 Westbound From/To: North of Sierra College Blvd Jurisdiction: Caltrans Analysis Year: Cumulative Description: Sierra Gateway Apartments TIS Flow Inputs and Adjustments Volume, V 4999 veh/h Peak-hour factor, PHF 0.92 Peak 15-min volume, v v Trucks and buses 9 % Recreational vehicles 0 % Terrain type: Level Grade - % Segment length - mi Trucks and buses PCE, ET 1.5 Recreational vehicle PCE, ER 1.2 Heavy vehicle adjustment, fhv Driver population factor, fp 1.00 Flow rate, vp 1893 pc/h/ln Speed Inputs and Adjustments Lane width - ft Right-side lateral clearance - ft Total ramp density, TRD - ramps/mi Number of lanes, N 3 Free-flow speed: Measured FFS or BFFS 65.0 mi/h Lane width adjustment, flw - mi/h Lateral clearance adjustment, flc - mi/h TRD adjustment - mi/h Free-flow speed, FFS 65.0 mi/h LOS and Performance Measures Flow rate, vp 1893 pc/h/ln Free-flow speed, FFS 65.0 mi/h Average passenger-car speed, S 61.6 mi/h Number of lanes, N 3 Density, D 30.8 pc/mi/ln Level of service, LOS D
391 HCS 2010: Freeway Merge and Diverge Segments Release 6.70 Phone: Fax: Diverge Analysis Analyst: Makinzie Clark Agency/Co.: Omni-Means Date performed: 6/14/16 Analysis time period: PM Peak Hour Freeway/Dir of Travel: I-80 Westbound Junction: Sierra College Blvd Off Ramp Jurisdiction: Caltrans Analysis Year: Cumulative Description: Sierra Gateway Apartments TIS Freeway Data Type of analysis Diverge Number of lanes in freeway 3 Free-flow speed on freeway 65.0 mph Volume on freeway 4999 vph Off Ramp Data Side of freeway Right Number of lanes in ramp 1 Free-Flow speed on ramp 35.0 mph Volume on ramp 970 vph Length of first accel/decel lane 650 ft Length of second accel/decel lane ft Adjacent Ramp Data (if one exists) Does adjacent ramp exist? Yes Volume on adjacent ramp 305 vph Position of adjacent ramp Downstream Type of adjacent ramp On Distance to adjacent ramp 1650 ft Conversion to pc/h Under Base Conditions Junction Components Freeway Ramp Adjacent Ramp Volume, V (vph) vph Peak-hour factor, PHF Peak 15-min volume, v v Trucks and buses % Recreational vehicles % Terrain type: Level Level Level Grade 0.00 % 0.00 % 0.00 % Length 0.00 mi 0.00 mi 0.00 mi Trucks and buses PCE, ET Recreational vehicle PCE, ER
392 Heavy vehicle adjustment, fhv Driver population factor, fp Flow rate, vp pcph Estimation of V12 Diverge Areas L = (Equation or 13-13) EQ P = Using Equation 9 FD v = v + (v - v ) P = 3685 pc/h 12 R F R FD Capacity Checks Actual Maximum LOS F? v = v No Fi F v = v - v No FO F R v No R v or v 1993 pc/h (Equation or 13-17) Is v or v > 2700 pc/h? No Is v or v > 1.5 v /2 No 12 If yes, v = 3685 (Equation 13-15, 13-16, 13-18, or 13-19) 12A Flow Entering Diverge Influence Area Actual Max Desirable Violation? v No 12 Level of Service Determination (if not F) Density, D = v L = 30.1 pc/mi/ln R 12 D Level of service for ramp-freeway junction areas of influence D Speed Estimation Intermediate speed variable, D = S Space mean speed in ramp influence area, S = 53.0 mph R Space mean speed in outer lanes, S = 67.4 mph 0 Space mean speed for all vehicles, S = 57.3 mph
393 HCS 2010: Freeway Merge and Diverge Segments Release 6.70 Phone: Fax: Merge Analysis Analyst: Makinzie Clark Agency/Co.: Omni-Means Date performed: 6/14/16 Analysis time period: PM Peak Hour Freeway/Dir of Travel: I-80 Westbound Junction: Sierra College Blvd On Loop Jurisdiction: Caltrans Analysis Year: Cumulative Description: Sierra Gateway Apartments TIS Freeway Data Type of analysis Merge Number of lanes in freeway 3 Free-flow speed on freeway 65.0 mph Volume on freeway 4029 vph On Ramp Data Side of freeway Right Number of lanes in ramp 1 Free-flow speed on ramp 25.0 mph Volume on ramp 305 vph Length of first accel/decel lane 700 ft Length of second accel/decel lane ft Adjacent Ramp Data (if one exists) Does adjacent ramp exist? Yes Volume on adjacent Ramp 510 vph Position of adjacent Ramp Downstream Type of adjacent Ramp On Distance to adjacent Ramp 1560 ft Conversion to pc/h Under Base Conditions Junction Components Freeway Ramp Adjacent Ramp Volume, V (vph) vph Peak-hour factor, PHF Peak 15-min volume, v v Trucks and buses % Recreational vehicles % Terrain type: Level Level Level Grade % % % Length mi mi mi Trucks and buses PCE, ET Recreational vehicle PCE, ER
394 Heavy vehicle adjustment, fhv Driver population factor, fp Flow rate, vp pcph Estimation of V12 Merge Areas L = (Equation 13-6 or 13-7) EQ P = Using Equation 3 FM v = v (P ) = 2732 pc/h 12 F FM Capacity Checks Actual Maximum LOS F? v No FO v or v 1844 pc/h (Equation or 13-17) Is v or v > 2700 pc/h? No Is v or v > 1.5 v /2 Yes 12 If yes, v = 2732 (Equation 13-15, 13-16, 13-18, or 13-19) 12A Flow Entering Merge Influence Area Actual Max Desirable Violation? v No 12A Level of Service Determination (if not F) Density, D = v v L = 24.8 pc/mi/ln R R 12 A Level of service for ramp-freeway junction areas of influence C Speed Estimation Intermediate speed variable, M = S Space mean speed in ramp influence area, S = 56.5 mph R Space mean speed in outer lanes, S = 60.2 mph 0 Space mean speed for all vehicles, S = 57.8 mph
395 HCS 2010: Freeway Merge and Diverge Segments Release 6.70 Phone: Fax: Merge Analysis Analyst: Makinzie Clark Agency/Co.: Omni-Means Date performed: 6/14/16 Analysis time period: PM Peak Hour Freeway/Dir of Travel: I-80 Westbound Junction: Sierra Collge Blvd On Ramp Jurisdiction: Caltrans Analysis Year: Cumulative Description: Sierra Gateway Apartments TIS Freeway Data Type of analysis Merge Number of lanes in freeway 3 Free-flow speed on freeway 65.0 mph Volume on freeway 4334 vph On Ramp Data Side of freeway Right Number of lanes in ramp 1 Free-flow speed on ramp 35.0 mph Volume on ramp 510 vph Length of first accel/decel lane 700 ft Length of second accel/decel lane ft Adjacent Ramp Data (if one exists) Does adjacent ramp exist? Yes Volume on adjacent Ramp 305 vph Position of adjacent Ramp Upstream Type of adjacent Ramp On Distance to adjacent Ramp 1560 ft Conversion to pc/h Under Base Conditions Junction Components Freeway Ramp Adjacent Ramp Volume, V (vph) vph Peak-hour factor, PHF Peak 15-min volume, v v Trucks and buses % Recreational vehicles % Terrain type: Level Level Level Grade % % % Length mi mi mi Trucks and buses PCE, ET Recreational vehicle PCE, ER
396 Heavy vehicle adjustment, fhv Driver population factor, fp Flow rate, vp pcph Estimation of V12 Merge Areas L = (Equation 13-6 or 13-7) EQ P = Using Equation 3 FM v = v (P ) = 2940 pc/h 12 F FM Capacity Checks Actual Maximum LOS F? v No FO v or v 1983 pc/h (Equation or 13-17) Is v or v > 2700 pc/h? No Is v or v > 1.5 v /2 Yes 12 If yes, v = 2940 (Equation 13-15, 13-16, 13-18, or 13-19) 12A Flow Entering Merge Influence Area Actual Max Desirable Violation? v No 12A Level of Service Determination (if not F) Density, D = v v L = pc/mi/ln R R 12 A Level of service for ramp-freeway junction areas of influence D Speed Estimation Intermediate speed variable, M = S Space mean speed in ramp influence area, S = 55.8 mph R Space mean speed in outer lanes, S = 59.7 mph 0 Space mean speed for all vehicles, S = 57.1 mph
397 HCS 2010: Basic Freeway Segments Release 6.70 Phone: Fax: Operational Analysis Analyst: Makinzie Clark Agency or Company: Omni-Means Date Performed: 6/14/16 Analysis Time Period: PM Peak Hour Freeway/Direction: I-80 Westbound From/To: Sierra College Blvd/Rocklin Rd Jurisdiction: Caltrans Analysis Year: Cumulative Description: Sierra Gateway Apartments TIS Flow Inputs and Adjustments Volume, V 4844 veh/h Peak-hour factor, PHF 0.92 Peak 15-min volume, v v Trucks and buses 9 % Recreational vehicles 0 % Terrain type: Level Grade - % Segment length - mi Trucks and buses PCE, ET 1.5 Recreational vehicle PCE, ER 1.2 Heavy vehicle adjustment, fhv Driver population factor, fp 1.00 Flow rate, vp 1834 pc/h/ln Speed Inputs and Adjustments Lane width - ft Right-side lateral clearance - ft Total ramp density, TRD - ramps/mi Number of lanes, N 3 Free-flow speed: Measured FFS or BFFS 65.0 mi/h Lane width adjustment, flw - mi/h Lateral clearance adjustment, flc - mi/h TRD adjustment - mi/h Free-flow speed, FFS 65.0 mi/h LOS and Performance Measures Flow rate, vp 1834 pc/h/ln Free-flow speed, FFS 65.0 mi/h Average passenger-car speed, S 62.3 mi/h Number of lanes, N 3 Density, D 29.4 pc/mi/ln Level of service, LOS D
398 HCS 2010: Basic Freeway Segments Release 6.70 Phone: Fax: Operational Analysis Analyst: Makinzie Clark Agency or Company: Omni-Means Date Performed: 6/14/16 Analysis Time Period: AM Peak Hour Freeway/Direction: I-80 Eastbound From/To: South of Rocklin Road Jurisdiction: Caltrans Analysis Year: Cumulative+Project Description: Sierra Gateway Apartments TIS Flow Inputs and Adjustments Volume, V 5439 veh/h Peak-hour factor, PHF 0.92 Peak 15-min volume, v v Trucks and buses 9 % Recreational vehicles 0 % Terrain type: Level Grade - % Segment length - mi Trucks and buses PCE, ET 1.5 Recreational vehicle PCE, ER 1.2 Heavy vehicle adjustment, fhv Driver population factor, fp 1.00 Flow rate, vp 2059 pc/h/ln Speed Inputs and Adjustments Lane width - ft Right-side lateral clearance - ft Total ramp density, TRD - ramps/mi Number of lanes, N 3 Free-flow speed: Measured FFS or BFFS 65.0 mi/h Lane width adjustment, flw - mi/h Lateral clearance adjustment, flc - mi/h TRD adjustment - mi/h Free-flow speed, FFS 65.0 mi/h LOS and Performance Measures Flow rate, vp 2059 pc/h/ln Free-flow speed, FFS 65.0 mi/h Average passenger-car speed, S 58.8 mi/h Number of lanes, N 3 Density, D pc/mi/ln Level of service, LOS D
399 HCS 2010: Freeway Merge and Diverge Segments Release 6.70 Phone: Fax: Diverge Analysis Analyst: Makinzie Clark Agency/Co.: Omni-Means Date performed: 6/14/16 Analysis time period: AM Peak Hour Freeway/Dir of Travel: I-80 Eastbound Junction: Rocklin Road Off Ramp Jurisdiction: Caltrans Analysis Year: Cumulative+Project Description: Sierra Gateway Apartments TIS Freeway Data Type of analysis Diverge Number of lanes in freeway 3 Free-flow speed on freeway 65.0 mph Volume on freeway 5439 vph Off Ramp Data Side of freeway Right Number of lanes in ramp 1 Free-Flow speed on ramp 35.0 mph Volume on ramp 1813 vph Length of first accel/decel lane 1050 ft Length of second accel/decel lane ft Adjacent Ramp Data (if one exists) Does adjacent ramp exist? Volume on adjacent ramp Position of adjacent ramp Type of adjacent ramp Distance to adjacent ramp No vph ft Conversion to pc/h Under Base Conditions Junction Components Freeway Ramp Adjacent Ramp Volume, V (vph) vph Peak-hour factor, PHF Peak 15-min volume, v v Trucks and buses 9 2 % Recreational vehicles 0 0 % Terrain type: Level Level Grade 0.00 % 0.00 % % Length 0.00 mi 0.00 mi mi Trucks and buses PCE, ET Recreational vehicle PCE, ER
400 Heavy vehicle adjustment, fhv Driver population factor, fp Flow rate, vp pcph Estimation of V12 Diverge Areas L = (Equation or 13-13) EQ P = Using Equation 9 FD v = v + (v - v ) P = 4130 pc/h 12 R F R FD Capacity Checks Actual Maximum LOS F? v = v No Fi F v = v - v No FO F R v No R v or v 2048 pc/h (Equation or 13-17) Is v or v > 2700 pc/h? No Is v or v > 1.5 v /2 No 12 If yes, v = 4130 (Equation 13-15, 13-16, 13-18, or 13-19) 12A Flow Entering Diverge Influence Area Actual Max Desirable Violation? v No 12 Level of Service Determination (if not F) Density, D = v L = 30.3 pc/mi/ln R 12 D Level of service for ramp-freeway junction areas of influence D Speed Estimation Intermediate speed variable, D = S Space mean speed in ramp influence area, S = 51.1 mph R Space mean speed in outer lanes, S = 67.2 mph 0 Space mean speed for all vehicles, S = 55.5 mph
401 HCS 2010: Freeway Merge and Diverge Segments Release 6.70 Phone: Fax: Merge Analysis Analyst: Makinzie Clark Agency/Co.: Omni-Means Date performed: 6/14/16 Analysis time period: AM Peak Hour Freeway/Dir of Travel: I-80 Eastbound Junction: Rocklin Road On Ramp Jurisdiction: Caltrans Analysis Year: Cumulative+Project Description: Sierra Gateway Apartments TIS Freeway Data Type of analysis Merge Number of lanes in freeway 3 Free-flow speed on freeway 65.0 mph Volume on freeway 3626 vph On Ramp Data Side of freeway Right Number of lanes in ramp 1 Free-flow speed on ramp 35.0 mph Volume on ramp 362 vph Length of first accel/decel lane 360 ft Length of second accel/decel lane ft Adjacent Ramp Data (if one exists) Does adjacent ramp exist? Volume on adjacent Ramp Position of adjacent Ramp Type of adjacent Ramp Distance to adjacent Ramp No vph ft Conversion to pc/h Under Base Conditions Junction Components Freeway Ramp Adjacent Ramp Volume, V (vph) vph Peak-hour factor, PHF Peak 15-min volume, v v Trucks and buses 9 2 % Recreational vehicles 0 0 % Terrain type: Level Level Grade % % % Length mi mi mi Trucks and buses PCE, ET Recreational vehicle PCE, ER
402 Heavy vehicle adjustment, fhv Driver population factor, fp Flow rate, vp pcph Estimation of V12 Merge Areas L = (Equation 13-6 or 13-7) EQ P = Using Equation 3 FM v = v (P ) = 2420 pc/h 12 F FM Capacity Checks Actual Maximum LOS F? v No FO v or v 1699 pc/h (Equation or 13-17) Is v or v > 2700 pc/h? No Is v or v > 1.5 v /2 Yes 12 If yes, v = 2420 (Equation 13-15, 13-16, 13-18, or 13-19) 12A Flow Entering Merge Influence Area Actual Max Desirable Violation? v No 12A Level of Service Determination (if not F) Density, D = v v L = 24.9 pc/mi/ln R R 12 A Level of service for ramp-freeway junction areas of influence C Speed Estimation Intermediate speed variable, M = S Space mean speed in ramp influence area, S = 56.7 mph R Space mean speed in outer lanes, S = 60.7 mph 0 Space mean speed for all vehicles, S = 58.1 mph
403 HCS 2010: Freeway Merge and Diverge Segments Release 6.70 Phone: Fax: Diverge Analysis Analyst: Makinzie Clark Agency/Co.: 6/14/16 Date performed: 9/17/2015 Analysis time period: AM Peak Hour Freeway/Dir of Travel: I-80 Westbound Junction: Rocklin Road Off Ramp Jurisdiction: Caltrans Analysis Year: Sierra Gateway Apartments TIS Description: Sierra College Facilities Master Plan TIAR Freeway Data Type of analysis Diverge Number of lanes in freeway 3 Free-flow speed on freeway 65.0 mph Volume on freeway 5419 vph Off Ramp Data Side of freeway Right Number of lanes in ramp 1 Free-Flow speed on ramp 35.0 mph Volume on ramp 636 vph Length of first accel/decel lane 150 ft Length of second accel/decel lane ft Adjacent Ramp Data (if one exists) Does adjacent ramp exist? Volume on adjacent ramp Position of adjacent ramp Type of adjacent ramp Distance to adjacent ramp No vph ft Conversion to pc/h Under Base Conditions Junction Components Freeway Ramp Adjacent Ramp Volume, V (vph) vph Peak-hour factor, PHF Peak 15-min volume, v v Trucks and buses 9 3 % Recreational vehicles 0 0 % Terrain type: Level Level Grade 0.00 % 0.00 % % Length 0.00 mi 0.00 mi mi Trucks and buses PCE, ET Recreational vehicle PCE, ER
404 Heavy vehicle adjustment, fhv Driver population factor, fp Flow rate, vp pcph Estimation of V12 Diverge Areas L = (Equation or 13-13) EQ P = Using Equation 9 FD v = v + (v - v ) P = 3828 pc/h 12 R F R FD Capacity Checks Actual Maximum LOS F? v = v No Fi F v = v - v No FO F R v No R v or v 2327 pc/h (Equation or 13-17) Is v or v > 2700 pc/h? No Is v or v > 1.5 v /2 No 12 If yes, v = 3828 (Equation 13-15, 13-16, 13-18, or 13-19) 12A Flow Entering Diverge Influence Area Actual Max Desirable Violation? v No 12 Level of Service Determination (if not F) Density, D = v L = 35.8 pc/mi/ln R 12 D Level of service for ramp-freeway junction areas of influence E Speed Estimation Intermediate speed variable, D = S Space mean speed in ramp influence area, S = 53.7 mph R Space mean speed in outer lanes, S = 66.1 mph 0 Space mean speed for all vehicles, S = 57.8 mph
405 HCS 2010: Freeway Merge and Diverge Segments Release 6.70 Phone: Fax: Merge Analysis Analyst: Makinzie Clark Agency/Co.: Omni-Means Date performed: 6/14/16 Analysis time period: AM Peak Hour Freeway/Dir of Travel: I-80 Westbound Junction: Rocklin Road On Ramp Jurisdiction: Caltrans Analysis Year: Cumulative+Project Description: Sierra Gateway Apartments TIS Freeway Data Type of analysis Merge Number of lanes in freeway 3 Free-flow speed on freeway 65.0 mph Volume on freeway 4783 vph On Ramp Data Side of freeway Right Number of lanes in ramp 1 Free-flow speed on ramp 35.0 mph Volume on ramp 982 vph Length of first accel/decel lane 750 ft Length of second accel/decel lane ft Adjacent Ramp Data (if one exists) Does adjacent ramp exist? Volume on adjacent Ramp Position of adjacent Ramp Type of adjacent Ramp Distance to adjacent Ramp No vph ft Conversion to pc/h Under Base Conditions Junction Components Freeway Ramp Adjacent Ramp Volume, V (vph) vph Peak-hour factor, PHF Peak 15-min volume, v v Trucks and buses 9 3 % Recreational vehicles 0 0 % Terrain type: Level Level Grade % % % Length mi mi mi Trucks and buses PCE, ET Recreational vehicle PCE, ER
406 Heavy vehicle adjustment, fhv Driver population factor, fp Flow rate, vp pcph Estimation of V12 Merge Areas L = (Equation 13-6 or 13-7) EQ P = Using Equation 3 FM v = v (P ) = 3252 pc/h 12 F FM Capacity Checks Actual Maximum LOS F? v No FO v or v 2181 pc/h (Equation or 13-17) Is v or v > 2700 pc/h? No Is v or v > 1.5 v /2 Yes 12 If yes, v = 3252 (Equation 13-15, 13-16, 13-18, or 13-19) 12A Flow Entering Merge Influence Area Actual Max Desirable Violation? v No 12A Level of Service Determination (if not F) Density, D = v v L = 33.9 pc/mi/ln R R 12 A Level of service for ramp-freeway junction areas of influence D Speed Estimation Intermediate speed variable, M = S Space mean speed in ramp influence area, S = 52.1 mph R Space mean speed in outer lanes, S = 58.9 mph 0 Space mean speed for all vehicles, S = 54.2 mph
407 HCS 2010: Basic Freeway Segments Release 6.70 Phone: Fax: Operational Analysis Analyst: Makinzie Clark Agency or Company: Omni-Means Date Performed: 6/14/16 Analysis Time Period: AM Peak Hour Freeway/Direction: I-80 Westbound From/To: South of Rocklin Road Jurisdiction: Caltrans Analysis Year: Cumulative+Project Description: Sierra Gateway Apartments TIS Flow Inputs and Adjustments Volume, V 5765 veh/h Peak-hour factor, PHF 0.92 Peak 15-min volume, v v Trucks and buses 9 % Recreational vehicles 0 % Terrain type: Level Grade - % Segment length - mi Trucks and buses PCE, ET 1.5 Recreational vehicle PCE, ER 1.2 Heavy vehicle adjustment, fhv Driver population factor, fp 1.00 Flow rate, vp 2183 pc/h/ln Speed Inputs and Adjustments Lane width - ft Right-side lateral clearance - ft Total ramp density, TRD - ramps/mi Number of lanes, N 3 Free-flow speed: Measured FFS or BFFS 65.0 mi/h Lane width adjustment, flw - mi/h Lateral clearance adjustment, flc - mi/h TRD adjustment - mi/h Free-flow speed, FFS 65.0 mi/h LOS and Performance Measures Flow rate, vp 2183 pc/h/ln Free-flow speed, FFS 65.0 mi/h Average passenger-car speed, S 56.3 mi/h Number of lanes, N 3 Density, D 38.8 pc/mi/ln Level of service, LOS E
408 HCS 2010: Basic Freeway Segments Release 6.70 Phone: Fax: Operational Analysis Analyst: Makinzie Clark Agency or Company: Omni-Means Date Performed: 6/14/16 Analysis Time Period: AM Peak Hour Freeway/Direction: I-80 Eastbound From/To: Rocklin Rd/Sierra College Blvd Jurisdiction: Caltrans Analysis Year: Cumulative+Project Description: Sierra Gateway Apartments TIS Flow Inputs and Adjustments Volume, V 3988 veh/h Peak-hour factor, PHF 0.92 Peak 15-min volume, v v Trucks and buses 9 % Recreational vehicles 0 % Terrain type: Level Grade - % Segment length - mi Trucks and buses PCE, ET 1.5 Recreational vehicle PCE, ER 1.2 Heavy vehicle adjustment, fhv Driver population factor, fp 1.00 Flow rate, vp 1510 pc/h/ln Speed Inputs and Adjustments Lane width - ft Right-side lateral clearance - ft Total ramp density, TRD - ramps/mi Number of lanes, N 3 Free-flow speed: Measured FFS or BFFS 65.0 mi/h Lane width adjustment, flw - mi/h Lateral clearance adjustment, flc - mi/h TRD adjustment - mi/h Free-flow speed, FFS 65.0 mi/h LOS and Performance Measures Flow rate, vp 1510 pc/h/ln Free-flow speed, FFS 65.0 mi/h Average passenger-car speed, S 64.8 mi/h Number of lanes, N 3 Density, D 23.3 pc/mi/ln Level of service, LOS C
409 HCS 2010: Freeway Merge and Diverge Segments Release 6.70 Phone: Fax: Diverge Analysis Analyst: Kenneth Isenhower III Agency/Co.: Omni-Means Date performed: 6/14/16 Analysis time period: AM Peak Hour Freeway/Dir of Travel: I-80 Eastound Junction: Sierra College Blvd Off Ramp Jurisdiction: Caltrans Analysis Year: Cumulative+Project Description: Sierra Gateway Apartments TIS Freeway Data Type of analysis Diverge Number of lanes in freeway 3 Free-flow speed on freeway 65.0 mph Volume on freeway 3988 vph Off Ramp Data Side of freeway Right Number of lanes in ramp 1 Free-Flow speed on ramp 35.0 mph Volume on ramp 1651 vph Length of first accel/decel lane 150 ft Length of second accel/decel lane ft Adjacent Ramp Data (if one exists) Does adjacent ramp exist? Yes Volume on adjacent ramp 195 vph Position of adjacent ramp Downstream Type of adjacent ramp On Distance to adjacent ramp 1560 ft Conversion to pc/h Under Base Conditions Junction Components Freeway Ramp Adjacent Ramp Volume, V (vph) vph Peak-hour factor, PHF Peak 15-min volume, v v Trucks and buses % Recreational vehicles % Terrain type: Level Level Level Grade 0.00 % 0.00 % 0.00 % Length 0.00 mi 0.00 mi 0.00 mi Trucks and buses PCE, ET Recreational vehicle PCE, ER
410 Heavy vehicle adjustment, fhv Driver population factor, fp Flow rate, vp pcph Estimation of V12 Diverge Areas L = (Equation or 13-13) EQ P = Using Equation 9 FD v = v + (v - v ) P = 3349 pc/h 12 R F R FD Capacity Checks Actual Maximum LOS F? v = v No Fi F v = v - v No FO F R v No R v or v 1181 pc/h (Equation or 13-17) Is v or v > 2700 pc/h? No Is v or v > 1.5 v /2 No 12 If yes, v = 3349 (Equation 13-15, 13-16, 13-18, or 13-19) 12A Flow Entering Diverge Influence Area Actual Max Desirable Violation? v No 12 Level of Service Determination (if not F) Density, D = v L = 31.7 pc/mi/ln R 12 D Level of service for ramp-freeway junction areas of influence D Speed Estimation Intermediate speed variable, D = S Space mean speed in ramp influence area, S = 51.4 mph R Space mean speed in outer lanes, S = 70.6 mph 0 Space mean speed for all vehicles, S = 55.3 mph
411 HCS 2010: Freeway Merge and Diverge Segments Release 6.70 Phone: Fax: Merge Analysis Analyst: Makinzie Clark Agency/Co.: Omni-Means Date performed: 6/14/16 Analysis time period: AM Peak Hour Freeway/Dir of Travel: I-80 Eastbound Junction: Sierra College Blvd On Loop Jurisdiction: Caltrans Analysis Year: Cumulative+Project Description: Sierra Gateway Apartments TIS Freeway Data Type of analysis Merge Number of lanes in freeway 3 Free-flow speed on freeway 65.0 mph Volume on freeway 2337 vph On Ramp Data Side of freeway Right Number of lanes in ramp 1 Free-flow speed on ramp 25.0 mph Volume on ramp 195 vph Length of first accel/decel lane 800 ft Length of second accel/decel lane ft Adjacent Ramp Data (if one exists) Does adjacent ramp exist? Yes Volume on adjacent Ramp 634 vph Position of adjacent Ramp Downstream Type of adjacent Ramp On Distance to adjacent Ramp 1420 ft Conversion to pc/h Under Base Conditions Junction Components Freeway Ramp Adjacent Ramp Volume, V (vph) vph Peak-hour factor, PHF Peak 15-min volume, v v Trucks and buses % Recreational vehicles % Terrain type: Level Level Level Grade % % % Length mi mi mi Trucks and buses PCE, ET Recreational vehicle PCE, ER
412 Heavy vehicle adjustment, fhv Driver population factor, fp Flow rate, vp pcph Estimation of V12 Merge Areas L = (Equation 13-6 or 13-7) EQ P = Using Equation 3 FM v = v (P ) = 1593 pc/h 12 F FM Capacity Checks Actual Maximum LOS F? v No FO v or v 1062 pc/h (Equation or 13-17) Is v or v > 2700 pc/h? No Is v or v > 1.5 v /2 Yes 12 If yes, v = 1593 (Equation 13-15, 13-16, 13-18, or 13-19) 12A Flow Entering Merge Influence Area Actual Max Desirable Violation? v No 12A Level of Service Determination (if not F) Density, D = v v L = 14.5 pc/mi/ln R R 12 A Level of service for ramp-freeway junction areas of influence B Speed Estimation Intermediate speed variable, M = S Space mean speed in ramp influence area, S = 58.0 mph R Space mean speed in outer lanes, S = 63.0 mph 0 Space mean speed for all vehicles, S = 59.7 mph
413 HCS 2010: Freeway Merge and Diverge Segments Release 6.70 Phone: Fax: Merge Analysis Analyst: Makinzie Clark Agency/Co.: Omni-Means Date performed: 6/14/16 Analysis time period: AM Peak Hour Freeway/Dir of Travel: I-80 Eastbound Junction: Sierra College Blvd On Ramp Jurisdiction: Caltrans Analysis Year: Cumulative+Project Description: Sierra Gateway Apartments TIS Freeway Data Type of analysis Merge Number of lanes in freeway 3 Free-flow speed on freeway 65.0 mph Volume on freeway 2532 vph On Ramp Data Side of freeway Right Number of lanes in ramp 1 Free-flow speed on ramp 35.0 mph Volume on ramp 634 vph Length of first accel/decel lane 700 ft Length of second accel/decel lane ft Adjacent Ramp Data (if one exists) Does adjacent ramp exist? Yes Volume on adjacent Ramp 195 vph Position of adjacent Ramp Upstream Type of adjacent Ramp On Distance to adjacent Ramp 1420 ft Conversion to pc/h Under Base Conditions Junction Components Freeway Ramp Adjacent Ramp Volume, V (vph) vph Peak-hour factor, PHF Peak 15-min volume, v v Trucks and buses % Recreational vehicles % Terrain type: Level Level Level Grade % % % Length mi mi mi Trucks and buses PCE, ET Recreational vehicle PCE, ER
414 Heavy vehicle adjustment, fhv Driver population factor, fp Flow rate, vp pcph Estimation of V12 Merge Areas L = (Equation 13-6 or 13-7) EQ P = Using Equation 3 FM v = v (P ) = 1717 pc/h 12 F FM Capacity Checks Actual Maximum LOS F? v No FO v or v 1159 pc/h (Equation or 13-17) Is v or v > 2700 pc/h? No Is v or v > 1.5 v /2 Yes 12 If yes, v = 1717 (Equation 13-15, 13-16, 13-18, or 13-19) 12A Flow Entering Merge Influence Area Actual Max Desirable Violation? v No 12A Level of Service Determination (if not F) Density, D = v v L = 19.6 pc/mi/ln R R 12 A Level of service for ramp-freeway junction areas of influence B Speed Estimation Intermediate speed variable, M = S Space mean speed in ramp influence area, S = 57.7 mph R Space mean speed in outer lanes, S = 62.6 mph 0 Space mean speed for all vehicles, S = 59.2 mph
415 HCS 2010: Basic Freeway Segments Release 6.70 Phone: Fax: Operational Analysis Analyst: Makinzie Clark Agency or Company: Omni-Means Date Performed: 6/14/16 Analysis Time Period: AM Peak Hour Freeway/Direction: I-80 Eastbound From/To: North of Sierra College Blvd Jurisdiction: Caltrans Analysis Year: Cumulative+Project Description: Sierra Gateway Apartments TIS Flow Inputs and Adjustments Volume, V 3166 veh/h Peak-hour factor, PHF 0.92 Peak 15-min volume, v v Trucks and buses 9 % Recreational vehicles 0 % Terrain type: Level Grade - % Segment length - mi Trucks and buses PCE, ET 1.5 Recreational vehicle PCE, ER 1.2 Heavy vehicle adjustment, fhv Driver population factor, fp 1.00 Flow rate, vp 1199 pc/h/ln Speed Inputs and Adjustments Lane width - ft Right-side lateral clearance - ft Total ramp density, TRD - ramps/mi Number of lanes, N 3 Free-flow speed: Measured FFS or BFFS 65.0 mi/h Lane width adjustment, flw - mi/h Lateral clearance adjustment, flc - mi/h TRD adjustment - mi/h Free-flow speed, FFS 65.0 mi/h LOS and Performance Measures Flow rate, vp 1199 pc/h/ln Free-flow speed, FFS 65.0 mi/h Average passenger-car speed, S 65.0 mi/h Number of lanes, N 3 Density, D 18.4 pc/mi/ln Level of service, LOS C
416 HCS 2010: Basic Freeway Segments Release 6.70 Phone: Fax: Operational Analysis Analyst: Makinzie Clark Agency or Company: Omni-Means Date Performed: 6/14/16 Analysis Time Period: AM Peak Hour Freeway/Direction: I-80 Westbound From/To: North of Sierra College Blvd Jurisdiction: Caltrans Analysis Year: Cumulative+Project Description: Sierra Gateway Apartments TIS Flow Inputs and Adjustments Volume, V 6070 veh/h Peak-hour factor, PHF 0.92 Peak 15-min volume, v v Trucks and buses 9 % Recreational vehicles 0 % Terrain type: Level Grade - % Segment length - mi Trucks and buses PCE, ET 1.5 Recreational vehicle PCE, ER 1.2 Heavy vehicle adjustment, fhv Driver population factor, fp 1.00 Flow rate, vp 2298 pc/h/ln Speed Inputs and Adjustments Lane width - ft Right-side lateral clearance - ft Total ramp density, TRD - ramps/mi Number of lanes, N 3 Free-flow speed: Measured FFS or BFFS 65.0 mi/h Lane width adjustment, flw - mi/h Lateral clearance adjustment, flc - mi/h TRD adjustment - mi/h Free-flow speed, FFS 65.0 mi/h LOS and Performance Measures Flow rate, vp 2298 pc/h/ln Free-flow speed, FFS 65.0 mi/h Average passenger-car speed, S 53.6 mi/h Number of lanes, N 3 Density, D 42.9 pc/mi/ln Level of service, LOS E
417 HCS 2010: Freeway Merge and Diverge Segments Release 6.70 Phone: Fax: Diverge Analysis Analyst: Makinzie Clark Agency/Co.: Omni-Means Date performed: 6/14/16 Analysis time period: AM Peak Hour Freeway/Dir of Travel: I-80 Westbound Junction: Sierra College Blvd Off Ramp Jurisdiction: Caltrans Analysis Year: Cumulative+Project Description: Sierra Gateway Apartments TIS Freeway Data Type of analysis Diverge Number of lanes in freeway 3 Free-flow speed on freeway 65.0 mph Volume on freeway 6070 vph Off Ramp Data Side of freeway Right Number of lanes in ramp 1 Free-Flow speed on ramp 35.0 mph Volume on ramp 1488 vph Length of first accel/decel lane 650 ft Length of second accel/decel lane ft Adjacent Ramp Data (if one exists) Does adjacent ramp exist? Yes Volume on adjacent ramp 152 vph Position of adjacent ramp Downstream Type of adjacent ramp On Distance to adjacent ramp 1650 ft Conversion to pc/h Under Base Conditions Junction Components Freeway Ramp Adjacent Ramp Volume, V (vph) vph Peak-hour factor, PHF Peak 15-min volume, v v Trucks and buses % Recreational vehicles % Terrain type: Level Level Level Grade 0.00 % 0.00 % 0.00 % Length 0.00 mi 0.00 mi 0.00 mi Trucks and buses PCE, ET Recreational vehicle PCE, ER
418 Heavy vehicle adjustment, fhv Driver population factor, fp Flow rate, vp pcph Estimation of V12 Diverge Areas L = (Equation or 13-13) EQ P = Using Equation 9 FD v = v + (v - v ) P = 4330 pc/h 12 R F R FD Capacity Checks Actual Maximum LOS F? v = v No Fi F v = v - v No FO F R v No R v or v 2565 pc/h (Equation or 13-17) Is v or v > 2700 pc/h? No Is v or v > 1.5 v /2 No 12 If yes, v = 4330 (Equation 13-15, 13-16, 13-18, or 13-19) 12A Flow Entering Diverge Influence Area Actual Max Desirable Violation? v No 12 Level of Service Determination (if not F) Density, D = v L = 35.6 pc/mi/ln R 12 D Level of service for ramp-freeway junction areas of influence E Speed Estimation Intermediate speed variable, D = S Space mean speed in ramp influence area, S = 51.8 mph R Space mean speed in outer lanes, S = 65.2 mph 0 Space mean speed for all vehicles, S = 56.1 mph
419 HCS 2010: Freeway Merge and Diverge Segments Release 6.70 Phone: Fax: Merge Analysis Analyst: Makinzie Clark Agency/Co.: Omni-Means Date performed: 6/14/16 Analysis time period: AM Peak Hour Freeway/Dir of Travel: I-80 Westbound Junction: Sierra College Blvd On Loop Jurisdiction: Caltrans Analysis Year: Cumulative+Project Description: Sierra Gateway Apartments TIS Freeway Data Type of analysis Merge Number of lanes in freeway 3 Free-flow speed on freeway 65.0 mph Volume on freeway 4582 vph On Ramp Data Side of freeway Right Number of lanes in ramp 1 Free-flow speed on ramp 25.0 mph Volume on ramp 152 vph Length of first accel/decel lane 700 ft Length of second accel/decel lane ft Adjacent Ramp Data (if one exists) Does adjacent ramp exist? Yes Volume on adjacent Ramp 685 vph Position of adjacent Ramp Downstream Type of adjacent Ramp On Distance to adjacent Ramp 1560 ft Conversion to pc/h Under Base Conditions Junction Components Freeway Ramp Adjacent Ramp Volume, V (vph) vph Peak-hour factor, PHF Peak 15-min volume, v v Trucks and buses % Recreational vehicles % Terrain type: Level Level Level Grade % % % Length mi mi mi Trucks and buses PCE, ET Recreational vehicle PCE, ER
420 Heavy vehicle adjustment, fhv Driver population factor, fp Flow rate, vp pcph Estimation of V12 Merge Areas L = (Equation 13-6 or 13-7) EQ P = Using Equation 3 FM v = v (P ) = 3108 pc/h 12 F FM Capacity Checks Actual Maximum LOS F? v No FO v or v 2097 pc/h (Equation or 13-17) Is v or v > 2700 pc/h? No Is v or v > 1.5 v /2 Yes 12 If yes, v = 3108 (Equation 13-15, 13-16, 13-18, or 13-19) 12A Flow Entering Merge Influence Area Actual Max Desirable Violation? v No 12A Level of Service Determination (if not F) Density, D = v v L = 26.6 pc/mi/ln R R 12 A Level of service for ramp-freeway junction areas of influence C Speed Estimation Intermediate speed variable, M = S Space mean speed in ramp influence area, S = 56.1 mph R Space mean speed in outer lanes, S = 59.3 mph 0 Space mean speed for all vehicles, S = 57.3 mph
421 HCS 2010: Freeway Merge and Diverge Segments Release 6.70 Phone: Fax: Merge Analysis Analyst: Makinzie Clark Agency/Co.: Omni-Means Date performed: 6/14/16 Analysis time period: AM Peak Hour Freeway/Dir of Travel: I-80 Westbound Junction: Sierra College Blvd On Ramp Jurisdiction: Caltrans Analysis Year: Cumulative+Project Description: Sierra Gateway Apartments TIS Freeway Data Type of analysis Merge Number of lanes in freeway 3 Free-flow speed on freeway 65.0 mph Volume on freeway 4734 vph On Ramp Data Side of freeway Right Number of lanes in ramp 1 Free-flow speed on ramp 35.0 mph Volume on ramp 685 vph Length of first accel/decel lane 700 ft Length of second accel/decel lane ft Adjacent Ramp Data (if one exists) Does adjacent ramp exist? Yes Volume on adjacent Ramp 152 vph Position of adjacent Ramp Upstream Type of adjacent Ramp On Distance to adjacent Ramp 1560 ft Conversion to pc/h Under Base Conditions Junction Components Freeway Ramp Adjacent Ramp Volume, V (vph) vph Peak-hour factor, PHF Peak 15-min volume, v v Trucks and buses % Recreational vehicles % Terrain type: Level Level Level Grade % % % Length mi mi mi Trucks and buses PCE, ET Recreational vehicle PCE, ER
422 Heavy vehicle adjustment, fhv Driver population factor, fp Flow rate, vp pcph Estimation of V12 Merge Areas L = (Equation 13-6 or 13-7) EQ P = Using Equation 3 FM v = v (P ) = 3211 pc/h 12 F FM Capacity Checks Actual Maximum LOS F? v No FO v or v 2166 pc/h (Equation or 13-17) Is v or v > 2700 pc/h? No Is v or v > 1.5 v /2 Yes 12 If yes, v = 3211 (Equation 13-15, 13-16, 13-18, or 13-19) 12A Flow Entering Merge Influence Area Actual Max Desirable Violation? v No 12A Level of Service Determination (if not F) Density, D = v v L = 31.6 pc/mi/ln R R 12 A Level of service for ramp-freeway junction areas of influence D Speed Estimation Intermediate speed variable, M = S Space mean speed in ramp influence area, S = 54.0 mph R Space mean speed in outer lanes, S = 59.0 mph 0 Space mean speed for all vehicles, S = 55.7 mph
423 HCS 2010: Basic Freeway Segments Release 6.70 Phone: Fax: Operational Analysis Analyst: Makinzie Clark Agency or Company: Omni-Means Date Performed: 6/14/16 Analysis Time Period: AM Peak Hour Freeway/Direction: I-80 Westbound From/To: Sierra College Blvd/Rocklin Rd Jurisdiction: Caltrans Analysis Year: Cumulative+Project Description: Sierra Gateway Apartments TIS Flow Inputs and Adjustments Volume, V 5419 veh/h Peak-hour factor, PHF 0.92 Peak 15-min volume, v v Trucks and buses 9 % Recreational vehicles 0 % Terrain type: Level Grade - % Segment length - mi Trucks and buses PCE, ET 1.5 Recreational vehicle PCE, ER 1.2 Heavy vehicle adjustment, fhv Driver population factor, fp 1.00 Flow rate, vp 2052 pc/h/ln Speed Inputs and Adjustments Lane width - ft Right-side lateral clearance - ft Total ramp density, TRD - ramps/mi Number of lanes, N 3 Free-flow speed: Measured FFS or BFFS 65.0 mi/h Lane width adjustment, flw - mi/h Lateral clearance adjustment, flc - mi/h TRD adjustment - mi/h Free-flow speed, FFS 65.0 mi/h LOS and Performance Measures Flow rate, vp 2052 pc/h/ln Free-flow speed, FFS 65.0 mi/h Average passenger-car speed, S 59.0 mi/h Number of lanes, N 3 Density, D 34.8 pc/mi/ln Level of service, LOS D
424 HCS 2010: Basic Freeway Segments Release 6.70 Phone: Fax: Operational Analysis Analyst: Makinzie Clark Agency or Company: Omni-Means Date Performed: 6/14/16 Analysis Time Period: PM Peak Hour Freeway/Direction: I-80 Eastbound From/To: South of Rocklin Road Jurisdiction: Caltrans Analysis Year: Cumulative+Project Description: Sierra Gateway Apartments TIS Flow Inputs and Adjustments Volume, V 5479 veh/h Peak-hour factor, PHF 0.92 Peak 15-min volume, v v Trucks and buses 9 % Recreational vehicles 0 % Terrain type: Level Grade - % Segment length - mi Trucks and buses PCE, ET 1.5 Recreational vehicle PCE, ER 1.2 Heavy vehicle adjustment, fhv Driver population factor, fp 1.00 Flow rate, vp 2074 pc/h/ln Speed Inputs and Adjustments Lane width - ft Right-side lateral clearance - ft Total ramp density, TRD - ramps/mi Number of lanes, N 3 Free-flow speed: Measured FFS or BFFS 65.0 mi/h Lane width adjustment, flw - mi/h Lateral clearance adjustment, flc - mi/h TRD adjustment - mi/h Free-flow speed, FFS 65.0 mi/h LOS and Performance Measures Flow rate, vp 2074 pc/h/ln Free-flow speed, FFS 65.0 mi/h Average passenger-car speed, S 58.6 mi/h Number of lanes, N 3 Density, D 35.4 pc/mi/ln Level of service, LOS E
425 HCS 2010: Freeway Merge and Diverge Segments Release 6.70 Phone: Fax: Diverge Analysis Analyst: Makinzie Clark Agency/Co.: Omni-Means Date performed: 6/14/16 Analysis time period: PM Peak Hour Freeway/Dir of Travel: I-80 Eastbound Junction: Rocklin Road Off Ramp Jurisdiction: Caltrans Analysis Year: Cumulative+Project Description: Sierra Gateway Apartments TIS Freeway Data Type of analysis Diverge Number of lanes in freeway 3 Free-flow speed on freeway 65.0 mph Volume on freeway 5479 vph Off Ramp Data Side of freeway Right Number of lanes in ramp 1 Free-Flow speed on ramp 35.0 mph Volume on ramp 646 vph Length of first accel/decel lane 1050 ft Length of second accel/decel lane ft Adjacent Ramp Data (if one exists) Does adjacent ramp exist? Volume on adjacent ramp Position of adjacent ramp Type of adjacent ramp Distance to adjacent ramp No vph ft Conversion to pc/h Under Base Conditions Junction Components Freeway Ramp Adjacent Ramp Volume, V (vph) vph Peak-hour factor, PHF Peak 15-min volume, v v Trucks and buses 9 2 % Recreational vehicles 0 0 % Terrain type: Level Level Grade 0.00 % 0.00 % % Length 0.00 mi 0.00 mi mi Trucks and buses PCE, ET Recreational vehicle PCE, ER
426 Heavy vehicle adjustment, fhv Driver population factor, fp Flow rate, vp pcph Estimation of V12 Diverge Areas L = (Equation or 13-13) EQ P = Using Equation 9 FD v = v + (v - v ) P = 3857 pc/h 12 R F R FD Capacity Checks Actual Maximum LOS F? v = v No Fi F v = v - v No FO F R v No R v or v 2366 pc/h (Equation or 13-17) Is v or v > 2700 pc/h? No Is v or v > 1.5 v /2 No 12 If yes, v = 3857 (Equation 13-15, 13-16, 13-18, or 13-19) 12A Flow Entering Diverge Influence Area Actual Max Desirable Violation? v No 12 Level of Service Determination (if not F) Density, D = v L = pc/mi/ln R 12 D Level of service for ramp-freeway junction areas of influence C Speed Estimation Intermediate speed variable, D = S Space mean speed in ramp influence area, S = 53.7 mph R Space mean speed in outer lanes, S = 66.0 mph 0 Space mean speed for all vehicles, S = 57.8 mph
427 HCS 2010: Freeway Merge and Diverge Segments Release 6.70 Phone: Fax: Merge Analysis Analyst: Makinzie Clark Agency/Co.: Omni-Means Date performed: 6/14/16 Analysis time period: PM Peak Hour Freeway/Dir of Travel: I-80 Eastbound Junction: Rocklin Road On Ramp Jurisdiction: Caltrans Analysis Year: Cumulative+Project Description: Sierra Gateway Apartments TIS Freeway Data Type of analysis Merge Number of lanes in freeway 3 Free-flow speed on freeway 65.0 mph Volume on freeway 4833 vph On Ramp Data Side of freeway Right Number of lanes in ramp 1 Free-flow speed on ramp 35.0 mph Volume on ramp 641 vph Length of first accel/decel lane 360 ft Length of second accel/decel lane ft Adjacent Ramp Data (if one exists) Does adjacent ramp exist? Volume on adjacent Ramp Position of adjacent Ramp Type of adjacent Ramp Distance to adjacent Ramp No vph ft Conversion to pc/h Under Base Conditions Junction Components Freeway Ramp Adjacent Ramp Volume, V (vph) vph Peak-hour factor, PHF Peak 15-min volume, v v Trucks and buses 9 2 % Recreational vehicles 0 0 % Terrain type: Level Level Grade % % % Length mi mi mi Trucks and buses PCE, ET Recreational vehicle PCE, ER
428 Heavy vehicle adjustment, fhv Driver population factor, fp Flow rate, vp pcph Estimation of V12 Merge Areas L = (Equation 13-6 or 13-7) EQ P = Using Equation 3 FM v = v (P ) = 3226 pc/h 12 F FM Capacity Checks Actual Maximum LOS F? v No FO v or v 2264 pc/h (Equation or 13-17) Is v or v > 2700 pc/h? No Is v or v > 1.5 v /2 Yes 12 If yes, v = 3226 (Equation 13-15, 13-16, 13-18, or 13-19) 12A Flow Entering Merge Influence Area Actual Max Desirable Violation? v No 12A Level of Service Determination (if not F) Density, D = v v L = 33.3 pc/mi/ln R R 12 A Level of service for ramp-freeway junction areas of influence D Speed Estimation Intermediate speed variable, M = S Space mean speed in ramp influence area, S = 53.8 mph R Space mean speed in outer lanes, S = 58.6 mph 0 Space mean speed for all vehicles, S = 55.5 mph
429 HCS 2010: Freeway Merge and Diverge Segments Release 6.70 Phone: Fax: Diverge Analysis Analyst: Makinzie Clark Agency/Co.: Omni-Means Date performed: 6/14/16 Analysis time period: PM Peak Hour Freeway/Dir of Travel: I-80 Westbound Junction: Rocklin Road Off Ramp Jurisdiction: Caltrans Analysis Year: Cumulative+Project Description: Sierra Gateway Apartments TIS Freeway Data Type of analysis Diverge Number of lanes in freeway 3 Free-flow speed on freeway 65.0 mph Volume on freeway 4834 vph Off Ramp Data Side of freeway Right Number of lanes in ramp 1 Free-Flow speed on ramp 35.0 mph Volume on ramp 537 vph Length of first accel/decel lane 150 ft Length of second accel/decel lane ft Adjacent Ramp Data (if one exists) Does adjacent ramp exist? Volume on adjacent ramp Position of adjacent ramp Type of adjacent ramp Distance to adjacent ramp No vph ft Conversion to pc/h Under Base Conditions Junction Components Freeway Ramp Adjacent Ramp Volume, V (vph) vph Peak-hour factor, PHF Peak 15-min volume, v v Trucks and buses 9 2 % Recreational vehicles 0 0 % Terrain type: Level Level Grade 0.00 % 0.00 % % Length 0.00 mi 0.00 mi mi Trucks and buses PCE, ET Recreational vehicle PCE, ER
430 Heavy vehicle adjustment, fhv Driver population factor, fp Flow rate, vp pcph Estimation of V12 Diverge Areas L = (Equation or 13-13) EQ P = Using Equation 9 FD v = v + (v - v ) P = 3502 pc/h 12 R F R FD Capacity Checks Actual Maximum LOS F? v = v No Fi F v = v - v No FO F R v No R v or v 1989 pc/h (Equation or 13-17) Is v or v > 2700 pc/h? No Is v or v > 1.5 v /2 No 12 If yes, v = 3502 (Equation 13-15, 13-16, 13-18, or 13-19) 12A Flow Entering Diverge Influence Area Actual Max Desirable Violation? v No 12 Level of Service Determination (if not F) Density, D = v L = 33.0 pc/mi/ln R 12 D Level of service for ramp-freeway junction areas of influence D Speed Estimation Intermediate speed variable, D = S Space mean speed in ramp influence area, S = 54.0 mph R Space mean speed in outer lanes, S = 67.4 mph 0 Space mean speed for all vehicles, S = 58.2 mph
431 HCS 2010: Freeway Merge and Diverge Segments Release 6.70 Phone: Fax: Merge Analysis Analyst: Makinzie Clark Agency/Co.: Omni-Means Date performed: 6/14/16 Analysis time period: PM Peak Hour Freeway/Dir of Travel: I-80 Westbound Junction: Rocklin Road On Ramp Jurisdiction: Caltrans Analysis Year: Cumulative+Project Description: Sierra Gateway Apartments TIS Freeway Data Type of analysis Merge Number of lanes in freeway 3 Free-flow speed on freeway 65.0 mph Volume on freeway 4297 vph On Ramp Data Side of freeway Right Number of lanes in ramp 1 Free-flow speed on ramp 35.0 mph Volume on ramp 1382 vph Length of first accel/decel lane 760 ft Length of second accel/decel lane ft Adjacent Ramp Data (if one exists) Does adjacent ramp exist? Volume on adjacent Ramp Position of adjacent Ramp Type of adjacent Ramp Distance to adjacent Ramp No vph ft Conversion to pc/h Under Base Conditions Junction Components Freeway Ramp Adjacent Ramp Volume, V (vph) vph Peak-hour factor, PHF Peak 15-min volume, v v Trucks and buses 9 2 % Recreational vehicles 0 0 % Terrain type: Level Level Grade % % % Length mi mi mi Trucks and buses PCE, ET Recreational vehicle PCE, ER
432 Heavy vehicle adjustment, fhv Driver population factor, fp Flow rate, vp pcph Estimation of V12 Merge Areas L = (Equation 13-6 or 13-7) EQ P = Using Equation 3 FM v = v (P ) = 2923 pc/h 12 F FM Capacity Checks Actual Maximum LOS F? v No FO v or v 1958 pc/h (Equation or 13-17) Is v or v > 2700 pc/h? No Is v or v > 1.5 v /2 Yes 12 If yes, v = 2923 (Equation 13-15, 13-16, 13-18, or 13-19) 12A Flow Entering Merge Influence Area Actual Max Desirable Violation? v No 12A Level of Service Determination (if not F) Density, D = v v L = 33.9 pc/mi/ln R R 12 A Level of service for ramp-freeway junction areas of influence D Speed Estimation Intermediate speed variable, M = S Space mean speed in ramp influence area, S = 52.0 mph R Space mean speed in outer lanes, S = 59.8 mph 0 Space mean speed for all vehicles, S = 54.2 mph
433 HCS 2010: Basic Freeway Segments Release 6.70 Phone: Fax: Operational Analysis Analyst: Makinzie Clark Agency or Company: Omni-Means Date Performed: 6/14/16 Analysis Time Period: PM Peak Hour Freeway/Direction: I-80 Westbound From/To: South of Rocklin Road Jurisdiction: Caltrans Analysis Year: Cumulative+Project Description: Sierra Gateway Apartments TIS Flow Inputs and Adjustments Volume, V 5679 veh/h Peak-hour factor, PHF 0.92 Peak 15-min volume, v v Trucks and buses 9 % Recreational vehicles 0 % Terrain type: Level Grade - % Segment length - mi Trucks and buses PCE, ET 1.5 Recreational vehicle PCE, ER 1.2 Heavy vehicle adjustment, fhv Driver population factor, fp 1.00 Flow rate, vp 2150 pc/h/ln Speed Inputs and Adjustments Lane width - ft Right-side lateral clearance - ft Total ramp density, TRD - ramps/mi Number of lanes, N 3 Free-flow speed: Measured FFS or BFFS 65.0 mi/h Lane width adjustment, flw - mi/h Lateral clearance adjustment, flc - mi/h TRD adjustment - mi/h Free-flow speed, FFS 65.0 mi/h LOS and Performance Measures Flow rate, vp 2150 pc/h/ln Free-flow speed, FFS 65.0 mi/h Average passenger-car speed, S 57.0 mi/h Number of lanes, N 3 Density, D 37.7 pc/mi/ln Level of service, LOS E
434 HCS 2010: Basic Freeway Segments Release 6.70 Phone: Fax: Operational Analysis Analyst: Makinzie Clark Agency or Company: Omni-Means Date Performed: 6/14/16 Analysis Time Period: PM Peak Hour Freeway/Direction: I-80 Eastbound From/To: Rocklin Rd/Sierra College Blvd Jurisdiction: Caltrans Analysis Year: Cumulative+Project Description: Sierra Gateway Apartments TIS Flow Inputs and Adjustments Volume, V 5474 veh/h Peak-hour factor, PHF 0.92 Peak 15-min volume, v v Trucks and buses 9 % Recreational vehicles 0 % Terrain type: Level Grade - % Segment length - mi Trucks and buses PCE, ET 1.5 Recreational vehicle PCE, ER 1.2 Heavy vehicle adjustment, fhv Driver population factor, fp 1.00 Flow rate, vp 2073 pc/h/ln Speed Inputs and Adjustments Lane width - ft Right-side lateral clearance - ft Total ramp density, TRD - ramps/mi Number of lanes, N 3 Free-flow speed: Measured FFS or BFFS 65.0 mi/h Lane width adjustment, flw - mi/h Lateral clearance adjustment, flc - mi/h TRD adjustment - mi/h Free-flow speed, FFS 65.0 mi/h LOS and Performance Measures Flow rate, vp 2073 pc/h/ln Free-flow speed, FFS 65.0 mi/h Average passenger-car speed, S 58.6 mi/h Number of lanes, N 3 Density, D 35.4 pc/mi/ln Level of service, LOS E
435 HCS 2010: Freeway Merge and Diverge Segments Release 6.70 Phone: Fax: Diverge Analysis Analyst: Makinzie Clark Agency/Co.: Omni-Means Date performed: 6/14/16 Analysis time period: PM Peak Hour Freeway/Dir of Travel: I-80 Eastound Junction: Sierra College Blvd Off Ramp Jurisdiction: Caltrans Analysis Year: Cumulative+Project Description: Sierra Gateway Apartments TIS Freeway Data Type of analysis Diverge Number of lanes in freeway 3 Free-flow speed on freeway 65.0 mph Volume on freeway 5474 vph Off Ramp Data Side of freeway Right Number of lanes in ramp 1 Free-Flow speed on ramp 35.0 mph Volume on ramp 782 vph Length of first accel/decel lane 150 ft Length of second accel/decel lane ft Adjacent Ramp Data (if one exists) Does adjacent ramp exist? Yes Volume on adjacent ramp 350 vph Position of adjacent ramp Downstream Type of adjacent ramp On Distance to adjacent ramp 1560 ft Conversion to pc/h Under Base Conditions Junction Components Freeway Ramp Adjacent Ramp Volume, V (vph) vph Peak-hour factor, PHF Peak 15-min volume, v v Trucks and buses % Recreational vehicles % Terrain type: Level Level Level Grade 0.00 % 0.00 % 0.00 % Length 0.00 mi 0.00 mi 0.00 mi Trucks and buses PCE, ET Recreational vehicle PCE, ER
436 Heavy vehicle adjustment, fhv Driver population factor, fp Flow rate, vp pcph Estimation of V12 Diverge Areas L = (Equation or 13-13) EQ P = Using Equation 9 FD v = v + (v - v ) P = 3882 pc/h 12 R F R FD Capacity Checks Actual Maximum LOS F? v = v No Fi F v = v - v No FO F R v No R v or v 2336 pc/h (Equation or 13-17) Is v or v > 2700 pc/h? No Is v or v > 1.5 v /2 No 12 If yes, v = 3882 (Equation 13-15, 13-16, 13-18, or 13-19) 12A Flow Entering Diverge Influence Area Actual Max Desirable Violation? v No 12 Level of Service Determination (if not F) Density, D = v L = 36.3 pc/mi/ln R 12 D Level of service for ramp-freeway junction areas of influence E Speed Estimation Intermediate speed variable, D = S Space mean speed in ramp influence area, S = 53.4 mph R Space mean speed in outer lanes, S = 66.1 mph 0 Space mean speed for all vehicles, S = 57.6 mph
437 HCS 2010: Freeway Merge and Diverge Segments Release 6.70 Phone: Fax: Merge Analysis Analyst: Makinzie Clark Agency/Co.: Omni-Means Date performed: 6/14/16 Analysis time period: PM Peak Hour Freeway/Dir of Travel: I-80 Eastbound Junction: Sierra College Blvd On Loop Jurisdiction: Caltrans Analysis Year: Cumulative+Project Description: Sierra Gateway Apartments TIS Freeway Data Type of analysis Merge Number of lanes in freeway 3 Free-flow speed on freeway 65.0 mph Volume on freeway 4692 vph On Ramp Data Side of freeway Right Number of lanes in ramp 1 Free-flow speed on ramp 25.0 mph Volume on ramp 350 vph Length of first accel/decel lane 800 ft Length of second accel/decel lane ft Adjacent Ramp Data (if one exists) Does adjacent ramp exist? Yes Volume on adjacent Ramp 881 vph Position of adjacent Ramp Downstream Type of adjacent Ramp On Distance to adjacent Ramp 1420 ft Conversion to pc/h Under Base Conditions Junction Components Freeway Ramp Adjacent Ramp Volume, V (vph) vph Peak-hour factor, PHF Peak 15-min volume, v v Trucks and buses % Recreational vehicles % Terrain type: Level Level Level Grade % % % Length mi mi mi Trucks and buses PCE, ET Recreational vehicle PCE, ER
438 Heavy vehicle adjustment, fhv Driver population factor, fp Flow rate, vp pcph Estimation of V12 Merge Areas L = (Equation 13-6 or 13-7) EQ P = Using Equation 3 FM v = v (P ) = 3197 pc/h 12 F FM Capacity Checks Actual Maximum LOS F? v No FO v or v 2132 pc/h (Equation or 13-17) Is v or v > 2700 pc/h? No Is v or v > 1.5 v /2 Yes 12 If yes, v = 3197 (Equation 13-15, 13-16, 13-18, or 13-19) 12A Flow Entering Merge Influence Area Actual Max Desirable Violation? v No 12A Level of Service Determination (if not F) Density, D = v v L = 28.1 pc/mi/ln R R 12 A Level of service for ramp-freeway junction areas of influence D Speed Estimation Intermediate speed variable, M = S Space mean speed in ramp influence area, S = 55.4 mph R Space mean speed in outer lanes, S = 59.1 mph 0 Space mean speed for all vehicles, S = 56.7 mph
439 HCS 2010: Freeway Merge and Diverge Segments Release 6.70 Phone: Fax: Merge Analysis Analyst: Makinzie Clark Agency/Co.: Omni-Means Date performed: 6/14/16 Analysis time period: PM Peak Hour Freeway/Dir of Travel: I-80 Eastbound Junction: Sierra College Blvd On Ramp Jurisdiction: Caltrans Analysis Year: Cumulative+Project Description: Sierra Gateway Apartments TIS Freeway Data Type of analysis Merge Number of lanes in freeway 3 Free-flow speed on freeway 65.0 mph Volume on freeway 5042 vph On Ramp Data Side of freeway Right Number of lanes in ramp 1 Free-flow speed on ramp 35.0 mph Volume on ramp 881 vph Length of first accel/decel lane 700 ft Length of second accel/decel lane ft Adjacent Ramp Data (if one exists) Does adjacent ramp exist? Yes Volume on adjacent Ramp 350 vph Position of adjacent Ramp Upstream Type of adjacent Ramp On Distance to adjacent Ramp 1420 ft Conversion to pc/h Under Base Conditions Junction Components Freeway Ramp Adjacent Ramp Volume, V (vph) vph Peak-hour factor, PHF Peak 15-min volume, v v Trucks and buses % Recreational vehicles % Terrain type: Level Level Level Grade % % % Length mi mi mi Trucks and buses PCE, ET Recreational vehicle PCE, ER
440 Heavy vehicle adjustment, fhv Driver population factor, fp Flow rate, vp pcph Estimation of V12 Merge Areas L = (Equation 13-6 or 13-7) EQ P = Using Equation 3 FM v = v (P ) = 3420 pc/h 12 F FM Capacity Checks Actual Maximum LOS F? v No FO v or v 2307 pc/h (Equation or 13-17) Is v or v > 2700 pc/h? No Is v or v > 1.5 v /2 Yes 12 If yes, v = 3420 (Equation 13-15, 13-16, 13-18, or 13-19) 12A Flow Entering Merge Influence Area Actual Max Desirable Violation? v No 12A Level of Service Determination (if not F) Density, D = v v L = 34.6 pc/mi/ln R R 12 A Level of service for ramp-freeway junction areas of influence D Speed Estimation Intermediate speed variable, M = S Space mean speed in ramp influence area, S = 51.7 mph R Space mean speed in outer lanes, S = 58.4 mph 0 Space mean speed for all vehicles, S = 53.9 mph
441 HCS 2010: Basic Freeway Segments Release 6.70 Phone: Fax: Operational Analysis Analyst: Makinzie Clark Agency or Company: Omni-Means Date Performed: 6/14/16 Analysis Time Period: PM Peak Hour Freeway/Direction: I-80 Eastbound From/To: North of Sierra College Blvd Jurisdiction: Caltrans Analysis Year: Cumulative+Project Description: Sierra Gateway Apartments TIS Flow Inputs and Adjustments Volume, V 5923 veh/h Peak-hour factor, PHF 0.92 Peak 15-min volume, v v Trucks and buses 9 % Recreational vehicles 0 % Terrain type: Level Grade - % Segment length - mi Trucks and buses PCE, ET 1.5 Recreational vehicle PCE, ER 1.2 Heavy vehicle adjustment, fhv Driver population factor, fp 1.00 Flow rate, vp 2243 pc/h/ln Speed Inputs and Adjustments Lane width - ft Right-side lateral clearance - ft Total ramp density, TRD - ramps/mi Number of lanes, N 3 Free-flow speed: Measured FFS or BFFS 65.0 mi/h Lane width adjustment, flw - mi/h Lateral clearance adjustment, flc - mi/h TRD adjustment - mi/h Free-flow speed, FFS 65.0 mi/h LOS and Performance Measures Flow rate, vp 2243 pc/h/ln Free-flow speed, FFS 65.0 mi/h Average passenger-car speed, S 54.9 mi/h Number of lanes, N 3 Density, D 40.8 pc/mi/ln Level of service, LOS E
442 HCS 2010: Basic Freeway Segments Release 6.70 Phone: Fax: Operational Analysis Analyst: Makinzie Clark Agency or Company: Omni-Means Date Performed: 6/14/16 Analysis Time Period: PM Peak Hour Freeway/Direction: I-80 Westbound From/To: North of Sierra College Blvd Jurisdiction: Caltrans Analysis Year: Cumulative+Project Description: Sierra Gateway Apartments TIS Flow Inputs and Adjustments Volume, V 4999 veh/h Peak-hour factor, PHF 0.92 Peak 15-min volume, v v Trucks and buses 9 % Recreational vehicles 0 % Terrain type: Level Grade - % Segment length - mi Trucks and buses PCE, ET 1.5 Recreational vehicle PCE, ER 1.2 Heavy vehicle adjustment, fhv Driver population factor, fp 1.00 Flow rate, vp 1893 pc/h/ln Speed Inputs and Adjustments Lane width - ft Right-side lateral clearance - ft Total ramp density, TRD - ramps/mi Number of lanes, N 3 Free-flow speed: Measured FFS or BFFS 65.0 mi/h Lane width adjustment, flw - mi/h Lateral clearance adjustment, flc - mi/h TRD adjustment - mi/h Free-flow speed, FFS 65.0 mi/h LOS and Performance Measures Flow rate, vp 1893 pc/h/ln Free-flow speed, FFS 65.0 mi/h Average passenger-car speed, S 61.6 mi/h Number of lanes, N 3 Density, D 30.8 pc/mi/ln Level of service, LOS D
443 HCS 2010: Freeway Merge and Diverge Segments Release 6.70 Phone: Fax: Diverge Analysis Analyst: Makinzie Clark Agency/Co.: Omni-Means Date performed: 6/14/16 Analysis time period: PM Peak Hour Freeway/Dir of Travel: I-80 Westbound Junction: Sierra College Blvd Off Ramp Jurisdiction: Caltrans Analysis Year: Cumulative+Project Description: Sierra Gateway Apartments TIS Freeway Data Type of analysis Diverge Number of lanes in freeway 3 Free-flow speed on freeway 65.0 mph Volume on freeway 4999 vph Off Ramp Data Side of freeway Right Number of lanes in ramp 1 Free-Flow speed on ramp 35.0 mph Volume on ramp 981 vph Length of first accel/decel lane 650 ft Length of second accel/decel lane ft Adjacent Ramp Data (if one exists) Does adjacent ramp exist? Yes Volume on adjacent ramp 306 vph Position of adjacent ramp Downstream Type of adjacent ramp On Distance to adjacent ramp 1650 ft Conversion to pc/h Under Base Conditions Junction Components Freeway Ramp Adjacent Ramp Volume, V (vph) vph Peak-hour factor, PHF Peak 15-min volume, v v Trucks and buses % Recreational vehicles % Terrain type: Level Level Level Grade 0.00 % 0.00 % 0.00 % Length 0.00 mi 0.00 mi 0.00 mi Trucks and buses PCE, ET Recreational vehicle PCE, ER
444 Heavy vehicle adjustment, fhv Driver population factor, fp Flow rate, vp pcph Estimation of V12 Diverge Areas L = (Equation or 13-13) EQ P = Using Equation 9 FD v = v + (v - v ) P = 3687 pc/h 12 R F R FD Capacity Checks Actual Maximum LOS F? v = v No Fi F v = v - v No FO F R v No R v or v 1991 pc/h (Equation or 13-17) Is v or v > 2700 pc/h? No Is v or v > 1.5 v /2 No 12 If yes, v = 3687 (Equation 13-15, 13-16, 13-18, or 13-19) 12A Flow Entering Diverge Influence Area Actual Max Desirable Violation? v No 12 Level of Service Determination (if not F) Density, D = v L = 30.1 pc/mi/ln R 12 D Level of service for ramp-freeway junction areas of influence D Speed Estimation Intermediate speed variable, D = S Space mean speed in ramp influence area, S = 53.0 mph R Space mean speed in outer lanes, S = 67.4 mph 0 Space mean speed for all vehicles, S = 57.3 mph
445 HCS 2010: Freeway Merge and Diverge Segments Release 6.70 Phone: Fax: Merge Analysis Analyst: Makinzie Clark Agency/Co.: Omni-Means Date performed: 6/14/16 Analysis time period: PM Peak Hour Freeway/Dir of Travel: I-80 Westbound Junction: Sierra College Blvd On Loop Jurisdiction: Caltrans Analysis Year: Cumulative+Project Description: Sierra Gateway Apartments TIS Freeway Data Type of analysis Merge Number of lanes in freeway 3 Free-flow speed on freeway 65.0 mph Volume on freeway 4018 vph On Ramp Data Side of freeway Right Number of lanes in ramp 1 Free-flow speed on ramp 25.0 mph Volume on ramp 306 vph Length of first accel/decel lane 700 ft Length of second accel/decel lane ft Adjacent Ramp Data (if one exists) Does adjacent ramp exist? Yes Volume on adjacent Ramp 510 vph Position of adjacent Ramp Downstream Type of adjacent Ramp On Distance to adjacent Ramp 1560 ft Conversion to pc/h Under Base Conditions Junction Components Freeway Ramp Adjacent Ramp Volume, V (vph) vph Peak-hour factor, PHF Peak 15-min volume, v v Trucks and buses % Recreational vehicles % Terrain type: Level Level Level Grade % % % Length mi mi mi Trucks and buses PCE, ET Recreational vehicle PCE, ER
446 Heavy vehicle adjustment, fhv Driver population factor, fp Flow rate, vp pcph Estimation of V12 Merge Areas L = (Equation 13-6 or 13-7) EQ P = Using Equation 3 FM v = v (P ) = 2725 pc/h 12 F FM Capacity Checks Actual Maximum LOS F? v No FO v or v 1839 pc/h (Equation or 13-17) Is v or v > 2700 pc/h? No Is v or v > 1.5 v /2 Yes 12 If yes, v = 2725 (Equation 13-15, 13-16, 13-18, or 13-19) 12A Flow Entering Merge Influence Area Actual Max Desirable Violation? v No 12A Level of Service Determination (if not F) Density, D = v v L = 24.8 pc/mi/ln R R 12 A Level of service for ramp-freeway junction areas of influence C Speed Estimation Intermediate speed variable, M = S Space mean speed in ramp influence area, S = 56.5 mph R Space mean speed in outer lanes, S = 60.2 mph 0 Space mean speed for all vehicles, S = 57.8 mph
447 HCS 2010: Freeway Merge and Diverge Segments Release 6.70 Phone: Fax: Merge Analysis Analyst: Makinzie Clark Agency/Co.: Omni-Means Date performed: 6/14/16 Analysis time period: PM Peak Hour Freeway/Dir of Travel: I-80 Westbound Junction: Sierra Collge Blvd On Ramp Jurisdiction: Caltrans Analysis Year: Cumulative+Project Description: Sierra Gateway Apartments TIS Freeway Data Type of analysis Merge Number of lanes in freeway 3 Free-flow speed on freeway 65.0 mph Volume on freeway 4324 vph On Ramp Data Side of freeway Right Number of lanes in ramp 1 Free-flow speed on ramp 35.0 mph Volume on ramp 510 vph Length of first accel/decel lane 700 ft Length of second accel/decel lane ft Adjacent Ramp Data (if one exists) Does adjacent ramp exist? Yes Volume on adjacent Ramp 306 vph Position of adjacent Ramp Upstream Type of adjacent Ramp On Distance to adjacent Ramp 1560 ft Conversion to pc/h Under Base Conditions Junction Components Freeway Ramp Adjacent Ramp Volume, V (vph) vph Peak-hour factor, PHF Peak 15-min volume, v v Trucks and buses % Recreational vehicles % Terrain type: Level Level Level Grade % % % Length mi mi mi Trucks and buses PCE, ET Recreational vehicle PCE, ER
448 Heavy vehicle adjustment, fhv Driver population factor, fp Flow rate, vp pcph Estimation of V12 Merge Areas L = (Equation 13-6 or 13-7) EQ P = Using Equation 3 FM v = v (P ) = 2932 pc/h 12 F FM Capacity Checks Actual Maximum LOS F? v No FO v or v 1979 pc/h (Equation or 13-17) Is v or v > 2700 pc/h? No Is v or v > 1.5 v /2 Yes 12 If yes, v = 2932 (Equation 13-15, 13-16, 13-18, or 13-19) 12A Flow Entering Merge Influence Area Actual Max Desirable Violation? v No 12A Level of Service Determination (if not F) Density, D = v v L = pc/mi/ln R R 12 A Level of service for ramp-freeway junction areas of influence C Speed Estimation Intermediate speed variable, M = S Space mean speed in ramp influence area, S = 55.8 mph R Space mean speed in outer lanes, S = 59.7 mph 0 Space mean speed for all vehicles, S = 57.2 mph
449 HCS 2010: Basic Freeway Segments Release 6.70 Phone: Fax: Operational Analysis Analyst: Makinzie Clark Agency or Company: Omni-Means Date Performed: 6/14/16 Analysis Time Period: PM Peak Hour Freeway/Direction: I-80 Westbound From/To: Sierra College Blvd/Rocklin Rd Jurisdiction: Caltrans Analysis Year: Cumulative+Project Description: Sierra Gateway Apartments TIS Flow Inputs and Adjustments Volume, V 4834 veh/h Peak-hour factor, PHF 0.92 Peak 15-min volume, v v Trucks and buses 9 % Recreational vehicles 0 % Terrain type: Level Grade - % Segment length - mi Trucks and buses PCE, ET 1.5 Recreational vehicle PCE, ER 1.2 Heavy vehicle adjustment, fhv Driver population factor, fp 1.00 Flow rate, vp 1830 pc/h/ln Speed Inputs and Adjustments Lane width - ft Right-side lateral clearance - ft Total ramp density, TRD - ramps/mi Number of lanes, N 3 Free-flow speed: Measured FFS or BFFS 65.0 mi/h Lane width adjustment, flw - mi/h Lateral clearance adjustment, flc - mi/h TRD adjustment - mi/h Free-flow speed, FFS 65.0 mi/h LOS and Performance Measures Flow rate, vp 1830 pc/h/ln Free-flow speed, FFS 65.0 mi/h Average passenger-car speed, S 62.4 mi/h Number of lanes, N 3 Density, D 29.3 pc/mi/ln Level of service, LOS D


450 Memorandum To: The Ezralow Company Date: February 27, 2017 Attn: Sid Paul Project: Sierra Gateway Apartments From: Kamesh Vedula, P.E., T.E. Kenneth Isenhower III, E.I.T. Re: Analysis of Reduced Density Job No.: Alternative File No.: C1783MEM002.DOCX CC: Introduction This technical memorandum has been prepared to present the evaluation of a Reduced Density Alternative for proposed project of Sierra Gateway Apartments. Sierra Gateway Apartments is a proposed development on the southeast corner of Sierra College Boulevard and Rocklin Road in Rocklin, Ca. The project as proposed is anticipated to construct an apartment complex with approximately 195 dwelling units. The Transportation Impact Report (October 2016) prepared in support of the environmental clearance for the project indicated that the project will not create a significant impact for Existing Plus Project and Short Term Plus Project conditions at the study locations. With full build-out of the project, the proposed project is projected to have significant and unavoidable impacts at the intersections of Rocklin Road/I-80 WB Ramps and Rocklin Road/I-80 EB Ramps under Cumulative conditions. The purpose of this memorandum is to assess if the Reduced Density Alternative (at 170 units) will result in less than significant impacts. As noted previously, full build-out of the project resulted in significant impacts at the intersections of Rocklin Road/I-80 WB Ramps and Rocklin Road/I-80 EB Ramps under Cumulative conditions. Therefore, this analysis will focus on impacts at these two intersections for Cumulative conditions. At 170 units, the Reduced Density Alternative is expected to generate 87 AM peak hour trips and 111 PM peak hour trips. Since the PM peak hour generates higher trips this analysis focused on the PM peak hour operations. When compared to the full build-out of the project, this represents a trip reduction of 12 AM peak hour trips and 14 PM peak hour trips. Table 1 provides a comparison of the Cumulative No Project and Cumulative Plus Project with the Reduced Density Alternative level of service at the Rocklin Road interchange intersections. 943 Reserve Drive l Suite 100 l Roseville, CA l p l omnimeans.com Napa I Redding l Roseville l San Luis Obispo l Visalia l Walnut Creek
Traffic Impact Study for the TAVA Homes Project at 1584 East Santa Clara Avenue in the City of Santa Ana
 Traffic Impact Study for the TAVA Homes Project at 1584 East Santa Clara Avenue in the City of Santa Ana March 2011 Prepared for: URS Corporation 2020 E. First Street, Suite #400 Santa Ana, CA 92705 Tel:
APPENDIX D. Traffic Impact Analysis
 APPENDIX D Traffic Impact Analysis TRAFFIC IMPACT ANALYSIS CALEXICO SOLAR FARM I County of Imperial, California July 8, 2011 LLG Ref. 3-11-2034 Prepared by: Cara Leone Transportation Planner II Under the
Calipatria Solar Farm TIA
 Calipatria Solar Farm TIA Prepared for: 7SM 8ME, LLC 71SM 8ME, LLC c/o 8minutenergy Renewables LLC Prepared by: Fehr & Peers March 25, 211 IE1-37 TABLE OF CONTENTS Executive Summary... i Project Trip Estimates...
Appendix D. Transportation Study
 Appendix D Transportation Study Draft KUNZLER TERRACE MINE PROJECT Transportation Study Prepared for May 29 County of Mendocino Draft KUNZLER TERRACE MINE PROJECT Transportation Study Prepared for May
TRAFFIC IMPACT ANALYSIS. MIDWAY SOLAR FARM II County of Imperial, California January 11, 2011
 TRAFFIC IMPACT ANALYSIS MIDWAY SOLAR FARM II County of Imperial, California January 11, 2011 LLG Ref. 3-10-2013 Prepared by: Cara Leone Transportation Planner II Under the Supervision of: Chris Mendiara
CITY OF KIRKLAND TRAFFIC IMPACT ANALYSIS GUIDELINES
 CITY OF KIRKLAND TRAFFIC IMPACT ANALYSIS GUIDELINES SEPA TRANSPORTATION CONCURRENCY - ROAD IMPACT FEES Introduction Revised February 2004 These guidelines describe how to prepare a traffic study, or Traffic
Traffic Impact Analysis Shotwell Road Residential Clayton, NC
 Shotwell Road Residential Clayton, NC TABLE O CONTENTS 1. INTROUCTION...1 1.1. Site Location and Study Area...1 1.2. Proposed Land Use and Site Access...2 1.3. Adjacent Land Uses...2 1.4. Existing Roadways...2
Traffic Impact Study for the Girard Winery Project
 October 16, 2014 Ms. Heather McCollister 1512 D Street Napa, CA 94559 Traffic Impact Study for the Girard Winery Project Dear Ms. McCollister; Whitlock & Weinberger Transportation, Inc. (W-Trans) has completed
Traffic Impact Analysis
 LA PALMA VILLAGE INITIAL STUDY CITY OF ANAHEIM Appendices Appendix I Traffic Impact Analysis September 2015 LA PALMA VILLAGE INITIAL STUDY CITY OF ANAHEIM Appendices This page intentionally left blank.
HILLTOP SENIOR LIVING CENTER Pollard Station Traffic Impact Analysis
 HILLTOP SENIOR LIVING CENTER Pollard Station Traffic Impact Analysis Prepared for Town of Truckee Prepared by TRANSPORTATION CONSULTANTS, INC. Pollard Station TRAFFIC IMPACT ANALYSIS Prepared for the Town
APPENDIX E TRANSPORTATION
 APPENDIX E TRANSPORTATION 2011 PATRON SURVEYS VISSIM MODEL CALIBRATION AND VALIDATION Environmental and Planning Consultants 440 Park Avenue South 7th Floor New York, NY 10016 tel: 212 696-0670 fax:
ENHANCED PARKWAY STUDY: PHASE 3 REFINED MLT INTERSECTION ANALYSIS
 ENHANCED PARKWAY STUDY: PHASE 3 REFINED MLT INTERSECTION ANALYSIS Final Report Prepared for Maricopa County Department of Transportation Prepared by TABLE OF CONTENTS Page EXECUTIVE SUMMARY ES-1 STUDY
Speed Limit and Safety Nexus Studies for Automated Enforcement Locations in the District of Columbia East Capitol Street at Southern Avenue NE
 Speed Limit and Safety Nexus Studies for Automated Enforcement Locations in the District of Columbia East Capitol Street at Southern Avenue NE Study Area and Location District PSA Ward ANC Phase Description
SIMULATION AND ANALYSIS OF ARTERIAL TRAFFIC OPERATIONS ALONG THE US 61 CORRIDOR IN BURLINGTON, IOWA FINAL REPORT
 SIMULATION AND ANALYSIS OF ARTERIAL TRAFFIC OPERATIONS ALONG THE US 61 CORRIDOR IN BURLINGTON, IOWA FINAL REPORT Principal Investigator Tom Maze Principal Contributor Ali Kamyab Sponsored by the Engineering
Study Area and Location District PSA Ward ANC Phase Description G Proposed 2900 Block Military Road Northwest Eastbound
 Speed Limit and Safety Nexus Studies for Automated Enforcement Locations in the District of Columbia 29 Block Military Road NW E/B Study Area and Location District PSA Ward ANC Phase Description 2 21 3
195 Hegenberger Road Hotel: Traffic Circulation Analysis in Response to Comments on the Final EIR
 350 Frank H. Ogawa Plaza Suite 300 Oakland, CA 94612 510.839.5066 phone 510.839.5825 fax www.esassoc.com Technical Memorandum date November 12, 2014 to from subject Colleen Liang, Port Associate Environmental
APPENDIX I Traffic Impact Analysis
 APPENDIX I Traffic Impact Analysis Traffic Impact Analysis Collier Park Renovations Final Report Prepared for: 3570 Carmel Mountain Road Suite 300 San Diego, CA, 92130 8130 Allison Avenue La Mesa, CA
Site 17 W3-160 KEY: District Department of Transportation 55 M Street, SE, Suite 400 Washington, DC 20003
 Speed Limit and Safety Nexus Studies for Automated Enforcement Locations in the District of Columbia Connecticut Avenue at Calvert Street NW Study Area and Location District PSA Ward ANC Phase Description
Study Area and Location District PSA Ward ANC Phase Description G Planned Connecticut Avenue Northbound at Military Road Northwest
 Speed Limit and Safety Nexus Studies for Automated Enforcement Locations in the District of Columbia Connecticut Avenue at Military Road NW Study Area and Location District PSA Ward ANC Phase Description
Downtown Boise Multimodal Center
 Treasure Valley High Capacity Transit Study Downtown Boise Multimodal Center Environmental Assessment June 2009 Prepared by the Federal Transit Administration and Valley Regional Transit. U.S. Department
An Assessment of Congestion in the Kansas City Region using the MARC Travel Demand Model
 An Assessment of Congestion in the Kansas City Region using the MARC Travel Demand Model The Congestion Management Process Federal Regulations state that all metropolitan planning organizations must carry
Speed Limit and Safety Nexus Studies for Automated Enforcement Locations in the District of Columbia DC Miles South of Pennsylvania Avenue SE
 Speed Limit and Safety Nexus Studies for Automated Enforcement Locations in the District of Columbia DC 295.4 Miles South of Pennsylvania Avenue SE Study Area and Location District PSA Ward ANC Phase Description
Crystal Springs Upland School Transportation Demand Management Plan. March 2016
 Crystal Springs Upland School Transportation Demand Management Plan March 06 CONTENTS Introduction... Transportation Demand Management (TDM) Program.... Background/Survey of Existing Student Commuting
Traffic Impact Study for the Grove Street Subdivision
 Whitlock & Weinberger Transportation, Inc. 490 Mendocino Avenue Suite 201 Santa Rosa, CA 95401 voice (707) 542-9500 fax (707) 542-9590 475 14 th Street Suite 290 Oakland, CA 94612 voice (510) 444-2600
Municipal Service Park 3 December Consolidation of City services to one centralized complex
 Municipal Service Park 3 December 2010 Consolidation of City services to one centralized complex Overview: Operational Challenges and Opportunities South East Connector impacts Opportunities: The South
Study Area and Location District PSA Ward ANC Phase Description B Planned Branch Avenue Northbound at Alabama Avenue Southeast
 Speed Limit and Safety Nexus Studies for Automated Enforcement Locations in the District of Columbia Branch Avenue at Alabama Avenue SE Study Area and Location District PSA Ward ANC Phase Description 6
Speed Limit and Safety Nexus Studies for Automated Enforcement Locations in the District of Columbia 1100 Block 4th Street NE
 Speed Limit and Safety Nexus Studies for Automated Enforcement Locations in the District of Columbia 11 Block 4th Street NE Study Area and Location District PSA Ward ANC Phase Description 1 14 6 6C Proposed
Council of State Governments. Takoma Langley Transit Center Purple Line Project Briefing. October 28, 2013
 Council of State Governments Takoma Langley Transit Center Purple Line Project Briefing October 28, 2013 Takoma Langley Transit Center Purpose and Need Provide a safe, attractive and efficient facility
Study Area and Location District PSA Ward ANC Phase Description D Proposed 1900 Block Foxhall Road Northwest Southbound
 Speed Limit and Safety Nexus Studies for Automated Enforcement Locations in the District of Columbia 19 Block Foxhall Road NW S/B Study Area and Location District PSA Ward ANC Phase Description 2 25 3
Addendum: Final Design Noise Analysis Study Noise Sensitive Area (NSA) 11 Post March 15, 2016 Open House Response to Comments
 11 Post March 15, 2016 Open House Response to Comments") Final Design Township of Lower Makefield, Bucks County, Pennsylvania Township of Ewing, Mercer County, New Jersey Addendum: Final Design Noise Analysis Study Noise Sensitive Area (NSA) 11 Post March 15,
Final Design Township of Lower Makefield, Bucks County, Pennsylvania Township of Ewing, Mercer County, New Jersey Addendum: Final Design Noise Analysis Study Noise Sensitive Area (NSA) 11 Post March 15,
Final Report. Interstate-680 Bus-on-Shoulder Feasibility Assessment. prepared for
 Final Report Interstate-680 Bus-on-Shoulder Feasibility Assessment prepared for Metropolitan Transportation Commission & Contra Costa Transportation Authority prepared by HDR in association with Fehr &
Study Area and Location District PSA Ward ANC Phase Description C Existing 3500 Block Massachusetts Avenue Northwest Eastbound
 Speed Limit and Safety Nexus Studies for Automated Enforcement Locations in the District of Columbia 35 Block Massachusetts Avenue NW Study Area and Location District PSA Ward ANC Phase Description 2 24
GORE BUILDING. 238 N. Massachusetts Avenue, Lakeland, FL 33801
 GORE BUILDING 238 N. Massachusetts Avenue, Lakeland, FL 33801 CDB LOCATION REDEVELOPMENT PROJECT MUNN PARK HISTORIC DISTRICT INCENTIVES AVAILABLE ADJACENT PARKING INCLUDED BK698301 Phone: (863) 683-3425
6.9 Intelligent Transportation Systems
 6.9 Intelligent Transportation Systems This chapter describes Intelligent Transportation Systems (). The chapter also describes the process that defines how agencies and systems are interconnected through
Speed Limit and Safety Nexus Studies for Automated Enforcement Locations in the District of Columbia Inside Southern part of 3rd Street Tunnel
 Speed Limit and Safety Nexus Studies for Automated Enforcement Locations in the District of Columbia Inside Southern part of 3rd Street Tunnel Study Area and Location District PSA Ward ANC Phase Description
Study Area and Location District PSA Ward ANC Phase Description A Proposed I-395 Southwest after Exit 4, Eastbound
 Speed Limit and Safety Nexus Studies for Automated Enforcement Locations in the District of Columbia I-395 SW after Exit 4 E/B Study Area and Location District PSA Ward ANC Phase Description 1 71 8 8A
Des Moines Area Regional Transit Non Rider Survey
 Moines Area Regional Transit Non Rider Survey helping organizations make better decisions since 1982 Findings Report Submitted to the Moines Area Regional Transit Authority by: ETC Institute 725 W. Frontier
ESTIMATING PARAMETERS FOR MODIFIED GREENSHIELD S MODEL AT FREEWAY SECTIONS FROM FIELD OBSERVATIONS
 0 ESTIMATING PARAMETERS FOR MODIFIED GREENSHIELD S MODEL AT FREEWAY SECTIONS FROM FIELD OBSERVATIONS Omor Sharif University of South Carolina Department of Civil and Environmental Engineering 00 Main Street
Cedar Rapids ITS Deployment Project
 Cedar Rapids ITS Deployment Project Concept of Operations July 29, 2011 Table of Contents Section 1 Introduction Purpose Goal of ITS Deployments Section 2 Needs Assessment General Background Stakeholders
Study Area and Location District PSA Ward ANC Phase Description A Proposed 6100 Block Georgia Avenue Northwest Southbound
 Speed Limit and Safety Nexus Studies for Automated Enforcement Locations in the District of Columbia 6100 Block Georgia Avenue NW Study Area and Location District PSA Ward ANC Phase Description 4 402 4
Managing DC Work Zones: DDOT s Citywide Transportation Management Plan
 Managing DC Work Zones: DDOT s Citywide Transportation Management Plan ARTBA National Work Zone Management Conference September 20, 2016 1 Outline Citywide Transportation Management Plan (TMP) Citywide
Pueblo City-County Addressing Standards May 2010
 Pueblo City-County Addressing Standards May 2010 I. Definitions & Descriptions There can be up to four address types in the various databases within the County. They include situs, building, establishment
Appendix D Supportive Transportation Materials
 Appendix D Supportive Transportation Materials D.1. Stakeholder Input and Coordination As noted in Section 1.7 of the main Master Plan document, there have been several opportunities for stakeholders to
BOARD OF SUPERVISORS 2017 TRANSPORTATION SUMMIT INFORMATION ITEM
 BOARD OF SUPERVISORS 2017 TRANSPORTATION SUMMIT INFORMATION ITEM Date of Meeting: # 9 SUBJECT: ELECTION DISTRICTS: STAFF CONTACTS: Public and Private Infrastructure Improvements Adjacent to the Dulles
PUBLIC WORKS ORGANIZATIONAL CHART
 PUBLIC WORKS ORGANIZATIONAL CHART C-108 Actual 2012-13 Adopted Year-End Estimated 2014-15 2015-16 PROGRAM EXPENSES/REVENUES Salaries & Benefits $ 1,725,030 $ 1,855,980 $ 1,676,130 $ 1,956,510 $ 1,979,470
Study Area and Location District PSA Ward ANC Phase Description A Existing 1700 Block North Portal Drive Northwest Southwest-bound
 Speed Limit and Safety Nexus Studies for Automated Enforcement Locations in the District of Columbia 17 Block North Portal Drive NW Study Area and Location District PSA Ward ANC Phase Description 4 41
STUDY REPORT #1 ADDENDUM
 STUDY REPORT #1 ADDENDUM 1.0 PURPOSE OF ADDENDUM This document is an addendum to Study Report #1: Sub-System Planning Alternatives. The purpose of this addendum is to bridge the gap between the initial
Integrating Travel Demand Management into the Long-Range Planning Process 2017 AMPO
 Integrating Travel Demand Management into the Long-Range Planning Process 2017 AMPO October 19, 2017 Chattanooga 2045 RTP Chattanooga 2045 RTP addresses both transportation supply and demand Continued
Director of Public Works/City Engineer. Secretary. Word Processor. Streets and Facilities Supervisor. Traffic Signal Technician.
 PUBLIC WORKS ORGANIZATIONAL CHART Director of Public Works/City Engineer Secretary Word Processor Transit Services Manager Fleet Services Supervisor Streets and Facilities Supervisor Principal Principal
Travel Demand Modeling and Project Coding Procedures
 Travel Demand Modeling and Project Coding Procedures Revised July 2008 As described in the Final Transportation Conformity Rule (section 93.122), travel demand models used to generate emission estimates
APPENDIX A TDM Development Guideline
 Appendix A: TDM Development Guideline APPENDIX A TDM Development Guideline Appendix A: TDM Development Guideline Page A.1 1 INTRODUCTION AND OVERVIEW 1.1 About This Guideline This guideline contains information
Transportation & Mobility
 Transportation & Mobility October 11, 2017 October 11, 2017 Community Dialogue Series Session 3: Transportation & Mobility YOU ARE NOT STUCK IN TRAFFIC. YOU ARE TRAFFIC. October 11, 2017 Community Dialogue
National Roundabout Conference 2005 DRAFT High-Capacity Roundabout Intersection Analysis: Going Around in Circles David Stanek, PE & Ronald T. Milam,
 High-Capacity Roundabout Intersection Analysis: Going Around in Circles David Stanek, PE & Ronald T. Milam, AICP TRB National Roundabout Conference May 24, 2005 Vail, CO Presentation Overview What is a
Honorable Mayor and Members of the City Council. Memorandum of Understanding: Interstate 80 Integrated Corridor Mobility (I-80 ICM) Project
 Project") Office of the City Manager CONSENT CALENDAR May 1, 2012 To: From: Honorable Mayor and Members of the City Council Christine Daniel, Interim City Manager Submitted by: Andrew Clough, Director, Public Works
Office of the City Manager CONSENT CALENDAR May 1, 2012 To: From: Honorable Mayor and Members of the City Council Christine Daniel, Interim City Manager Submitted by: Andrew Clough, Director, Public Works
TRACY HILLS SPECIFIC PLAN RECIRCULATED DRAFT SUBSEQUENT ENVIRONMENTAL IMPACT REPORT VOLUME III OCTOBER 2015
 TRACY HILLS SPECIFIC PLAN RECIRCULATED DRAFT SUBSEQUENT ENVIRONMENTAL IMPACT REPORT VOLUME III OCTOBER 2015 APPENDIX H-6B CORRESPONDENCE DOCUMENTS LIVERMORE, DATED FALL 2014 Chau, Elizabeth From: Sent:
DESIGN CRITERIA MEMORANDUM
 State Route 49 Realignment Study DESIGN CRITERIA MEMORANDUM ATTACHMENT G SR 49 Realignment Study STATE ROUTE 49 El Dorado to Coloma El Dorado County, CA DESIGN CRITERIA MEMORANDUM Introduction The El
Bellevue s Traffic Adaptive Signals
 What we ll cover Bellevue s Traffic Adaptive Signals SCATS Phase 1 Implementation SCATS Operations Responsiveness New Features Some Initial Results 2011 Program and Beyond Final Thoughts ITE Quad Mtg April
North Metro Corridor Draft Environmental Impact Statement (DEIS) Public Hearings. December 9 & 10, 2009
 Public Hearings. December 9 & 10, 2009") North Metro Corridor Draft Environmental Impact Statement (DEIS) Public Hearings December 9 & 10, 2009 1 Welcome & Introductions 2 3 What Are We Doing Here Tonight? Public Hearing for RTD North Metro Corridor
North Metro Corridor Draft Environmental Impact Statement (DEIS) Public Hearings December 9 & 10, 2009 1 Welcome & Introductions 2 3 What Are We Doing Here Tonight? Public Hearing for RTD North Metro Corridor
Combined Ranking Method for Screening Collision Monitoring Locations along Alberta Highways
 Combined Ranking Method for Screening Collision Monitoring Locations along Alberta Highways Robert Duckworth, P. Eng., PTOE, Infrastructure Management System Specialist, Planning Branch, Alberta Transportation
S-03-SegB: South Federal Way to Fife LRT
 Project Number S-03-SegB Subarea South King/Pierce Primary Mode Light Rail Facility Type Corridor Length 4.0 miles Version ST Board Workshop Date Last Modified 11-25-2015 PROJECT AREA AND REPRESENTATIVE
Site 40. Recreational Center
 Speed Limit and Safety Nexus Studies for Automated Enforcement Locations in the District of Columbia Georgia Avenue S/B at Missouri Avenue NW Study Area and Location District PSA Ward ANC Phase Description
ARLINGTON COUNTY, VIRGINIA
 ARLINGTON COUNTY, VIRGINIA County Board Agenda Item Meeting of December 12, 2015 DATE: December 1, 2015 SUBJECT: SP-84-U-15-1 USE PERMIT ASSOCIATED WITH A SITE PLAN for a telecommunications facility; located
Site 59 W5-147 KEY: District Department of Transportation 55 M Street, SE, Suite 400 Washington, DC 20003
 Speed Limit and Safety Nexus Studies for Automated Enforcement Locations in the District of Columbia 11 Block Bladensburg Road NE SW/B Study Area and Location District PSA Ward ANC Phase Description 5
EASTSIDE CITY OF BELLEVUE/ PRIVATE PRIVATE PRIVATE MULTI-PRIVATE MULTI-PRIVATE
 SITE COMPARISON CHART CITY Bellevue County Kirkland Kirkland Redmond ADDRESS 555 116th Ave. Lane 118th Ave. 14955 90th St. ACREAGE 5.6 10.7 7.5 5.5 7.2 to 11.6 ACRES ZONING COMMERCIAL LIGHT INDUSTRIAL
TRANSIT CENTER DISTRICT PLAN
 TRANSIT CENTER DISTRICT PLAN Informational Presentation Planning Commission 04.19.2012 San Francisco Planning Department In partnership with: San Francisco Redevelopment Agency Transbay Joint Powers Authority
County of Loudoun. Department of Planning and Zoning MEMORANDUM
 County of Loudoun Department of Planning and Zoning MEMORANDUM DATE: June 12, 2015 TO: FROM: Jacqueline Harlow, Project Manager Planner III, Land Use Review Kelly Williams, Planner III Community Planning
Proposed FY 06 Project Development Program and FY 05 Project Development Program Update
 Washington Metropolitan Area Transit Authority Proposed FY 06 Project Development Program and FY 05 Project Development Program Update Presented to the Board of Directors: P D E C Planning & Development
PLANNING COMMISSION WORK SESSION
 DEPARTMENT OF BUILDING AND DEVELOPMENT Date of Meeting: STAFF REPORT PLANNING COMMISSION WORK SESSION SUBJECT: ELECTION DISTRICT: FIDP-2016-0002, Ashburn Station North Broad Run CRITICAL ACTION DATE: STAFF
Metrobus 30s Line Enhancements
 Customer Service, Operations and Safety Committee Action Item III-C February 14, 2008 Metrobus 30s Line Enhancements Washington Metropolitan Area Transportation Authority Board Action/Information Summary
Using Empirical (real-world) Transportation Data to Extend Travel Demand Model Capabilities
 Transportation Data to Extend Travel Demand Model Capabilities") Portland State University PDXScholar TREC Friday Seminar Series Transportation Research and Education Center (TREC) 10-4-2013 Using Empirical (real-world) Transportation Data to Extend Travel Demand Model
Portland State University PDXScholar TREC Friday Seminar Series Transportation Research and Education Center (TREC) 10-4-2013 Using Empirical (real-world) Transportation Data to Extend Travel Demand Model
Approval of Navy Yard Chiller Joint Development Agreement
 Planning, Program Development and Real Estate Committee Item V B July 9, 2015 Approval of Navy Yard Chiller Joint Development Agreement Washington Metropolitan Area Transit Authority Board Action/Information
MARTA BOARD OF DIRECTORS OCTOBER 4, 2018
 MARTA BOARD OF DIRECTORS OCTOBER 4, 2018 TODAY S AGENDA o Key driver of the program o Recommended plan o Project summaries o Next steps 2 KEY DRIVER: PUBLIC INPUT o Atlanta City Design o Atlanta s Transportation
Northwest Needs Improvements Survey
 PW5 NW 107th Ave One thousand feet N of NW 122nd St Okeechobee Rd Widen bridge over Miami Canal PW6 NW 82nd Ave NW 8th St NW 12th St Construct new 4-lane road PW7 NW 87 Ave NW 36th St NW 58th St Add 2-lanes
Station Location Feasibility Study
 Station Location Feasibility Study Gateway Cities Gateway Cities Service Council Meeting May 11, 2017 Gateway Cities Service Council Meeting May 11, 2017 1 Meeting Purpose Introduce and present the Metrolink
Transit Development Plan/Transportation Demand. Chuck Steigerwald Director of Strategic Planning. Management Plan
 Transit Development Plan/Transportation Demand Chuck Steigerwald Director of Strategic Planning Management Plan OmniRide Strategic Plan Phase III TDP/TDMP Recommended service changes Ten-year plan Final
DATE: April 8, 2013 REPORT NO. CD TYPE OF REPORT CONSENT ITEM [ ] ITEM FOR CONSIDERATION [ X ]
![DATE: April 8, 2013 REPORT NO. CD TYPE OF REPORT CONSENT ITEM [ ] ITEM FOR CONSIDERATION [ X ]](/thumbs/89/97518073.jpg "DATE: April 8, 2013 REPORT NO. CD TYPE OF REPORT CONSENT ITEM [ ] ITEM FOR CONSIDERATION [ X ]") DATE: April 8, 2013 REPORT NO. CD2013-040 TO: FROM: Chair and Members Committee of the Whole Community Services Gregory Dworak, General Manager Community Services 1.0 TYPE OF REPORT CONSENT ITEM [ ] ITEM
DATE: April 8, 2013 REPORT NO. CD2013-040 TO: FROM: Chair and Members Committee of the Whole Community Services Gregory Dworak, General Manager Community Services 1.0 TYPE OF REPORT CONSENT ITEM [ ] ITEM
Los Angeles County Metropolitan Transportation Authority (Metro) Arterial Performance Measures Framework
 Arterial Performance Measures Framework") Los Angeles County Metropolitan Transportation Authority (Metro) Arterial Performance Measures Framework Anita Vandervalk-Ostrander Iteris, Inc. Santa Ana, California, USA Steven Gota, Deputy Executive
Los Angeles County Metropolitan Transportation Authority (Metro) Arterial Performance Measures Framework Anita Vandervalk-Ostrander Iteris, Inc. Santa Ana, California, USA Steven Gota, Deputy Executive
Creating transportation system intelligence using PeMS. Pravin Varaiya PeMS Development Group
 Creating transportation system intelligence using PeMS Pravin Varaiya PeMS Development Group Summary Conclusion System overview Routine reports: Congestion monitoring, LOS Finding bottlenecks Max flow
2018 State and Federal Legislative Program
 2018 State and Federal Legislative Program STATE TRANSPORTATION FUNDING The passage of HB 2313 (2013) was the result of bipartisan cooperation throughout the Commonwealth. The regional funding provided
Dulles Area Transportation Association
 Dulles Area Transportation Association February 8, 2017 Susan Shaw, P.E., Megaprojects Director Virginia Department of Transportation Transform 66: Outside the Beltway 2 Project Scope Multimodal improvements
ROADWAY LIGHTING CURFEW
 STATE OF RHODE ISLAND AND PROVIDENCE PLANTATIONS Rhode Island Department of Transportation ROADWAY LIGHTING CURFEW IMPLEMENTATION PLAN March 25, 21 TABLE OF CONTENTS INTRUDUCTION/OVERVIEW... 1 1.1. ANTICIPATED
St. Helena Island 5-6 December,
 5-6 December, 2011 Beaufort County Multi-Jurisdictional Form-Based Code Workshop and Charrette Report 2011 Opticos Design, Inc. 154 Beaufort County Multi-Jurisdictional Form-Based Code Workshop and Charrette
vision42
 vision42 www.vision42.org vision4 auto-free light rail 2 boulevard for 42nd Street Roxanne Warren, AIA, Chair George Haikalis, ASCE, Co-Chair Institute for Rational Urban Mobility,Inc. www.vision42.org
STAFF REPORT. Meeting Date: To: From: La Cienega Station. Subject: Attachments:
 Ii STAFF REPORT Meeting Date: To: From: Subject: June 20, 2017 Honorable Mayor & City Council Mark Cuneo, City Engineer Robert Welch, Project Manager Metro Purple Line Extension Section 1 Construction
Bluetooth Travel Time Technology Evaluation Using the BlueTOAD TM
 Bluetooth Travel Time Technology Evaluation Using the BlueTOAD TM E01271 PennDOT District 6-0 ITS & Support Open End Contract Work Order #1 Submitted To: Pennsylvania Department of Transportation Engineering
SITE DESCRIPTION. Vicinity
 SITE DESCRIPTION Vicinity The Montrose Shopping Center is located in the northeast quadrant of the intersection of Randolph Road and Rockville Pike (MD 355). The existing building (formally known as the
MEMORANDUM. Church of the Redeemer School Focused Transportation Impact Analysis
 MEMORANDUM Date: Februrary 2, 2016 To: From: Subject: Father Samer Youssef, Church of the Redeemer Sarah Jampole and Matt Haynes, Fehr & Peers Church of the Redeemer School Focused Transportation Impact
TRANSPORTATION DEMAND MANAGEMENT (TDM) PLAN FOR MINNETONKA
 PLAN FOR MINNETONKA") TRANSPORTATION DEMAND MANAGEMENT (TDM) PLAN FOR MINNETONKA Kyle Burrows Kristina Nesse Andrew Owen Renan Snowden Humphrey School of Public Affairs University of Minnesota AGENDA Transportation Demand Management:
TRANSPORTATION DEMAND MANAGEMENT (TDM) PLAN FOR MINNETONKA Kyle Burrows Kristina Nesse Andrew Owen Renan Snowden Humphrey School of Public Affairs University of Minnesota AGENDA Transportation Demand Management:
Northern Virginia Transportation Authority
 IV Northern Virginia Transportation Authority March 23, 2017 Susan Shaw, P.E., Megaprojects Director Virginia Department of Transportation 66 Outside the Beltway Project Scope Multimodal improvements to
Deployment of ITS Projects in Pasadena A Local Agency Perspective
 Deployment of ITS Projects in Pasadena A Local Agency Perspective ITS California Annual Meeting October 2, 2013 Norman Baculinao, PE Pasadena and the Region Source: Census Transportation Planning Package,
INDUSTRIAL LAND FOR SALE
 INDUSTRIAL LAND FOR SALE INDUSTRIAL LAND & DEVELOPMENT OPPORTUNITIES 150 ACRE INDUSTRIAL BUSINESS PARK LOTS RANGING FROM 5 150 ACRES Property Features Nexus at DIA provides a compelling opportunity for
Appendix A Air Quality Construction Emissions Calculations
 Appendix A Air Quality Construction Emissions Calculations ES012007014SCO/POLBEDISONAVENEGDEC_BS2501.DOC/070290001 Appendix A POLB - Edison Avenue Construction Emissions Table 1. Construction Emissions
OR 217,I-5 Experience Portland, OR
 OR 217,I-5 Experience Portland, OR By: Abby Caringula Parsons Brinckerhoff July 8th, 2011 Presentation Outline Background VISUM Network Adjustment Model Origin-Destination(O-D) Demand Development ANM Export
Transit Oriented Development Best Practices Seminar Series
 Transit Oriented Development Best Practices Seminar Series January 22, 2007 Presented by Jim Prost, AICP, Principal Basile Baumann Prost Cole & Associates 177 Defense Highway, Suite 10 Annapolis, Maryland
A. INTRODUCTION B. PRINCIPAL CONCLUSIONS AND IMPACTS C. METHODOLOGY
 Chapter 15: Safety and Security A. INTRODUCTION This chapter discusses safety and security as they relate to the Proposed Project and summarizes how potential safety and security issues are identified
2017 STP PROJECT APPLICATION (OREGON)
") Project Title Section 1. Applicant Information Name of Lead Agency/ Organization Address Phone Number Name & Title of Contact Person Email Address Certified Local Public Agency (Yes/No) Section 2. Project
Project Title Section 1. Applicant Information Name of Lead Agency/ Organization Address Phone Number Name & Title of Contact Person Email Address Certified Local Public Agency (Yes/No) Section 2. Project
IV.I.1 Police Protection
 1. INTRODUCTION This section of the Draft EIR discusses police protection within the project area. Sources of information used in the preparation of this section include: coordination with the Los Angeles
Kansas Division. January 31, 2018
 Division January 31, 6111 SW 29 th, Suite 100 Topeka, 66614 (785) 273-2600 (785) 273-2620 (fax) www.fhwa.dot.gov/ksdiv/index.htm Catherine M. Patrick, P.E. State Transportation Engineer Department of Transportation
McTrans. McByte FLORIDA UNIVERSITY OF. TSIS-CORSIM 6.0 Release is Imminent. Analyzing Congested Signalized Intersections. McTrans
 McTrans M o v i n g T e c h n o l o g y Volume 34 January 2006 Newsletter Analyzing Congested Signalized Intersections TSIS-CORSIM 6.0 Release is Imminent In the typical signalized intersection capacity
Bus Circulator Feasibility Study Scope of Work March 12, 2018
 The City of Hyattsville Comprehensive Transportation and Infrastructure Study Bus Circulator Feasibility Study Scope of Work March 12, 2018 Project Approach At the request of the City of Hyattsville, Toole