History May Not Repeat Itself, But it Certainly Does Rhyme* *Mark Twain. An Economic and Real Estate Forecast. Chief Economist, Stewart Title
|
|
|
- Joleen Gray
- 6 years ago
- Views:
Transcription
1 History May Not Repeat Itself, But it Certainly Does Rhyme* *Mark Twain An Economic and Real Estate Forecast November 5, 2010 Ted C. Jones, PhD Chief Economist, Stewart Title
2 The New Business Model i.e. Things are different today..
3 The New Business Model 1. Cost Control is Essential 2. Consumers Have Changed Expectations 3. Less is More


4

5 Boom & the Bust Act Like Business Cycles Have Been Repealed Preceded by Deregulation Followed by 6 Years High Unemployment 5 Years Declining Home Prices Gov t Debt Grows 86% Bust Boom
6 Jobs Are Everything Period.
7 6 US Employment September Year Millions Louisiana Jobs September Year Millions Million Fewer Jobs 22,000 Lost Jobs 10 Years at 100,000 Per Month = 12 Million Needed Jobs 1.2 Percent Loss
8 U.S. Job Numbers Jobs (Millions) Seasonally Adjusted Million Lost Since Jan ,000 Lost in Sept ,000 Gained YTD '07 '08 '09 '10 7
9 U.S. Unemployment Rate Percentage Percent Average '79 '82 '85 '88 '91 '94 '97 '00 '03 '06 '09 8
10 New Orleans Civilian Employment Thousands of Jobs '07 '08 '09 '10
11 New Orleans Jobs Percent Change from Same Month Prior Year 20.0% Not Seasonally Adjusted 10.0% 0.0% -10.0% 67 '01 '02 '03 '04 '05 '06 '07 '08 '09 ' % -30.0% US New Orleans 1,900 Net New Additional Jobs in the Past 12 Months
12 New Orleans Jobs Percent Change from Same Month Prior Year 6.0% 4.0% 2.0% 0.0% -2.0% -4.0% -6.0% Not Seasonally Adjusted '01 '02 '03 '04 '05 '06 '07 '08 '09 '10 US New Orleans 67 1,900 Net New Additional Jobs in the Past 12 Months
13 12 Louisiana Employment Trends September Comparison Net New Jobs Compound Annual Job Growth Rate Thousands 1 Year 10 Years Alexandria % 0.69% Baton Rouge % 0.80% Houma-Bayou Cane-Thibodaux % 1.64% Lafayette % 0.96% Lake Charles % 0.19% Monroe % -0.38% New Orleans-Metairie-Kenner % -1.74%
14 Inflation Expectations Percent Percent 10-Year Average Current 2.2 Percent '79 '82 '85 '88 '91 '94 '97 '00 '03 '06 '09 University of Michigan 13
15 Average Daily Global Oil Consumption Millions of Barrels Per Day '00 '02 '04 '06 '08 '10f
16 '06 '98 '02 '94 US Energy Consumption Consumption Quadrillion BTUs Other Nuclear Hydro Natural Gas Oil 0 Coal 15 '50 '54 '58 '62 '66 '70 '74 '78 '82 '86 '90
17 Rotary Rig Count Average Number Working Per Month 5,000 4,000 3,000 2,000 1,000 0 '80 '83 '86 '89 '92 '95 '98 '01 '04 '07 '10 16
18 17 Well Head Natural Gas Price Price Per 1,000 Cubic Feet 3 Month Moving Average $12 $10 $8 $6 $4 $2 $0 '80 '83 '86 '89 '92 '95 '98 '01 '04 '07 '10
19 Spot Oil Price West Texas Intermediate Price Per Barrel 3 Month Moving Average $140 $120 $100 $80 $60 $40 $20 $0 '80 '83 '86 '89 '92 '95 '98 '01 '04 '07 '10 Wall Street Journal-St Louis Fed 18
20 30-Year Residential Mortgage Rate Percent '02 '03 '04 '05 '06 '07 '08 '09 '10
21 Oil Prices & 10-Year Treasury Note Rates September 2010 Dollars Oil Prices $140 $ Year Treasury Rates % 17 $ $80 $60 $40 $ $ '02 '05 '
22 Oil Prices & Exchange Rates $US Per Euro Oil in September 2010 Dollars Oil Prices Dollars Per Euro $140 $120 $100 $1.65 $1.45 $80 $60 $40 $1.25 $1.05 $20 '02 '03 '04 '05 '06 '07 '08 '09 '10 $
23 US Treasury Rates 3-Nov-09 3-Nov-10 BP Change 1 mo mo mo yr yr yr yr yr yr yr yr US Department of the Treasury 22
24 Why Interest Rates Are Going To Increase 23 Japanese Buyer of 2-Year Treasury Note in September 2008 Dollar-Yen Exchange Date Event U.S. Dollars Rate Yen Purchase the Bond $ (100,000.00) $ (10,660,000) Interest Payment $ $ 46, Interest Payment $ $ 43, Interest Payment $ $ 43, Interest Payment $ $ 39, Bond Redempetion $ 100, $ 8,330,000 Total (With No Time Value of Money) (2,155,664) $ Return (No Time Value of Money) -20.2%
25 Recession Recovery The recovery in every recession since 1949 has been led by a recovery in the housing market
26 September 2010 US Existing Home Sales Sold (Millions) '02 '03 '04 '05 '06 '07 '08 '09 '10 National Association of REALTORS 25
27 U.S. Existing Home Sales Median Price -- $ Thousands $250 Down 23 Percent From 12-Month Average Peak in July 2006 $200 $150 $100 $50 $0 '01 '02 '03 '04 '05 '06 '07 '08 '09 '10 National Association of REALTORS 26
28 September 2010 U.S. New Home Sales Sold -- Thousands 1,400 1,200 1, '02 '03 '04 '05 '06 '07 '08 '09 '10 27
29 September 2010 U.S. New Home Sales Median Price $ Thousands $250 $200 $150 $100 $50 $0 '02 '03 '04 '05 '06 '07 '08 '09 '10 28
30 Louisiana Housing Sales Seasonally Adjusted Annualized Rate -- Thousands 100 National Association of REALTORS '02 '03 '04 '05 '06 '07 '08 '09 '10
31 New Orleans Existing Home Prices Average Price $250,000 $200,000 $150,000 $100,000 $50,000 $0 '04 '05 '06 '07 '08 '09 '10
32 Louisiana Residential Building Permits Number of Dwelling Units 40,000 30,000 Single Family Multi 20,000 10, '00 '02 '04 '06 '08 '10f
33 32 Real 2010 GDP Forecasts Sub Saharan Africa Latin America Emerging Asia Emerging Markets China Japan Eurozone US World 4.9% 2.0% 6.7% 4.4% 8.8% 0.8% 0.5% 1.9% 2.5% BMI
34 Gross Domestic Product -- GDP Value of All Goods and Services Produced by a Country GDP = C + I + G + (Ex Im) Where: C = Consumption I = Investments G = Government Spending Ex = Exports Im = Imports Q Percent Q Percent 33
35 U.S. GDP by Category GDP Components Net Change Peak Current Sustainable During Demand Demand Demand Recession Share Share Share Consumption -0.7% 69.9% 70.3% 65.0% Investment -15.7% 15.9% 13.6% 17.5% Government 4.5% 18.4% 19.4% 17.5% Exports - Imports 19.9% -4.2% -3.4% 0.0% How Much It s Grown From What It Is To What It Should Be St Louis Fed 34
36 Consumer Sentiment Q = Average Double Dip Recession S&L Crisis 9-11 Subprime '79 '82 '85 '88 '91 '94 '97 '00 '03 '06 '09 University of Michigan 35
37 Retail Sales Real, Inflation Adjusted Percent Change From Same Month in Prior Year 8.0% 4.0% 0.0% -4.0% -8.0% -12.0% Largest Contraction in Retail Sales Since the Depression '92 '94 '96 '98 '00 '02 '04 '06 '08 '10 St. Louis Fed
38 Light Weight Vehicle Sales Millions Seasonally Adjusted Annual Rates '90 '92 '94 '96 '98 '00 '02 '04 '06 '08 '10 Bureau of Economic Analysis 37
39 Current Conditions Summary GLOBAL ECONOMY U.S. ECONOMY Housing Employment Consumers Inflation Stocks -- Bonds Near-Term Outlook Scattered Recoveries PIGS Issues Foreclosures 1 in 4 Homeowners Underwater Prices Stabilizing in Selected Markets New Home Sales at Record Lows Mortgage Interest Rates At Record Lows Job Losses Ongoing Stimulus Did Not Work Rate of Losses Moderating Spending Growth Is Sporadic Consumer Recessionary Levels Deflationary Threat Diminishing Demographics Save the Day in the Long Run For the US Bond Bubble Burst Potential Uncertainty Rules! Tepid Job Growth at Best in
40 Investments????????????????????????????????????????????????????????????????????????????
41 Gold Price Per Ounce Nominal (Not Inflation Adjusted) 40 $1,500 $1,200 $900 Jan 1980 to Now Gold Up 95.5 Percent 1.95X $600 $300 $0 '80 '83 '86 '89 '92 '95 '98 '01 '04 '07 '10
42 Gold Price Per Ounce Real -- August 2010 $Dollars $2,000 $1,600 $1,200 Jan 1980 to Now Gold Down 30.3 Percent 0.70X $800 $400 $0 '80 '83 '86 '89 '92 '95 '98 '01 '04 '07 '10 41
43 Existing Home Prices $ Thousands --Nominal Average of MSA Medians $225 $200 $175 $150 $125 $100 $75 $50 $25 $0 Jan 1980 to Now Housing Up 238 Percent 3.38X '80 '82 '84 '86 '88 '90 '92 '94 '96 '98 '00 '02 '04 '06 '08 '10 National Association of REALTORS 42
44 Existing Home Prices $ Thousands Real Inflation Adjusted Aug 2010 $s $250 $200 Jan 1980 to Now Housing Up 22.3 Percent $150 $100 $50 $0 '80 '82 '84 '86 '88 '90 '92 '94 '96 '98 '00 '02 '04 '06 '08 '10 National Association of REALTORS 43
45 Bond Yields Percent Effective Yield CCC & Less B Corp BB Corp BBB Corp A Corp AA-AAA Corp '97 '98 '99 '00 '01 '02 '03 '04 '05 '06 '07 '08 '09 '10 Merrill Lynch - Bloomberg 44
46 IRF Bond Yield Premium Analysis Historical AA/AAA Current Basis Points Basis Points Average Spread Current Spread AA/AAA A BBB BB B CCC Down , Historical Current Premium Premium A 9.1% 27.7% BBB 22.7% 56.4% BB 54.3% 139.8% B 91.1% 196.3% CCC Down 213.5% 319.1% Premium calculated as a percentage of AA/AAA 45


47 $561 Billion Spent 613,000 New Jobs YTD $915,200 Per Job
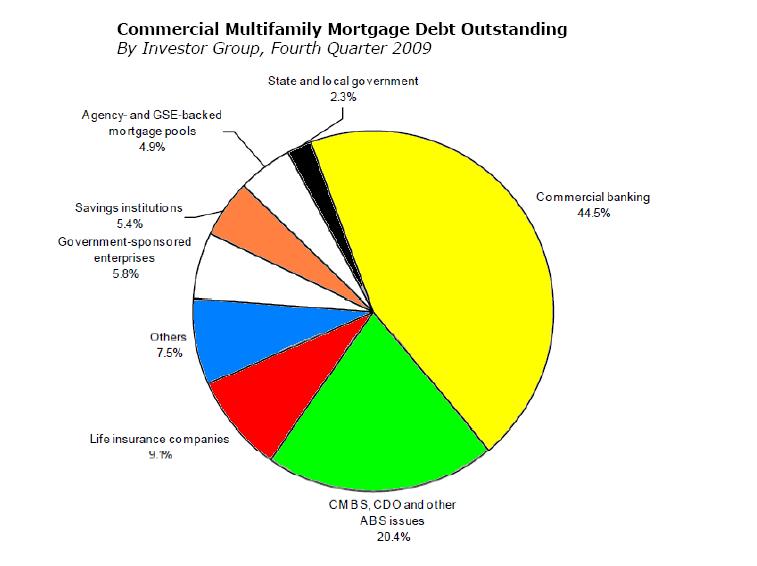
48 Real Estate Commercial Sales Percent $ Billion Change 2007 $ $ % 2009 $ % $58 Billion Q1+Q2+Q Forecast 2010 = $ % 47
49 $3.5 Trillion in Total Commercial Loans $400 Billion to Refinance Per Year for Next 10 Years

50
51 Mortgage Bankers Association Office Building Washington, DC Purchased 2007 $79.0 Million Sold Feb 2010 $41.3 Million Loss $37.7 Million 47.7 Percent
52 MIT Real Estate Group NCREIF Commercial Real Estate Property Value Indices 51
53 Estimated Current Property Value Compared to Q Acquisiton Date Property Type Apartments Industrial Office Retail 2000 Q1 41.3% 16.9% 26.7% 40.2% Q2 35.8% 13.9% 23.5% 43.6% Q3 30.5% 10.5% 20.7% 43.9% Q4 29.3% 10.9% 20.1% 50.2% 2001 Q1 30.8% 6.9% 21.1% 53.4% Q2 21.5% 4.1% 24.0% 46.1% Q3 22.2% 5.3% 28.7% 43.1% Q4 22.4% 7.7% 32.6% 44.4% 2002 Q1 21.3% 13.1% 26.8% 40.7% Q2 25.0% 10.6% 31.3% 37.5% Q3 24.5% 9.1% 22.9% 32.0% Q4 20.5% 4.3% 25.1% 24.2% 2003 Q1 21.6% 8.2% 23.7% 25.4% Q2 22.3% 3.8% 25.5% 17.7% Q3 18.7% -2.0% 21.7% 28.5% Q4 18.0% -2.9% 21.3% 20.2% 2004 Q1 19.3% -4.2% 21.1% 15.5% Q2 14.7% -10.0% 16.5% 10.0% Q3 8.5% -9.3% 15.4% 3.8% Q4 6.2% -9.7% 11.1% -0.3% 2005 Q1-2.2% -6.7% 8.0% 1.2% Q2-2.4% -25.1% -1.4% -17.8% Q3-17.1% -26.0% -7.7% -20.6% Q4-20.9% -25.7% -15.9% -20.6% 52
54 Estimated Current Property Value Compared to Q Acquisiton Date Estimated Percent Change in Value Since Acquisition Property Type Apartments Industrial Office Retail 2006 Q1-23.8% -32.8% -19.4% -21.8% Q2-21.8% -34.1% -19.5% -24.0% Q3-21.1% -32.6% -24.5% -25.6% Q4-21.4% -38.3% -28.6% -27.3% 2007 Q1-19.6% -39.6% -30.9% -28.3% Q2-24.0% -43.6% -35.2% -28.1% Q3-27.7% -41.8% -35.7% -27.1% Q4-27.2% -37.8% -35.3% -25.8% 2008 Q1-26.8% -38.0% -33.7% -21.9% Q2-25.5% -33.1% -28.0% -21.0% Q3-24.5% -31.7% -26.6% -21.3% Q4-13.0% -24.9% -20.8% -18.3% 2009 Q1-8.3% -5.4% -17.3% -14.8% Q2-1.4% -5.4% -6.2% -5.6% Q3-1.1% -4.1% -0.6% -1.2% Q4 8.0% -2.1% 9.2% 4.3% 2010 Q1 5.4% 5.5% 5.0% 5.2% Q2 0.0% 0.0% 0.0% 0.0%
55 Texas Multifamily Prices Down 10 to 15 Percent Since 2007 Peak Texas Industrial Cap Rates Up 100 Basis Points From 6.5 Percent Value Down 13+ Percent

56
57 Capitalization Rate Impact Percent Change in Property Value As Cap Rates Increase New Original Rate Rate 5.0% 5.5% 6.0% 6.5% 7.0% 7.5% 8.0% 8.5% 9.0% 9.5% 5.0% 5.5% -9.1% 6.0% -16.7% -8.3% 6.5% -23.1% -15.4% -7.7% 7.0% -28.6% -21.4% -14.3% -7.1% 7.5% -33.3% -26.7% -20.0% -13.3% -6.7% 8.0% -37.5% -31.3% -25.0% -18.8% -12.5% -6.3% 8.5% -41.2% -35.3% -29.4% -23.5% -17.6% -11.8% -5.9% 9.0% -44.4% -38.9% -33.3% -27.8% -22.2% -16.7% -11.1% -5.6% 9.5% -47.4% -42.1% -36.8% -31.6% -26.3% -21.1% -15.8% -10.5% -5.3% 10.0% -50.0% -45.0% -40.0% -35.0% -30.0% -25.0% -20.0% -15.0% -10.0% -5.0% 10.5% -52.4% -47.6% -42.9% -38.1% -33.3% -28.6% -23.8% -19.0% -14.3% -9.5% 11.0% -54.5% -50.0% -45.5% -40.9% -36.4% -31.8% -27.3% -22.7% -18.2% -13.6% 11.5% -56.5% -52.2% -47.8% -43.5% -39.1% -34.8% -30.4% -26.1% -21.7% -17.4% % -58.3% -54.2% -50.0% -45.8% -41.7% -37.5% -33.3% -29.2% -25.0% -20.8% -
58 Multifamily Assessed Value Percent Years Change % % % % % % 2007 Texas Apartment Resales
59 Federal Budget Surplus (Deficit) 58 $ Billions '01 '02 '03 '04 '05 '06 '07 '08 '09 '10f '11f $0.0 -$ $ $ $ $1, $1, $1, $1,600.0
60 Federal On-Budget Deficit Forecast 59 $ Billions Baseline ($10.7 Trillion Total Debt ) $0.0 '01 '02 '03 '04 '05 '06 '07 '08 '09 '10 '11f '12 '13 '14 '15 '16 '17 '18 '19 '20 -$ $ $ $ $1, $1, $1, $1,600.0 $10.7 Trillion Cumulative Debt Dec $10.53 Trillion
61 2011 Economic Concerns Wall Street Washington DC Liquidity Jobs Stimulus Not Working GDP=C+I+G Time Bomb Loans Now Commercial Cold War II Terrorists Inflation (and Cap Rates)--Recession Tax Cut Clock Ticking. Energy: US Imports 70+ Percent of Oil Real Estate-Autos-Credit Cards-Banks

62 Ted s Blog

63 Ted C. Jones, PhD Chief Economist Stewart Title Guaranty Co.
Real Estate Forecast 2015
 Real Estate Forecast 2015 No Place But Up Interest Rates Rents Prices Real Estate and the Economy Ted C. Jones, PhD Chief Economist Stewart Title Guaranty Company Thank Heavens for Global Warming Think
For Every Action There is An Equal and Opposite Reaction Newton Was an Economist - The Outlook for Real Estate and the Economy
 For Every Action There is An Equal and Opposite Reaction Newton Was an Economist - The Outlook for Real Estate and the Economy Ted C. Jones, PhD Chief Economist Twitter #DrTCJ Mega Themes More Jobs Than
Federal Reserve Bank of Chicago 22 nd Annual Economic Outlook Symposium. Automotive Outlook. Will Shearin December 5, 2008
 Federal Reserve Bank of Chicago 22 nd Annual Economic Outlook Symposium Automotive Outlook Will Shearin December 5, 2008 Ability to Buy Leading Indicators Nov 07 Nov 08 Disposable Income Green Red Household
Economic and Housing Market Trends and Outlook
 Economic and Housing Market Trends and Outlook Lawrence Yun, Ph.D. Chief Economist NATIONAL ASSOCIATION OF REALTORS Presentation to Memphis Area Association of REALTORS Memphis, TN April 2, 213 Forecast
Houston Economic Outlook. Prepared by Patrick Jankowski SVP Research
 Houston Economic Outlook Prepared by Patrick Jankowski SVP Research Longest U.S. Expansions Tech Boom '91 - '01 120 Current Boom June '09 to Present 114 60s Boom '61 - '69 Reagan Years '82 - '90 92 106
Economic Update German American Chamber of Commerce
 Economic Update German American Chamber of Commerce Federal Reserve Bank of Chicago October 6, 2015 Paul Traub Senior Business Economist U.S. Real GDP Billions Chained $2009, % Change Q/Q at SAAR $ Billions
Economic Update Birmingham Bloomfield Chamber
 Economic Update Birmingham Bloomfield Chamber Paul Traub Senior Business Economist Federal Reserve Bank of Chicago/Detroit Branch January 11, 2019 The views expressed here are our own and do not necessarily
The Vision Council Winds of Change
 The Vision Council Winds of Change Brian Beaulieu CEO Preliminary 217 Forecast Results If you heard ITR a year ago 2 Duration Accuracy US GDP (data through Sep) 24 98.5% US Ind. Prod. (Dec) 24 96.8% Eur
Urban Land Institute A Bend in the Road
 Urban Land Institute A Bend in the Road Brian Beaulieu CEO 216 Forecast Results 2 Duration Accuracy US GDP 15 99.1% US Ind. Prod. 1 99.9% Eur Ind. Prod. 15 99.2% Canada Ind Prod 15 99.6% China Ind Prod
Economic Update. Automotive Insights Conference. Paul Traub. Federal Reserve Bank of Chicago January 18, Senior Business Economist
 Economic Update Automotive Insights Conference Federal Reserve Bank of Chicago January 18, 2018 Paul Traub Senior Business Economist Main Economic Indicators Year-over-year Comparison 2015 2016 2017 GDP
Economic Update Birmingham Bloomfield Chamber Breakfast
 Economic Update Birmingham Bloomfield Chamber Breakfast Federal Reserve Bank of Chicago February 2, 2016 Paul Traub Senior Business Economist Overview U.S. Economy (C + I + G + Nx) U.S. Consumer Monetary
Light Vehicle Sales Are We at a Turning Point?
 Light Vehicle Sales Are We at a Turning Point? Federal Reserve Bank of Chicago June 3, 2016 Paul Traub Senior Business Economist Overview U.S. Economy (C + I + G + Nx) U.S. Consumer Ability and Willingness
Consensus Outlook
 Consensus Outlook - 219 Thirty-second Annual Economic Outlook Symposium November 3, 218 William Strauss Senior Economist and Economic Advisor Federal Reserve Bank of Chicago The views expressed herein
Economic Update Baker College - Flint
 Economic Update Baker College - Flint Federal Reserve Bank of Chicago January 10, 2017 Paul Traub Senior Business Economist Main Economic Indicators Year-over-year Comparison Actual 2014 2015 2016 GDP
Economic Outlook. William Strauss Senior Economist and Economic Advisor Federal Reserve Bank of Chicago
 Economic Outlook Illinois Public Pension Fund Association Hoffman Estates, IL February 16, 217 William Strauss Senior Economist and Economic Advisor Federal Reserve Bank of Chicago GDP expanded by 1.9%
Consensus Outlook
 Consensus Outlook - 218 Thirty-first Annual Economic Outlook Symposium December 1, 217 William Strauss Senior Economist and Economic Advisor Federal Reserve Bank of Chicago The views expressed herein are
FISCAL REALITY. Alan Beaulieu, President, ITR Economics
 FISCAL REALITY Alan Beaulieu, President, ITR Economics Alan s presentations cover a wide variety of topics including short- and long-term global economic forecasts, regional economic updates, an outlook
Consensus Outlook 2018 and 2019
 Consensus Outlook 218 and 219 Twenty-fourth Annual Automotive Outlook Symposium June 2, 217 William Strauss Senior Economist and Economic Advisor Federal Reserve Bank of Chicago The views expressed herein
No Place But Up Interest Rates Rents, Prices Real Estate and the Economy
 No Place But Up Interest Rates Rents, Prices Real Estate and the Economy But Not Oil Ted C. Jones, PhD Chief Economist Stewart Title Guaranty Company Mega Themes More Jobs Than Ever in History Retail Boom
Urban Land Institute. November Make Your Move. Brian Beaulieu ITR Economics.
 Urban Land Institute November 212 Make Your Move Brian Beaulieu ITR Economics Results for 211 2 Duration Forecast Actual GDP 18 $13.525 $13.332 (-1.4%) US Ind Prod. 11 93.1 (12MMA) 93.8 (.8%) EU Ind. Prod.
Economic Outlook C.F.A. West Michigan Society Luncheon
 Economic Outlook C.F.A. West Michigan Society Luncheon Federal Reserve Bank of Chicago Detroit Branch May 22, 2012 Paul Traub Overview Economy - GDP The U.S. Consumer Home Prices Inflation Employment U.S.
76 Million Boomers. 83 Million Millennials 19 to Million Millennials 16 to 35
 76 Million Boomers 83 Million Millennials 19 to 35 91 Million Millennials 16 to 35 Top Millennial Population Growth Markets 2005 to 2015 12-Month Population Job Rank City, State Growth Growth 1 Charlotte,
THE ELECTION, SMALL BUSINESS, AND THE ECONOMY
 THE ELECTION, SMALL BUSINESS, AND THE ECONOMY WILLIAM DUNKELBERG CHIEF ECONOMIST, NFIB TWO WAYS OUT, NEITHER DESIRABLE INDEX OF CONSUMER SENTIMENT QUARTERLY APRIL 110 100 Index Value 90 80 70 60
The Outlook for the U.S. Economy
 The Outlook for the U.S. Economy John V. Duca Associate Director of Research and Vice President Federal Reserve Bank of Dallas Danforth/Lewis Professor of Economics Oberlin College January 2018 The views
Automotive Outlook. William Strauss Senior Economist and Economic Advisor Federal Reserve Bank of Chicago
 Automotive Outlook Georgia State University Economic Forecasting Center Atlanta, GA August 23, 2017 William Strauss Senior Economist and Economic Advisor Federal Reserve Bank of Chicago Brief Macro Assessment
Economic Outlook. William Strauss Senior Economist and Economic Advisor Federal Reserve Bank of Chicago
 Economic Outlook Midwest Association of Rail Shippers Lombard, IL January 13, 216 William Strauss Senior Economist and Economic Advisor Federal Reserve Bank of Chicago The Great Recession ended in June
2014 Forecast Results
 214 Forecast Results Duration Forecast Result* Accuracy US GDP 15 $16.98 Trillion $16.345 Trillion 98.5% US Ind. Prod. 13 11.5 (12MMA) 14.2 97.3% EU Ind. Prod. 14 1.6 (12MMA) 11.6 99.% Canada Ind Prod
Real Estate Forecast 2017
 Real Estate Forecast 2017 Twitter @DrTCJ Non-Renewals - Dead on Arrival Mortgage Insurance Deductibility Residential Mortgage Debt Forgiveness Residential Energy Savings Renewables Wind and Solar ObamaCare
CEMA Marc Mar h c 2013 Alan Alan Beaulieu ITR E c E onomics ITR Economics
 CEMA March 213 Make Your Move: 213-214214 Alan Beaulieu ITR Economics 212 Forecast Results 2 Duration Forecast GDP 12 $13.593 Actuals $13.593 Trillion $13.648 $13.648.4% US Ind. Prod. 31 97.2 (12MMA) 97.2.%
Ted C. Jones Chief Economist. Ted C. Jones, PhD Chief Economist
 Ted C. Jones Chief Economist Ted C. Jones, PhD Chief Economist When Getting On An Airplane, the Person On the Aisle Always Gets There First Things Change Jobs are Everything Period U.S. Jobs Jobs (Millions)
Houston Economic Outlook. Patrick Jankowski
 Houston Economic Outlook Patrick Jankowski www.houston.org Follow me on Twitter @pnjankowski May 22 10:30 a.m. Hilton Post Oak It s not Christmas but... 5 It s not Christmas but... Population Estimates
The Role of the Federal Reserve Metropolitan Research Group UM-D
 The Role of the Federal Reserve Metropolitan Research Group UM-D Federal Reserve Bank of Chicago January 24, 2017 Paul Traub Senior Business Economist The Federal Reserve System 1 Functions of the Federal
Cornbelt Economic Prospects for November 7, 2012 Decatur, IL. David Oppedahl Business Economist
 Cornbelt Economic Prospects for 2013 November 7, 2012 Decatur, IL David Oppedahl Business Economist 312-322-6122 david.oppedahl@chi.frb.org The economy hit bottom in June 2009, with hesitant growth since
U.S. Oil & Gas Industry Chartbook
 U.S. Oil & Gas Industry Chartbook BBVA Research USA Houston, TX March 215 DISCLAIMER This document was prepared by Banco Bilbao Vizcaya (BBVA) BBVA Research U.S. on behalf of itself and its affiliated
ECONOMIC OUTLOOK SECOND-LONGEST US EXPANSION IN HISTORY, CAN IT SET A RECORD?
 ECONOMIC OUTLOOK SECOND-LONGEST US EXPANSION IN HISTORY, CAN IT SET A RECORD? Augustine Faucher Chief Economist Florida School Finance Officers Association Hyatt Regency Jacksonville June 15, 2018 Gus
The Economic Outlook. Dr. George Mokrzan Director of Economics. November 9, 2017
 The Economic Outlook Dr. George Mokrzan Director of Economics November 9, 217 The Economic Outlook for the Nation The U.S. economy (real GDP) is forecasted to grow at a moderate pace of 2.3% in 218, close
Economic Update Michigan Actuarial Society
 Economic Update Michigan Actuarial Society Paul Traub Senior Business Economist Federal Reserve Bank of Chicago/Detroit Branch December 5, 2018 The views expressed here are our own and do not necessarily
Houston Economic Overview Presented by Patrick Jankowski, SVP Research Greater Houston Partnership
 Houston Economic Overview Presented by Patrick Jankowski, SVP Research Greater Houston Partnership Order of the Day Order of the Day Rig count fell 80% Oil prices dropped 75% Energy layoffs spiked Office
Economic Performance and Outlook
 1/14/211 From Recovery to Expansion: How and When The U.S. and Washington Area Economic Performance and Outlook Stephen S. Fuller, PhD Dwight Sh Schar Faculty Chair and University it Professor Director,
Ted C. Jones, PhD Chief Economist
 Ted C. Jones, PhD Chief Economist Hurricanes U.S. Jobs Jobs (Millions) Seasonally Adjusted 150 145 140 135 130 1.41% Prior 12 Months 2.05 Million Net New Jobs in Past 12-Months 125 '07 '08 '09 '10 '11
Consensus Forecast for 2007 William Strauss
 Consensus Forecast for 2007 William Strauss Senior Economist and Economic Advisor Federal Reserve Bank of Chicago Winners of last year s Economic Outlook Symposium forecast Best Overall Economic Forecast:
Real Estate Forecast 2019
 Real Estate Forecast 2019 Ted C. Jones, PhD Chief Economist The First People Not to Read the Apple Terms & Conditions Prior To Clicking Accept Were Adam & Eve When Getting On An Airplane, the Person On
Houston Economic Outlook. Patrick Jankowski
 Houston Economic Outlook Patrick Jankowski Houston s Economic Drivers U.S. Economic Growth Global Trade Outlook for Energy U.S. Economic Growth 3 Gross Domestic Product Seasonally Adjusted Annual Growth
ASIA SHIPPING OUTLOOK
 OCTOBER 2016 ASIA SHIPPING OUTLOOK TPM Asia 2016 Mario O. Moreno, Senior Economist, IHS Maritime & Trade +1 973 776 7850 Mario.Moreno@ihsmarkit.com Agenda Asia Shipping Outlook / October 2016 Asia US trade
Forging Industry Association
 Forging Industry Association Alan s TEC Generic Prosperity in the Age of Decline Brian Beaulieu CEO 213 Forecast Results 2 Duration Forecast Actuals Accuracy US GDP 12 $15.818 Trillion $15.966 Dec 99.3%
2016 Market Update. Gary Keller and Jay Papasan Keller Williams Realty, Inc.
 2016 Market Update Gary Keller and Jay Papasan Housing Market Cycles 1. Home Sales The Numbers That Drive U.S. 2. Home Price 3. Months Supply of Inventory 4. Mortgage Rates Real Estate 1. Home Sales Nationally
Where Did Prosperity Go and How Do We Bring it Back?
 Where Did Prosperity Go and How Do We Bring it Back? by Lacy H. Hunt, Ph.D., Chief Economist Hoisington Investment Management Co. SIC 2016 May 24-27, 2016 6836 Bee Caves Road Building 2, Suite 100 Austin,
Marine Leadership Alliance Winds of Change
 Marine Leadership Alliance Winds of Change Connor Lokar Economist 217 Forecast Results If you heard ITR around two years ago 2 Duration Accuracy US GDP 24 99.7% US Ind. Prod. 24 96.8% Europe Ind. Prod.
Beige Book: Windo on Main Street
 KEY TAKEAWAYS Beige Book: Windo on Main Street September 11, 2015 by John Canally of LPL Financial The latest Beige Book suggests that the U.S. economy is still growing at or above its long-term trend,
Is the U.S. Losing Its Manufacturing Base?
 Is the U.S. Losing Its Manufacturing Base? Rocky Mountain Economic Summit Afton, WY July 10, 2014 William Strauss Senior Economist and Economic Advisor Federal Reserve Bank of Chicago 2 The Setup Manufacturing
Today s Vision Tomorrow s Reality. Brian Beaulieu CEO
 Canadian Institute of Plumbing and Heating Today s Vision Tomorrow s Reality Brian Beaulieu CEO 215 Forecast Results 2 Duration 215 Forecast Result Accuracy US GDP 18 $16.632 Trillion $16.442 Trillion
Industrial Supply Association Winds of Change
 Industrial Supply Association Winds of Change Dr. Alan Beaulieu President 217 Forecast Results If you heard ITR around two years ago 2 Duration Accuracy US GDP 24 99.7% US Ind. Prod. 24 96.8% Europe Ind.
ECON MACROECONOMIC THEORY Instructor: Dr. Juergen Jung Towson University. J.Jung Chapter 1 - Introduction Towson University 1 / 38
 ECON 310 - MACROECONOMIC THEORY Instructor: Dr. Juergen Jung Towson University J.Jung Chapter 1 - Introduction Towson University 1 / 38 Disclaimer These lecture notes are customized for Intermediate Macroeconomics
OUTLOOK FOR THE U.S. ECONOMY AND FINANCIAL MARKETS
 OUTLOOK FOR THE U.S. ECONOMY AND FINANCIAL MARKETS GIC/PCBE Luncheon Philadelphia February, A Presentation by: Martin H. Barnes Managing Editor The Bank Credit Analyst mbarnes@bcaresearch.com Sherbrooke
+ 11.5% % + 7.3%
 ly Indicators A RESEARCH TOOL PROVIDED BY THE SANTA FE ASSOCIATION OF REALTORS INCLUDES ALL SINGLE FAMILY, CONDO AND TOWNHOME LISTINGS IN THE MLS Q1 2018 New residential real estate activity has been relatively
NEW ENGLAND ECONOMIC OUTLOOK
 NEW ENGLAND ECONOMIC OUTLOOK 13 th Annual Regional & Community Bankers Conference November 17, 2014 Mary A. Burke Senior Economist Federal Reserve Bank of Boston Disclaimer: The views expressed here are
Guidance in Uncertain Times. Alex Chausovsky Senior Analyst
 Guidance in Uncertain Times Alex Chausovsky Senior Analyst 1 216 Forecast Results 2 Duration Accuracy US GDP 15 99.1% US Ind. Prod. 1 99.9% Eur Ind. Prod. 15 99.2% CanadaInd Prod 15 99.6% China Ind Prod
Appendices Charts & Tables
 Financial Crisis Inquiry Commission Hearing September 8, 2010 Las Vegas, NV Appendices Charts & Tables Financial Crisis Inquiry Commission 1 Selected National Comparisons Financial Crisis Inquiry Commission
Statistical Release Gross Domestic Product First Quarter 2012
 Statistical Release Gross Domestic Product First Quarter 2012 1.0 Economic performance Provisional estimates for the first quarter of 2012 show that the economy exped by 3.5 per cent over a similar quarter
Kenya at the tipping Point?
 Kenya at the tipping Point? with a special focus on the ICT revolution and Mobile Money World Bank Economic Team Presentation by Jane Kiringai Nairobi December 2, 2010 Main messages 1 2 Kenya may now be
Baird Family Wealth Group
 Baird Family Wealth Group Presents: Brian Beaulieu September 7, 216 www.bairdfamilywealthgroup.com Milwaukee 777 East Wisconsin Avenue Milwaukee, WI 5322 414-765-792 Dallas 595 Berkshire Lane Dallas, TX
Houston Economy Update. Patrick Jankowski
 Houston Economy Update Patrick Jankowski Worst is over 2 $ Per Barrel NYMEX WTI Spot Price 120 100 80 Avg. Last Week of Oct = $49/barrel 60 40 20 0 Jun '14 Dec '14 Jun '15 Dec '15 Jun '16 Dec '16 Source:
North American Wholesale Lumber Association Winds of Change
 Alex Chausovsky Senior Consulting Advisor North American Wholesale Lumber Association Winds of Change 217 Forecast Results If you heard ITR around two years ago 2 Duration Accuracy US GDP 24 99.7% US Ind.
Risk Management in Monetary Policymaking
 EMBARGOED UNTIL TUESDAY, MARCH 5, 219, AT 7:35 A.M.; OR UPON DELIVERY Risk Management in Monetary Policymaking Eric S. Rosengren President & CEO Federal Reserve Bank of Boston National Association of Corporate
Hydraulic Institute Annual Conference A Good Year Ahead
 Hydraulic Institute Annual Conference A Good Year Ahead Dr. Alan Beaulieu President Preliminary 216 Forecast Results 2 Duration Accuracy US GDP 15 99.5% US Ind. Prod. 1 99.8% Eur Ind. Prod. 15 99.2% Canada
Annual Report on the Northeast Florida Housing Market FOR RESIDENTIAL REAL ESTATE ACTIVITY FROM THE NORTHEAST FLORIDA ASSOCIATION OF REALTORS MLS
 Annual Report on the Northeast Florida Housing Market FOR RESIDENTIAL REAL ESTATE ACTIVITY FROM THE NORTHEAST FLORIDA ASSOCIATION OF REALTORS MLS Annual Report on the Northeast Florida Housing Market FOR
Monthly Indicators + 1.4% + 6.4% % Activity Overview New Listings Pending Sales. Closed Sales. Days on Market Until Sale. Median Sales Price
 Monthly Indicators 2018 Last year, U.S. consumers seemed to be operating with a renewed but cautious optimism. The stock market was strong, wages were edging upwards and home buying activity was extremely
Connector Industry Forecast
 Report No.: F 2017 01 June 2017 Bishop & Associates has just released the Connector Industry Forecast. This eight-chapter report provides an in-depth, and detailed forecast of the worldwide connector Industry.
FY 2014 Port Everglades Proposed Budget
 FY 2014 Port Everglades Proposed Budget County Commission Vision and Goals Applicable to Port Everglades Efficient and accessible regional intermodal transportation network Develop and enhance sustainable
Fab Investment Outlook Foundry, Memory and LED. Clark Tseng, Sr. Research Manager Industry Research & Statistics, SEMI
 Fab Investment Outlook Foundry, Memory and LED Clark Tseng, Sr. Research Manager Industry Research & Statistics, SEMI Outline Fab Investment & Capacity Trend Memory and Foundry Investment Outlook LED Investment
BERKS COUNTY ESTATE PLANNING COUNCIL The U.S. Economic Outlook *
 BERKS COUNTY ESTATE PLANNING COUNCIL The U.S. Economic Outlook * September 17 th, 2015 FEDERAL RESERVE BANK OF PHILADELPHIA * The views expressed today are my own and not necessarily those of the Federal
Asian Development Outlook 2011 South-South Economic Links
 Asian Development Outlook 2011 South-South Economic Links Joseph E. Zveglich, Jr. Assistant Chief Economist Economics and Research Department OECD Development Centre Paris 8 April 2011 Outline Economic
Petroleum Equipment Institute. A Bend in the Road. Brian Beaulieu CEO. First in Forecasts Since 1948
 Petroleum Equipment Institute A Bend in the Road Brian Beaulieu CEO 217 Forecast Results If you heard ITR around two years ago 2 Duration Accuracy US GDP 24 99.7% US Ind. Prod. 24 96.8% Europe Ind. Prod.
Economics: Principles in Action 2005 Correlated to: Indiana Family and Consumer Sciences Education, Consumer Economics (High School, Grades 9-12)
") Indiana Family and Consumer Sciences Education, Consumer Economics Consumer Economics 1.0 PROCESSES: Explain, demonstrate, and integrate processes of thinking, communication, leadership, and management
Indiana Family and Consumer Sciences Education, Consumer Economics Consumer Economics 1.0 PROCESSES: Explain, demonstrate, and integrate processes of thinking, communication, leadership, and management
October Machinery Orders
 Japan's Economy 13 December 2017 (No. of pages: 6) October Machinery Orders Manufacturing industry shows strong growth trend Japanese report: 13 Dec 2017 Economic Research Dept. Kazuma Maeda Shunsuke Kobayashi
Connector Industry Forecast
 Connector Industry Forecast Report No.: F-2018-01 July 2018 Bishop & Associates has just released the Connector Industry Forecast. This eight-chapter report provides an in-depth, and detailed forecast
BEIGE BOOK: WINDOW ON MAIN STREET
 LPL RESEARCH WEEKLY ECONOMIC COMMENTARY KEY TAKEAWAYS The latest Beige Book suggests that the U.S. economy is still growing at its long-term trend. However, the latest assessment from Main Street suggests
Quarterly Sales (in millions) FY 16 FY 15 FY 14 Q1 $706.8 $731.1 $678.5 Q Q Q
 FY 16 FY 15 FY 14 Q1 $706.8 $731.1 $678.5 Q Q Q") The following represents historical unaudited financial and statistical information regarding MSC s operations. MSC does not undertake any obligation to update any of the information presented below to
The following represents historical unaudited financial and statistical information regarding MSC s operations. MSC does not undertake any obligation to update any of the information presented below to
Single Family Months of Inventory. Condo Months of Inventory. May calgary regional housing market statistics
 May 211 calgary regional housing market statistics INNER CITY HOUSING MARKET LEADS IN SALES Buyers find value in inner city communities Total Single Family Months of Inventory Calgary, June 1, 211 According
Prentice Hall: Economics Principles in Action 2005 Correlated to: Kansas Social Studies Standards (High School)
") Prentice Hall: Economics Principles in Action 2005 Kansas Social Studies Standards (High School) High School Economics Standard: The student uses a working knowledge and understanding of major economic
Prentice Hall: Economics Principles in Action 2005 Kansas Social Studies Standards (High School) High School Economics Standard: The student uses a working knowledge and understanding of major economic
DBMS Software Market Forecast, (Executive Summary) Executive Summary
 Executive Summary") DBMS Software Market Forecast, 2003-2007 (Executive Summary) Executive Summary Publication Date: 4 September 2003 Author Colleen Graham This document has been published to the following Marketplace codes:
DBMS Software Market Forecast, 2003-2007 (Executive Summary) Executive Summary Publication Date: 4 September 2003 Author Colleen Graham This document has been published to the following Marketplace codes:
Economic situation and outlook
 Economic situation and outlook ELECTRONICS AND ELECTROTECHNICAL INDUSTRY MECHANICAL ENGINEERING METALS INDUSTRY CONSULTING ENGINEERING INFORMATION TECHNOLOGY Global and Finnish Economic Outlook Better
Revenues % % Gross operating margin % %
 Revenues 64.0 70.7 +10% 121.5 135.1 +11% Gross operating margin 34.0 34.8 +3% 63.5 69.5 +10% % of revenues 53.1% 49.3% 52.3% 51.5% Income from ordinary operations 7.8 8.7 +11% 16.1 16.7 +4% % of revenues
UNC. February 18, Robert M. White, Jr. CRE, FRICS
 UNC February 18, 2010 Robert M. White, Jr. CRE, FRICS The Roller Coaster Decade US Annual Property Sales office, industrial, apartment, retail properties $5 million and greater Billions $500 $450 Individual
Disaster Economic Impact
 Hurricanes Disaster Economic Impact Immediate Impact 6-12 Months Later Loss of Jobs Declining Home Sales Strong Job Growth Rising Home Sales Punta Gorda MSA Employment Thousands Seasonally Adjusted 50
TCL International Holdings Limited FY2000 Review & Outlook
 TCL International Holdings Limited FY2000 Review & Outlook Mr. Vincent Yan, Executive Director March 2001 Agenda Company Background FY2000 Overview PRC Economic Outlook Home Appliances IT Business Corporate
Full Employment or Bust
 Global Economic Outlook Issues, 1 st Annual Economic Forecast Luncheon, Chase-W. P. Carey School of Business, Arizona State University, Phoenix, Arizona, December 3, 1. When will the Fed s rates go back
Cincinnati Bell Third Quarter 2011 Results. November 3, 2011
 Cincinnati Bell Third Quarter 2011 Results November 3, 2011 Today s Agenda Performance Highlights Jack Cassidy, President & Chief Executive Officer Review of Wireline, Wireless, IT Services & Hardware
Hitachi Announces Consolidated Financial Results for the First Quarter of Fiscal 2006
 FOR IMMEDIATE RELEASE Hitachi Announces Consolidated Financial Results for the First Quarter of Fiscal 2006 Tokyo, July 31, 2006 --- Hitachi, Ltd. (NYSE:HIT / TSE:6501) today announced its consolidated
Business Result for the Second Quarter ended September 30, 2017 Regional Market Environments and Projections
 Business Result for the Second Quarter ended September 3, 217 Regional Market Environments and Projections October 2, 217 Hitachi Construction Machinery Co., Ltd. Executive Vice President and Executive
Fab Investment Outlook Foundry, Memory and LED. Clark Tseng, Sr. Research Manager, SEMI Vietnam Semiconductor Strategy Summit September 16-17, 20214
 Fab Investment Outlook Foundry, Memory and LED Clark Tseng, Sr. Research Manager, SEMI Vietnam Semiconductor Strategy Summit September 16-17, 20214 Outline Fab Investment & Capacity Trend Memory and Foundry
Why Japan? Masashi Nakazono JETRO Genève. Prepared for Handelskammer beider Basel & JETRO seminar on 4 Nov 2016
 Why Japan? Masashi Nakazono JETRO Genève Prepared for Handelskammer beider Basel & JETRO seminar on 4 Nov 2016 Copyright (C) 2016 JETRO. All rights reserved. Who are we? Japan External Trade Organization
Verizon closes 2017 with strong wireless customer growth and retention, well-positioned in new markets
 News Release FOR IMMEDIATE RELEASE January 23, 2018 Media contact: Bob Varettoni 908.559.6388 robert.a.varettoni@verizon.com Verizon closes 2017 with strong wireless customer growth and retention, well-positioned
2017 Container Shipping Outlook A look at the demand drivers in the midst of political and policy uncertainties
 2017 Container Shipping Outlook A look at the demand drivers in the midst of political and policy uncertainties Long Beach, February 27, 2017 Mario.Moreno@ihsmarkit.com Agenda US containerized imports
Socioeconomic Overview of Ohio
 2 Socioeconomic Overview of Ohio Introduction The magnitude of the economic impact of Ohio s airports is linked to the demand that is generated within the state for aviation goods and services. As population,
THE STATE OF FREIGHT: RAIL AND INTERMODAL
 Larry Gross Partner FTR 888.988.1699 x41 lgross@ftrintel.com @Intermodalist THE STATE OF FREIGHT: RAIL AND INTERMODAL Railtrends Conference Nov 19, www.ftrintel.com www.ftrintel.com 1 11/19/15 DISCUSSION
Is Something Wrong with Texas Home Prices?
 Is Something Wrong with Texas Home Prices? Finding Shelter: Affordability Squeeze in a Tight Texas Housing Market Dallas Federal Reserve February 23, 2018 Constrained supply plus strong demand = accelerated
4Q and FY 2011 Financial Results. February 22, 2012
 4Q and FY 2011 Financial Results February 22, 2012 Note on Forward-Looking Statements This presentation may contain forward-looking statements regarding expected developments and expectations about future
9 th Annual Norfolk Southern Short Line Marketing Meeting
 9 th Annual Norfolk Southern Short Line Marketing Meeting July 12, 2010 Donald W. Seale Executive Vice President and Chief Marketing Officer Economic Overview (AKA) Hopes Wishes Aspirations Guesses The
Regional Real Estate Trends
 Regional Real Estate Trends Terry L. Clower, Ph.D. Director, Center for Regional Analysis Schar School of Policy and Government George Mason University April 6, 2018 140.0 120.0 100.0 80.0 60.0 40.0 20.0